

PDF: 1050 KB - Bureau of Infrastructure, Transport and Regional ...
PDF: 1050 KB - Bureau of Infrastructure, Transport and Regional ...
PDF: 1050 KB - Bureau of Infrastructure, Transport and Regional ...
- No tags were found...

Create successful ePaper yourself
Turn your PDF publications into a flip-book with our unique Google optimized e-Paper software.
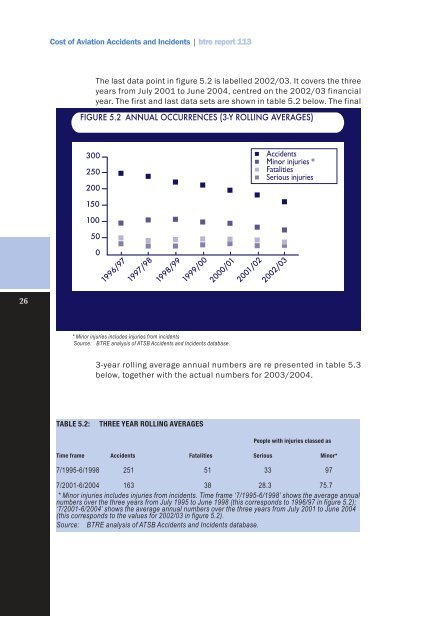
Cost <strong>of</strong> Aviation Accidents <strong>and</strong> Incidents | btre report 113The last data point in figure 5.2 is labelled 2002/03. It covers the threeyears from July 2001 to June 2004, centred on the 2002/03 financialyear. The first <strong>and</strong> last data sets are shown in table 5.2 below. The finalFIGURE 5.2 ANNUAL OCCURRENCES (3-Y ROLLING AVERAGES)300250200AccidentsMinor injuries *FatalitiesSerious injuries1501005001996/971997/981998/991999/002000/012001/022002/0326* Minor injuries includes injuries from incidentsSource: BTRE analysis <strong>of</strong> ATSB Accidents <strong>and</strong> Incidents database.3-year rolling average annual numbers are re presented in table 5.3below, together with the actual numbers for 2003/2004.TABLE 5.2:THREE YEAR ROLLING AVERAGESPeople with injuries classed asTime frame Accidents Fatalities Serious Minor*7/1995-6/1998 251 51 33 977/2001-6/2004 163 38 28.3 75.7* Minor injuries includes injuries from incidents. Time frame ‘7/1995-6/1998’ shows the average annualnumbers over the three years from July 1995 to June 1998 (this corresponds to 1996/97 in figure 5.2);‘7/2001-6/2004’ shows the average annual numbers over the three years from July 2001 to June 2004(this corresponds to the values for 2002/03 in figure 5.2).Source: BTRE analysis <strong>of</strong> ATSB Accidents <strong>and</strong> Incidents database.


