Tutorial for the WGCNA package for R - UCLA Human Genetics
Tutorial for the WGCNA package for R - UCLA Human Genetics
Tutorial for the WGCNA package for R - UCLA Human Genetics

You also want an ePaper? Increase the reach of your titles
YUMPU automatically turns print PDFs into web optimized ePapers that Google loves.
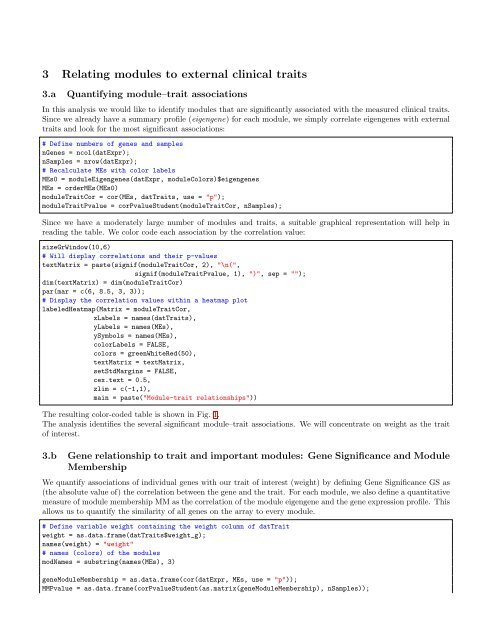
3 Relating modules to external clinical traits3.a Quantifying module–trait associationsIn this analysis we would like to identify modules that are significantly associated with <strong>the</strong> measured clinical traits.Since we already have a summary profile (eigengene) <strong>for</strong> each module, we simply correlate eigengenes with externaltraits and look <strong>for</strong> <strong>the</strong> most significant associations:# Define numbers of genes and samplesnGenes = ncol(datExpr);nSamples = nrow(datExpr);# Recalculate MEs with color labelsMEs0 = moduleEigengenes(datExpr, moduleColors)$eigengenesMEs = orderMEs(MEs0)moduleTraitCor = cor(MEs, datTraits, use = "p");moduleTraitPvalue = corPvalueStudent(moduleTraitCor, nSamples);Since we have a moderately large number of modules and traits, a suitable graphical representation will help inreading <strong>the</strong> table. We color code each association by <strong>the</strong> correlation value:sizeGrWindow(10,6)# Will display correlations and <strong>the</strong>ir p-valuestextMatrix = paste(signif(moduleTraitCor, 2), "\n(",signif(moduleTraitPvalue, 1), ")", sep = "");dim(textMatrix) = dim(moduleTraitCor)par(mar = c(6, 8.5, 3, 3));# Display <strong>the</strong> correlation values within a heatmap plotlabeledHeatmap(Matrix = moduleTraitCor,xLabels = names(datTraits),yLabels = names(MEs),ySymbols = names(MEs),colorLabels = FALSE,colors = greenWhiteRed(50),textMatrix = textMatrix,setStdMargins = FALSE,cex.text = 0.5,zlim = c(-1,1),main = paste("Module-trait relationships"))The resulting color-coded table is shown in Fig. 1.The analysis identifies <strong>the</strong> several significant module–trait associations. We will concentrate on weight as <strong>the</strong> traitof interest.3.b Gene relationship to trait and important modules: Gene Significance and ModuleMembershipWe quantify associations of individual genes with our trait of interest (weight) by defining Gene Significance GS as(<strong>the</strong> absolute value of) <strong>the</strong> correlation between <strong>the</strong> gene and <strong>the</strong> trait. For each module, we also define a quantitativemeasure of module membership MM as <strong>the</strong> correlation of <strong>the</strong> module eigengene and <strong>the</strong> gene expression profile. Thisallows us to quantify <strong>the</strong> similarity of all genes on <strong>the</strong> array to every module.# Define variable weight containing <strong>the</strong> weight column of datTraitweight = as.data.frame(datTraits$weight_g);names(weight) = "weight"# names (colors) of <strong>the</strong> modulesmodNames = substring(names(MEs), 3)geneModuleMembership = as.data.frame(cor(datExpr, MEs, use = "p"));MMPvalue = as.data.frame(corPvalueStudent(as.matrix(geneModuleMembership), nSamples));