

Equity Income Fund Annual Report - Putnam Investments
Equity Income Fund Annual Report - Putnam Investments
Equity Income Fund Annual Report - Putnam Investments

You also want an ePaper? Increase the reach of your titles
YUMPU automatically turns print PDFs into web optimized ePapers that Google loves.
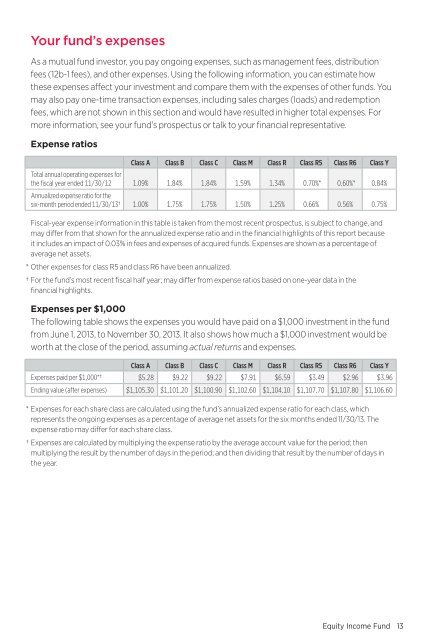
Your fund’s expensesAs a mutual fund investor, you pay ongoing expenses, such as management fees, distributionfees (12b-1 fees), and other expenses. Using the following information, you can estimate howthese expenses affect your investment and compare them with the expenses of other funds. Youmay also pay one-time transaction expenses, including sales charges (loads) and redemptionfees, which are not shown in this section and would have resulted in higher total expenses. Formore information, see your fund’s prospectus or talk to your financial representative.Expense ratiosClass A Class B Class C Class M Class R Class R5 Class R6 Class YTotal annual operating expenses forthe fiscal year ended 11/30/12 1.09% 1.84% 1.84% 1.59% 1.34% 0.70%* 0.60%* 0.84%<strong>Annual</strong>ized expense ratio for thesix-month period ended 11/30/13† 1.00% 1.75% 1.75% 1.50% 1.25% 0.66% 0.56% 0.75%Fiscal-year expense information in this table is taken from the most recent prospectus, is subject to change, andmay differ from that shown for the annualized expense ratio and in the financial highlights of this report becauseit includes an impact of 0.03% in fees and expenses of acquired funds. Expenses are shown as a percentage ofaverage net assets.* Other expenses for class R5 and class R6 have been annualized.† For the fund’s most recent fiscal half year; may differ from expense ratios based on one-year data in thefinancial highlights.Expenses per $1,000The following table shows the expenses you would have paid on a $1,000 investment in the fundfrom June 1, 2013, to November 30, 2013. It also shows how much a $1,000 investment would beworth at the close of the period, assuming actual returns and expenses.Class A Class B Class C Class M Class R Class R5 Class R6 Class YExpenses paid per $1,000*† $5.28 $9.22 $9.22 $7.91 $6.59 $3.49 $2.96 $3.96Ending value (after expenses) $1,105.30 $1,101.20 $1,100.90 $1,102.60 $1,104.10 $1,107.70 $1,107.80 $1,106.60* Expenses for each share class are calculated using the fund’s annualized expense ratio for each class, whichrepresents the ongoing expenses as a percentage of average net assets for the six months ended 11/30/13. Theexpense ratio may differ for each share class.† Expenses are calculated by multiplying the expense ratio by the average account value for the period; thenmultiplying the result by the number of days in the period; and then dividing that result by the number of days inthe year.<strong>Equity</strong> <strong>Income</strong> <strong>Fund</strong> 13


