Speaking to and About Patients: Predicting Therapists' Tone of Voice
Speaking to and About Patients: Predicting Therapists' Tone of Voice
Speaking to and About Patients: Predicting Therapists' Tone of Voice
You also want an ePaper? Increase the reach of your titles
YUMPU automatically turns print PDFs into web optimized ePapers that Google loves.
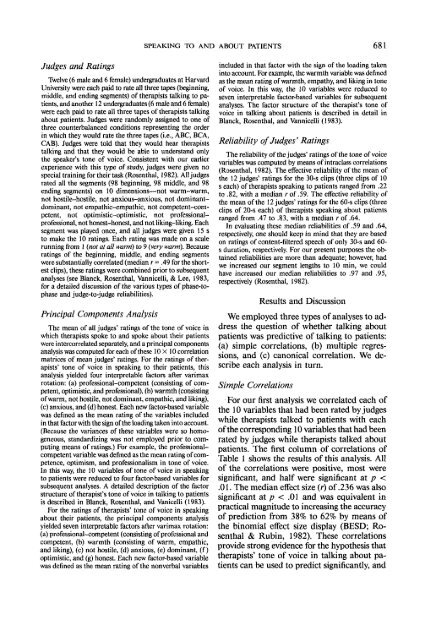
Judges <strong>and</strong> RatingsTwelve (6 male <strong>and</strong> 6 female) undergraduates at HarvardUniversity were each paid <strong>to</strong> rate all three tapes (beginning,middle, <strong>and</strong> ending segments) <strong>of</strong> therapists talking <strong>to</strong> patients,<strong>and</strong> another 12 undergraduates (6 male <strong>and</strong> 6 female)were each paid <strong>to</strong> rate all three tapes <strong>of</strong> therapists talkingabout patients. Judges were r<strong>and</strong>omly assigned <strong>to</strong> one <strong>of</strong>three counterbalanced conditions representing the orderin which they would rate the three tapes (i.e., ABC, BCA,CAB). Judges were <strong>to</strong>ld that they would hear therapiststalking <strong>and</strong> that they would be able <strong>to</strong> underst<strong>and</strong> onlythe speaker's <strong>to</strong>ne <strong>of</strong> voice. Consistent with our earlierexperience with this type <strong>of</strong> study, judges were given nospecial training for their task (Rosenthal, 1982). All judgesrated all the segments (98 beginning, 98 middle, <strong>and</strong> 98ending segments) on 10 dimensions—not warm-warm,not hostile-hostile, not anxious-anxious, not dominantdominant,not empathic-empathic, not competent-competent,not optimistic-optimistic, not pr<strong>of</strong>essionalpr<strong>of</strong>essional,not honest-honest, <strong>and</strong> not liking-liking. Eachsegment was played once, <strong>and</strong> all judges were given 15s<strong>to</strong> make the 10 ratings. Each rating was made on a scalerunning from 1 (not at all warm) <strong>to</strong> 9 (very warm). Becauseratings <strong>of</strong> the beginning, middle, <strong>and</strong> ending segmentswere substantially correlated (median r ?= .49 for the shortestclips), these ratings were combined prior <strong>to</strong> subsequentanalyses (see Blanck, Rosenthal, Vannicelli, & Lee, 1983,for a detailed discussion <strong>of</strong> the various types <strong>of</strong> phase-<strong>to</strong>phase<strong>and</strong> judge-<strong>to</strong>-judge reliabilities).Principal Components AnalysisThe mean <strong>of</strong> all judges' ratings <strong>of</strong> the <strong>to</strong>ne <strong>of</strong> voice inwhich therapists spoke <strong>to</strong> <strong>and</strong> spoke about their patientswere intercorrelated separately, <strong>and</strong> a principal componentsanalysis was computed for each <strong>of</strong> these 10X10 correlationmatrices <strong>of</strong> mean judges' ratings. For the ratings <strong>of</strong> therapists'<strong>to</strong>ne <strong>of</strong> voice in speaking <strong>to</strong> their patients, thisanalysis yielded four interpretable fac<strong>to</strong>rs after varimaxrotation: (a) pr<strong>of</strong>essional-competent (consisting <strong>of</strong> competent,optimistic, ind pr<strong>of</strong>essional), (b) warmth (consisting<strong>of</strong> warm, not hostile, not dominant, empathic, <strong>and</strong> liking),(c) anxious, <strong>and</strong> (d) honest. Each new fac<strong>to</strong>r-based variablewas denned as the mean rating <strong>of</strong> the variables includedin that fac<strong>to</strong>r with the sign <strong>of</strong> the loading taken in<strong>to</strong> account.(Because the variances <strong>of</strong> these variables were so homogeneous,st<strong>and</strong>ardizing was not employed prior <strong>to</strong> computingmeans <strong>of</strong> ratings.) For example, the pr<strong>of</strong>essionalcompetentvariable was denned as the mean rating <strong>of</strong> competence,optimism, <strong>and</strong> pr<strong>of</strong>essionalism in <strong>to</strong>ne <strong>of</strong> voice.In this way, the 10 variables <strong>of</strong> <strong>to</strong>ne <strong>of</strong> voice in speaking<strong>to</strong> patients were reduced <strong>to</strong> four fac<strong>to</strong>r-based variables forsubsequent analyses. A detailed description <strong>of</strong> the fac<strong>to</strong>rstructure <strong>of</strong> therapist's <strong>to</strong>ne <strong>of</strong> voice in talking <strong>to</strong> patientsis described in Blanck, Rosenthal, <strong>and</strong> Vanicelli (1983).For the ratings <strong>of</strong> therapists' <strong>to</strong>ne <strong>of</strong> voice in speakingabout their patients, the principal components analysisyielded seven interpretable fac<strong>to</strong>rs after varimax rotation:(a) pr<strong>of</strong>essional-competent (consisting <strong>of</strong> pr<strong>of</strong>essional <strong>and</strong>competent, (b) warmth (consisting <strong>of</strong> warm, empathic,<strong>and</strong> liking), (c) not hostile, (d) anxious, (e) dominant, (f)optimistic, <strong>and</strong> (g) honest. Each new fac<strong>to</strong>r-based variablewas denned as the mean rating <strong>of</strong> the nonverbal variablesSPEAKING TO AND ABOUT PATIENTS 681included in that fac<strong>to</strong>r with the sign <strong>of</strong> the loading takenin<strong>to</strong> account. For example, the warmth variable was dennedas the mean rating <strong>of</strong> warmth, empathy, <strong>and</strong> liking in <strong>to</strong>ne<strong>of</strong> voice. In this way, the 10 variables were reduced <strong>to</strong>seven interpretable fac<strong>to</strong>r-based variables for subsequentanalyses. The fac<strong>to</strong>r structure <strong>of</strong> the therapist's <strong>to</strong>ne <strong>of</strong>voice in talking about patients is described in detail inBlanck, Rosenthal, <strong>and</strong> Vannicelli (1983).Reliability <strong>of</strong> Judges' RatingsThe reliability <strong>of</strong> the judges' ratings <strong>of</strong> the <strong>to</strong>ne <strong>of</strong> voicevariables was computed by means <strong>of</strong> intraclass correlations(Rosenthal, 1982). The effective reliability <strong>of</strong> the mean <strong>of</strong>the 12 judges' ratings for the 30-s clips (three clips <strong>of</strong> 10s each) <strong>of</strong> therapists speaking <strong>to</strong> patients ranged from .22<strong>to</strong> .82, with a median r <strong>of</strong> .59. The effective reliability <strong>of</strong>the mean <strong>of</strong> the 12 judges' ratings for the 60-s clips (threeclips <strong>of</strong> 20-s each) <strong>of</strong> therapists speaking about patientsranged from .47 <strong>to</strong> .83, with a median r <strong>of</strong> .64.In evaluating these median reliabilities <strong>of</strong> .59 <strong>and</strong> .64,respectively, one should keep in mind that they are basedon ratings <strong>of</strong> content-filtered speech <strong>of</strong> only 30-s <strong>and</strong> 60-s duration, respectively. For our present purposes the obtainedreliabilities are more than adequate; however, hadwe increased our segment lengths <strong>to</strong> 10 min, we couldhave increased our median reliabilities <strong>to</strong> .97 <strong>and</strong> .95,respectively (Rosenthal, 1982).Results <strong>and</strong> DiscussionWe employed three types <strong>of</strong> analyses <strong>to</strong> addressthe question <strong>of</strong> whether talking aboutpatients was predictive <strong>of</strong> talking <strong>to</strong> patients:(a) simple correlations, (b) multiple regressions,<strong>and</strong> (c) canonical correlation. We describeeach analysis in turn.Simple CorrelationsFor our first analysis we correlated each <strong>of</strong>the 10 variables that had been rated by judgeswhile therapists talked <strong>to</strong> patients with each<strong>of</strong> the corresponding 10 variables that had beenrated by judges while therapists talked aboutpatients. The first column <strong>of</strong> correlations <strong>of</strong>Table 1 shows the results <strong>of</strong> this analysis. All<strong>of</strong> the correlations were positive, most weresignificant, <strong>and</strong> half were significant at p


