The rock manual - Dredging Engineering Research Laboratory
The rock manual - Dredging Engineering Research Laboratory
The rock manual - Dredging Engineering Research Laboratory

You also want an ePaper? Increase the reach of your titles
YUMPU automatically turns print PDFs into web optimized ePapers that Google loves.
2 Terra et Aqua | Number 110 | March 2008EditorialTERRA ETAQUAAs you have seen on the cover, we have described this first issue of Terra in 2008 with two words:“<strong>Dredging</strong> Rocks!” Now these words have a double meaning. To begin with, this issue focusses onvarious aspects of <strong>rock</strong> when dredging -- installing <strong>rock</strong> and removing <strong>rock</strong>. First of all, there is theprecision installation of <strong>rock</strong> to safeguard the integrity of subsea pipelines; and secondly, the removalof extremely hard <strong>rock</strong> utilising a new, stronger generation ripper draghead. In both cases the articlesdescribe the high-tech material in use in the dredging industry and the important investments whichthe industry makes in ongoing R&D. In addition, a review is included of a recent book, published byCIRIA, <strong>The</strong> Rock Manual. This 1260 page tome should be entitled, “Everything you ever wanted toknow about <strong>rock</strong> and didn’t dare to ask.”But “<strong>Dredging</strong> Rocks!” has another meaning: Taken in the vernacular it means dredging is <strong>rock</strong>ing,it’s vibrant, it’s growing. It describes an industry that has retooled itself, not only with newer andbetter machinery, but also with a younger generation of employees. A dynamic industry wherepeople are enthusiastic and excited. Dedicated and innovative. And where experienced staff membersare anxious to welcome the next generation of staff onboard.Two such young professionals are the researchers whose award winning papers are published in thisissue of Terra. One author was presented with the IADC Best Paper Award for Young Authors atCEDA <strong>Dredging</strong> Days last November. <strong>The</strong> other received the CEDA Environmental Commission Awardat the Black Sea Coastal Association Conference on Port Development and Coastal Environment,September 2007, in Varna, Bulgaria. Both of these engineers are examples of the kind of fresh talentworking in the dredging and maritime construction industry. <strong>The</strong>y are young professionals whoseenergy is keeping the industry looking forward. <strong>The</strong>y are deeply involved in their research, and aretaking the initiative to improve technologies and forge a way into the future. A spark of idealismignites their work, because, while they build on the scientific information of the past, they clearlybelieve we can do things even better in the future. <strong>The</strong>ir contributions to our knowledge aboutdredging, environment and cost-efficient solutions are invaluable to our industry.As dredging and maritime construction has become increasingly complicated, these younger workersare symbolic of one very simple tradition that has remained intact. Many IADC companies began asfamily businesses in which mutual respect for each other created strong bonds. Nowadays, althoughthe companies have merged and grown, these basic bonds of comradeship and support remainsteadfast amongst our dredging colleagues, crewmembers and engineers.Koos van OordPresident, IADC
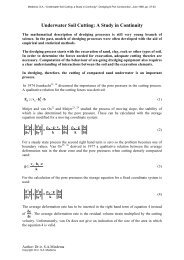
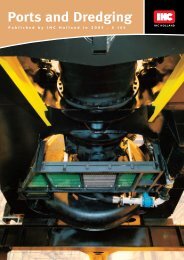
4 Terra et Aqua | Number 110 | March 2008Figure 1. <strong>The</strong> basicdesign of supports(in brown) and counterfills (in green) for axiallocking, preventingupheaval buckling andphysical protection isbasically identical(in green).Figure 2. Free spanmitigation supports(in green) includingcounterfills (in grey)for geotechnicalstability.<strong>rock</strong>. At this stage a new solution wasdeveloped entailing the use of a fallpipe inorder to guide the <strong>rock</strong>s over a greaterwater depth (Figure 5). At the end of the1970s a telescopic fallpipe was developedfor <strong>rock</strong> installation at even greater waterdepths inducing large (drag and gravity)forces on the fallpipe.In 1985 the MV Trollnes was equipped witha flexible fallpipe consisting of a string ofbottomless buckets along two chains.At the lower end of the string a remotelyoperated, self-propelled vehicle (ROV) wasattached. This ROV secured more accurateplacement of the <strong>rock</strong> amongst others bycorrecting the off-setting by currents.<strong>The</strong> success of this technique has beenproven during the past decades andresulted in the commissioning of two moreFlexible Fall Pipe Vessels (FFPVs), the Tertnes(9,500 tonnes) (Figure 6) and the Nordnes(24,000 tonnes) (Figure 7). A new FFPV isunder construction and will be operationalin the first half of 2009.ALTERNATIVES TO SRIFigure 3. A supportfor a pipeline crossing(in green) and counterfills(in grey).<strong>The</strong>re are different alternatives to SRI forthe physical protection and upheavalbuckling mitigation of offshore pipelines.<strong>The</strong> most commonly used method is toapply a thicker armour layer or shell aroundthe pipe, to cover it with concrete mattressesor to install the pipeline in a trench.A BRIEF HISTORY OF SUBSEA ROCKINSTALLATIONRock has been used for protection purposesfor hundreds of years, e.g. for dikes andbreakwaters. At first the installation of <strong>rock</strong>was done from ashore and from a vessel byhand (Figure 4). About fifty years ago thefirst automated <strong>rock</strong> dumping vessels weredesigned, built, tested and used for themassive Delta Works in <strong>The</strong> Netherlands.<strong>The</strong> <strong>rock</strong> was placed on deck and shovedover the side and fell through the watercolumn to the designated location on theseabed. Nowadays this technique is stillused and is referred to as side-stonedumping (Figure 5). With the increase ofprojects at greater water depths, theaccuracy of <strong>rock</strong> placement was decreasingbecause of currents and dispersing of theInstead of SRI for free-span mitigation, thepipe can also be supported with concreteelements or steel frames. Another option isto dredge the higher spots (applying theso-called pre-sweeping technique) to createa more even seabed, thus reducing thelength of the free-spans. For a crossingwith an existing pipeline, concretemattresses may be used between the twopipes to avoid damage to both pipelines.In general environmental conditions, thetechnical feasibility and cost aspects areconsidered after which eventually the mostefficient and economic solution is chosen.Subsea <strong>rock</strong> installation is considered to bea competitive and reliable method toensure the pipeline’s integrity.
Immediate Displacement of the Seabed During Subsea Rock Installation (SRI) 5RENÉ VISSERis an engineer at the <strong>Engineering</strong>Department of Van Oord DMC.After graduating in Physical Geographyin Utrecht, he worked for a consultingcompany for high-end water-relatedinstruments. In 2000 he joined thedredging industry, where his specialtyis in quantitative risk analyses, projectengineering, soil investigations andcivil engineering.Figure 4. Installationof <strong>rock</strong> was done fromashore and froma vessel by hand.JOOP VAN DER MEERworked for many years in civil engineeringwith international consultants. In 2000he joined Van Oord DMC as a seniorengineer at the <strong>Engineering</strong> Department.He is primarily involved with projectswhich have a special emphasis ongeotechnical aspects related to landreclamation, retaining- and offshorestructures.Side-stonedumpingDischarge throughfallpipestate, currents, survey quality, water depth,support size, <strong>rock</strong> installation rate andexperience of personnel onboard. Usuallythe losses can be determined based onexpertise from previous projects. Immediatedisplacement will be described in detailbelow.IMMEDIATE DISPLACEMENTENGINEERINGGeneralIf subsea <strong>rock</strong> installation is required, theconsultant assisting the operator and/orpipelaying company designs <strong>rock</strong> supportsfocussing on pipeline integrity and geotechnicalstability of the subsoil at thelocation where the pipeline will be installed.<strong>The</strong> subsea <strong>rock</strong> installation contractor isthen requested to perform the followingactions:1. review the design in order to optimisethe installation efficiency2. calculate the theoretical volume and thenecessary practical tonnage of <strong>rock</strong>3. check the geotechnical stability analysis(which is mostly done by an independentthird party)4. make project procedures andconstruction drawings for the FFPVs.Review of the design is necessary as theClient will only give a so-called minimaldesign that fulfils the basic requirementsfor the pipeline integrity and the geotechnicalstability.Figure 5. Schematic drawing of two methods of <strong>rock</strong>placement.In some cases the installation efficiency canbe improved by adaptations to the basicdesign, for instance, by installing counterfills with a sloping top surface instead ofbuilding up several terraces in a timeconsumingoperation.<strong>The</strong>oretical vs practical volume<strong>The</strong> total required volume of <strong>rock</strong> for onesupport can be determined when thefollowing items are taken into account:• <strong>The</strong>oretical <strong>rock</strong> volume required toinstall the support• Installation losses during operations• Immediate displacements of the seabed.<strong>The</strong>se items are graphically shown inFigure 8. <strong>The</strong> theoretical volume betweenthe model and the original seabed can becalculated accurately using Digital TerrainModel (DTM) software. <strong>The</strong> installationlosses depend on several aspects like seaDuring <strong>rock</strong> installation a number of effectstake place on the seabed. <strong>The</strong>se processesare called immediate displacement.<strong>The</strong> following phenomena have beenrecognised to contribute to immediatedisplacement:• surface erosion;• penetration of <strong>rock</strong> particles into theseabed and material flow into the <strong>rock</strong>skeleton;• immediate deformations of the subsoil.Each of the above-mentioned phenomenawill be discussed below. <strong>The</strong> long-termsettlements caused by drainage of subsoilsunder pressure and creep have not beenconsidered in this article. A practical way ofdealing with long-term settlements is toinstall the <strong>rock</strong> in two phases.After installing approximately 80% of thefinal support height, the final 20% can beinstalled to the final design height when aperiod of 3 to 6 months for subsoil settlementhas been allowed for.Surface erosion<strong>The</strong> seabed is generally covered by a thinweak top layer which can be detected by
6 Terra et Aqua | Number 110 | March 2008Figure 6. <strong>The</strong> FFPV Tertnes worked on the recently completed Ormen Lange project.Figure 7. Artist’s rendering of the FFPV Nordnes workingon a pipeline crossing.survey of the seabed with multi beam echosounders. Cone Penetration Testing (CPT)is not sufficiently reliable to accuratelyassess the characteristics of this top layer.During subsea <strong>rock</strong> installation a mass flowis created within the fallpipe system. <strong>The</strong>velocity of this mass flow is in the order of4 m/sec at the end of the fallpipe when it islocated about 5 m above seabed. Owing tothis mass flow a water overpressure occursat the seabed, thus washing out the weaktop layer and resulting in surface erosion.Depending on the available soil informationan assessment of the surface erosion thatmay be expected can be made.In general the erosion varies between 0and 15 cm for hard clay or dense sandto soft clay with a water content equalto the liquid limit or very loose sandrespectively.Initial <strong>rock</strong> penetration into seabedDuring the <strong>rock</strong> installation the individualparticles will penetrate into the seabed.<strong>The</strong> penetration depth depends amongstothers on the diameter of the stone, itsvelocity at impact, and the strength as wellas the consistency of the subsoil.<strong>The</strong> penetration depth is calculated byusing the impulse balance:DvF net.Dt = m.Dv (F net=m.a=m. )Dtwhere(1)F net= net force acting on the stone [N]1m = mass of the stone = r r. p (D s) 3 [kg]6Dt = time step [s]Dv = variation in the velocity of thestone in a time step [m/s]a = acceleration of the stone [m/s 2 ]<strong>The</strong> reduction of the velocity of the stoneduring each time step can be calculatedusing:(2)F net (t)Dv =mDt<strong>The</strong> penetration finally stops when v stone= 0,so the duration of the impact, t impact, andthe initial penetration, S init, (see Figure 9)are given by (3) and (4):t=t impact(3)v bot= eDv(t)dt = 0t=0t=t impact(4)s init= e v(t)dtt=0where:v bot= stone velocity just above seabedTo solve equation (2), the resultant forceacting on the stone, F net, has to be determinedfor every t.(5)F net(t) = F gravity(t) - F archimedes(t) - F drag(t) - F bearing(t)where:F gravity(t) = gravity force on the stoneF archimedes(t) = buoyancy force (as definedby Archimedes)F drag= drag force by the water onthe stoneF bearing= force by the soil acting onthe stone as given byBrich-Hansen [1].<strong>The</strong> main results of penetration depthscalculated for a number of different claystrengths and loose sand when using <strong>rock</strong>with a diameter of 1 to 5 inch are summarisedin Table I.<strong>The</strong>re is no proven formula available tocalculate the penetration of a falling stoneinto the seabed. Due to the lack of such aformula, alternative calculation methodshave been studied. Calculations based onthe bearing capacity formula, which isoriginally meant to analyse an equilibriumcondition only, appear to provide realisticresults for the analysis of a failingmechanism as well.Additional penetration by materialflow into the <strong>rock</strong> skeletonAfter the occurrence of the initial penetration,contact stresses at the <strong>rock</strong>-subsoilinterface are increasing during furtherbuild-up of the structure. Initially and forsmall additional loads this interface isstable. When higher contact stresses
Immediate Displacement of the Seabed During Subsea Rock Installation (SRI) 7Figure 8. <strong>The</strong> total required volume of <strong>rock</strong> for one support can be determined when the theoretical <strong>rock</strong> volumerequired to install the support, the installation losses during operations and the immediate displacements of theseabed are considered.between subsoil and <strong>rock</strong> fill occur, the<strong>rock</strong> will penetrate further into the subsoiluntil a new equilibrium is obtained.This mechanism is graphically shown inFigure 9. <strong>The</strong> additional penetration D canbe estimated by using a reological model.<strong>The</strong> pressure loss over zone D can beestimated by using the following formula:pwhere:= S u* !(n / k) * a * Dp = pressure [Pa]S u= remoulded undrained shearstrength [Pa]n = porosity [-]k = intrinsic permeability [m 2 ] the bestestimate for D 15= 0.04 m andn= 0.4 is k = 2*10 -6 m 2a = constant in the range 0.6 to 0.9 witha best estimate of 0.75 [-]D = additional penetration [m]Based on the above method a graphicalrepresentation of the results of the calculationsfor different undrained shearstrengths and support heights is given inFigure 10. <strong>The</strong> results show that thematerial flow into the <strong>rock</strong> skeleton israther limited. Only when installing highersupports on very soft clays can an effectcaused by material flow into the <strong>rock</strong>skeleton be expected. Since the <strong>rock</strong>particles squeeze the clay during theinstallation process, it is realistic to considerthe remoulded undrained shear strength.Immediate deformations subsoilOwing to the weight of the supportstructure immediate deformations can beexpected in sand as well as in clay. <strong>The</strong>occurrence of immediate deformationsdepends on several aspects.Compressibility subsoil<strong>The</strong> compressibility of sand is normally small.<strong>The</strong> settlement is calculated consideringdrained characteristics of the material.Although only small displacements occur insand, they still contribute to the immediatesettlements to be accounted for.<strong>The</strong> immediate deformations of clay can becalculated using the effective strengthcharacteristics (j’, c’) and deformationparameters (oedometer modulus M) whileallowing for the development of excesspore pressures simulating undrainedbehaviour. In this way the immediatedeformation for every support can becalculated.Layer thickness<strong>The</strong> thickness of especially clay layersgoverns the magnitude of the immediatedeformation. <strong>The</strong> greater the thickness ofthe layer, the larger the settlement.Owing to the fact that clay layersintermediate with sand layers, someconsolidation settlement during the <strong>rock</strong>installation should be taken into account.Geometry support structure<strong>The</strong> geometry of the support structuredetermines the loading on the seabed.Table I. Penetration S initin seabedA higher support results in a higher loading,thus causing larger deformations in thesubsoil. An increase in length and/or awidth of the structure will further result inan increase of the stress at deeper levels inthe subsoil, thus resulting in a higher levelof immediate deformations.Calculation methodA 2-dimensional finite element analysisshould be used since vertical displacementsare introduced by horizontal deformations.This is caused by the fact that, in principle,no volumetric change occurs during undrainedloading conditions in clay. Thisprinciple is graphically represented inFigure 11 which shows a deformationpattern obtained with the finite elementsoftware Plaxis. Immediate deformations asa function of the support height and claylayer thickness are presented in Figure 12.<strong>The</strong> immediate deformations in sand with adeformation modulus of 10 MPa are in therange of 0 to 2 cm for supports of maximum5 m height on sand layers of 3 m thick.CONCLUSIONSImmediate displacements during subsea<strong>rock</strong> installation can be accurately assessedas long as sufficient and reliable soilinformation is available.<strong>The</strong> immediate displacement can be dividedinto four phenomena:1 surface erosion,2 penetration of <strong>rock</strong> particles into theseabed,3 material flow into the <strong>rock</strong> skeleton and4 immediate deformation of the subsoil.<strong>The</strong> surface erosion varies generally between0 and 15 cm for hard clay or densesand to very soft clay or loose sand,respectively. <strong>The</strong> initial penetration of <strong>rock</strong>particles into the seabed and the materialflow into the <strong>rock</strong> skeleton mainly dependsremoulded undrained shear strength S uin kN/m 2 .sandS u= 1 S u= 5.0 S u= 15 LooseS initin cm 21 6 3 9
8 Terra et Aqua | Number 110 | March 2008on the support height and the remouldedundrained shear strength of clay or theinternal friction angle of sand. This resultsin a penetration of 0 to 20 cm in practice.Figure 9.Rock penetration.Figure 10.Material flow Das a function ofremoulded undrainedshear strength S uandsupport height.Material flow D (cm)S u, remoulded (kPa)0 2.5 5 7.5 10 12.5 15012Support height = 3mSupport height = 6m34<strong>The</strong> immediate deformation of the seabedowing to the static weight of the supportsis calculated by means of a finite elementprogramme. For sand the deformationmodulus in combination with effective soilparameters is used. For clay the oedometermodulus M and effective strengthparameters in combination with undrainedbehaviour (allowing for the development ofexcess pore pressures) is adopted. Inpractice the immediate deformation rangesfrom 0 to 25 cm depending on the supportheight and the consistency of the subsoil.<strong>The</strong> following recommendations should beconsidered when assessing the immediatedisplacements:- <strong>The</strong> information on the strength andconsistency of the first 0.5 m thick toplayer is considered not to be reliable ifonly CPTs results are available.- A remoulding effect of 50% isconsidered in the analysis regarding thepenetration of the individual particles andthe material flow into the <strong>rock</strong> skeleton.In sensitive clays a higher reduction instrength may be expected.Figure 11.<strong>The</strong> effects caused by long-term settlementcan be addressed by installing <strong>rock</strong> supportsin two phases with a 3 to 6 monthssettlement period in between.Deformation pattern infinite element software.Figure 12. Immediatedeformations in clayfor deformationmodulus M = 2MPa.Each line represents adifferentImmediate settlement [cm]Thickness clay layer [m]0 5 10 15 20 25 30010S=5m20S=4mS=3mS=2mS=1m30As a result of evaluating several projectsthe conclusion can be made that thedifference between the estimated volumeof <strong>rock</strong>, including immediate displacement,and the actual installed volume is only 2to 3%. This shows that the effects ofimmediate displacements can be calculatedaccurately by using the methods describedhere, provided that the knowledge of thesubsoil characteristics is sufficient.REFERENCESBrich-Hansen, “A revised and extended formulafor bearing capacity”. Bulletin 28, <strong>The</strong> DanishGeotechnical Institute, 1970.support height S.
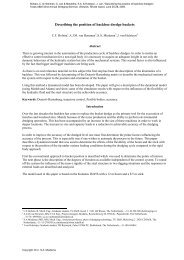
New Possibilities for Ripper <strong>Dredging</strong> of Rock 9BERNARD MALHERBE AND PETER DE POOTERNEW POSSIBILITIES FOR RIPPERDREDGING OF ROCKABSTRACTPart of the Melut Basin Development Projectat the Bashayer II Oil Export Terminal at PortSudan – one of Sudan’s most importantongoing economic development projects –was the dredging of a shore-approachtrench trough in the coral-rich seabed at theRed Sea coast, for twin 36” oil exportpipelines and 14” effluent pipeline.<strong>The</strong> project was undertaken for the PetrodarOperating Company (JV CNPC, PCOSB/Petronas, SUDAPET, AL-THANI) and thegeneral EPC contractor was Peremba,INTEC, Sudan Pile Consortium (PISP).<strong>The</strong> total length of 36” pipeline was twice2,850 m and the length of 14” effluentpipeline was 1200 m. <strong>The</strong> trenching was CD– 0.5 m (at shore) to CD -49 m (at KP 0.980m) of soil consisting of coral <strong>rock</strong> and coraldebris with UCS between 2 and 12 MPa.After unsuccessful trials by the EPCContractor to open the trench in the steepslope of the coral reef with explosives, thedecision was made to use trenchingequipment. To achieve this, the backhoedredger Jerommeke with <strong>rock</strong> bucket andthe trailing suction hopper dredger Vascoda Gama with a new generation of ripperdragheadwere brought into service.INTRODUCTION<strong>The</strong> joint company PETRODAR (PDOC)– a Joint Venture between China NationalPetroleum Company (CNPC), PETRONAS,SUDAPET and Al-Thani Corp. – awardeda general EPC (<strong>Engineering</strong>-Procurement-Construction) contract to PISP – a J.V. ofPEREMBA SDN BMD (My) INTEC (US) andSudan Pile (SU) – for the construction of theBashayer II Oil Export Terminal at Port Sudanon the Red Sea Coast in Sudan (Figure 1).<strong>The</strong> Bashayer II OET is located approximately40 km south of Port Sudan and is theterminal for the oil pipelines coming fromthe onshore Melut Basin Oil Field insouthern Sudan. Both offshore pipelineswith a total length of 2,850 m are connectedto an offshore PLEM and SPM buoy fortanker loading; PLEM and SPM are anchoredin water depths in excess of CD –50 m.Very little soil information was availableabout the shore-approach seabed, andwhat scarce information there was showedAbove, In order to ascertain the vessel’s nautical safetyabove the coral reef, the TSHD Vasco da Gama’sdraught was kept below 8.6 m by rainbowing thedredged materials sidewards from the bow instead ofloading inside the hopper.the existence of a double-bump profile (seeFigure 3). <strong>The</strong> first bump nearshore wasdocumented by 3 boreholes as consistingof silty sand and clays at the very end of acoral reef. <strong>The</strong> drilling/corings at secondbump further offshore at KP 0.650 to0.950 indicated clay, soft clay, sand andcoral debris [Ref 2].<strong>The</strong> overall environment of the Red Seacoastline indicates a general presence offringe-coral reefs. Jan De Nul thereforementioned the likelihood of hidden coralreefs on both bump areas and a dedicatedsoil investigation was found necessary.According to the Operator and EPCContractor [Ref 1], the coral-reefs, if any,were supposedly highly weathered andmainly loose. <strong>The</strong> EPC Contractor hadalready attempted to open the trench usingexplosives or a small cutter suction dredgers;both attempts were unsuccessful.Because the project already suffered significantdelays for various reasons, the Operatorand the EPC Contractor decided to charterheavy-duty dredgers to open the pipelinetrenchand to execute additional soilinvestigations just before the start of theworks. <strong>The</strong>re was no time left for additionalgeotechnical engineering and therefore, the
10 Terra et Aqua | Number 110 | March 2008with respect to the adjacent seabed was4 m. <strong>The</strong> natural seabed consisted of hardcoral with an Unconfined CompressiveStrength (UCS) between 2 and 4 MPa, coraldebris and silty sand.Figure 1. Location of Port Sudan situated onthe Red Sea.consortium PISP, represented by PEREMBASDN BHD, decided to charter the 1.063 kWBackhoe Dredger (BHD) Jerommeke and the37.060 kW Trailing Suction Hopper Dredger(TSHD) Vasco da Gama of Jan De Nul<strong>Dredging</strong> Ltd.Because of the uncertainties about the exactsoil conditions and characteristics beforearrival of the vessel on site, Jan De Nul<strong>Dredging</strong> Ltd. strongly advised the EPCContractor to adapt the design and dredgethe deeper trench in the steep slope with acut-&-fill profile instead with one ofJan De Nul Group’s powerful seagoing <strong>rock</strong>cutter dredgers. However, the project teamdid not allow for any modifications in thedesign and the EPC Contractor, in the end,decided to attempt to dredge the trenchwith the Vasco da Gama.<strong>The</strong>refore Jan De Nul had to make a numberof technical assumptions upon whichthe design of the <strong>rock</strong>-rippering dragheadwas to be based in order to maximise thechances of success. Assumptions weremade about the strength of the coral, itshomogeneity, the dynamic reaction forces,the wear and tear, the productivity, toFigure 2. Coral blocks with size up to 2 mexcavated by the backhoe dredger.name a few. Furthermore the databases ofprevious works carried out in coral-dredgingworks were considered and severalsimulations were done.Even with all the uncertainties mentionedabove, the EPC Contractor declared that theexecution of this work could not bear anyfurther delays, that there was no time leftto wait for results of the soil investigations(which were also delayed). <strong>The</strong> order wasgiven to mobilise both dredgers andattempt to open the pipeline-trench by anyand all means.TRENCH DREDGING IN CORAL REEF 1WITH A BACKHOE DREDGER<strong>The</strong> BHD Jerommeke was transported fromDubai to Port Sudan on board the submersiblebarge DN 116, together with itsassistance tug, a KRUPP 4000 hydraulicbreakhammer, spare <strong>rock</strong>-buckets, andsufficient spare parts.<strong>The</strong> trench bottom width was 12 m withside slope designed at 1 vertical and3 horizontal. <strong>The</strong> average trench depth<strong>The</strong> trench-dredging of the Coral Reef 1,between KP 0.048 (at the shore) and KP0.480 (water depth CD –18 m) wassuccessfully executed with the 740 kWBHD Jerommeke. <strong>The</strong> dredged material wasdeposited to each side of the trench.<strong>The</strong> work was executed between Augustand October 2006.During dredging, coral blocks of up to 2 mdiameter were excavated (Figure 2). <strong>The</strong>trench was surveyed at regular intervalsduring execution in order to monitor theprogress. <strong>The</strong>se surveys indicated that thebackhoe dredger achieved a constant andhigh productivity.TRENCH DREDGING IN CORAL REEF 2WITH A TRAILING SUCTION HOPPERDREDGER<strong>The</strong> Coral Reef 2 was located betweenKP 0.610 (CD –19 m) and KP 0.980(CD –49 m). <strong>The</strong> seabed consisted of a hardcoral formation with coral blocks of morethan 2 m in diameter and with UCS valuesbetween 8 and 12 MPa. <strong>The</strong> designedtrench had a bottom width of 12 m, sideslopes of 1 vertical and 3 horizontal and atrench depth (BOT) between 1 m and 17 mbelow original seabed as shown on thelongitudinal profile in Figure 3. <strong>The</strong> targetBOT depths of max CD –49 m excluded theuse of a <strong>rock</strong> cutter suction dredger; theEPC Contractor therefore decided to havethe trench dredged by a large trailing suctionhopper dredger and, in that respect,selected the world’s most powerful trailer.Figure 3. Longitudinal profile of the shore-approach trench (brown sections indicate the dredged section).
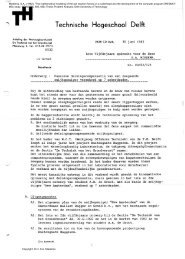
New Possibilities for Ripper <strong>Dredging</strong> of Rock 11BERNARD MALHERBEgraduated in 1976 with a MSc inGeology at the University of Leuven(Belgium). In 1980 he completed hisstudies as a Master of <strong>Engineering</strong>Science in Geological <strong>Engineering</strong> atthe École Nationale Supérieure deGéologie (France). He worked in thedredging industry for more than20 years – for a contractor jointventure and as an engineeringconsultant – before joining theJan De Nul Group in 2004. Since thenhe has been employed as AreaManager on many offshore projects.Presently he is <strong>Engineering</strong> Managerfor project development.Figure 4. Artist’srendering of theVasco Da Gamawhich has amaximum dredgingdepth of 135 m.PETER DE POOTERgraduated in 1990 with a MSc in Civil<strong>Engineering</strong> at the University of Ghent(Belgium). He worked in theengineering and construction industryfor more than 10 years before joiningthe Jan De Nul Group in 2003. Sincethen he has been employed as<strong>Engineering</strong> Manager on the offshoreproject Sakhalin II in Sakhalin (Russia)and as Project Manager on severaloffshore projects. Presently he isworking as Project Manager of theManifa Field Causeway and IslandConstruction Project in Saudi Arabia.Consequently, the Vasco da Gama wasselected and fitted with a specially modifieddraghead equipped with an adaptablenumber of ripper-teeth (Figure 4).During this work, this heavy and solid <strong>rock</strong>ripperingdraghead would prove its uniqueefficiency and flexibility. <strong>The</strong> extreme installedpropulsion power of the Vasco da Gama(29,400 kW of a total installed 37,000 kW)ascertained a continuous and efficientoperation and production, despite the factthat each dredging track commencedinshore with a ground-speed of 0 knots,because the ship is in fact going backwards.Moreover, the vessel was equippedwith an onboard multibeam echo-sounderin its central moon-pool for continuousonline monitoring the dredged profile byFigure 5. Ripper draghead with 1 m long ripper teeth.Figure 6. Drawing of draghead with ripper teeth on seabed.the client and project team on boardwithout having to wait for survey results.<strong>The</strong> ultimate generation of <strong>rock</strong>-ripperingdragheads, developed by Jan De Nul forthe Vasco da Gama weighs 60 tonnes, is8 m wide and is fitted with 7 ripping-teeth(1 metre long) on the draghead’s heel and20 pick points on the draghead’s visor(Figures 5 and 6). For security reasons incase of excessive ripping forces, a securityflangesystem with breaking bolts wasinstalled at the draghead/suction-tubeflange.By the time the ship arrived on site inSeptember 2006, new geotechnicalinvestigations had been done and the coresindicated heterogeneous coral reef <strong>rock</strong>sover the full thickness of the reef:Unconfined Compressive Strength (UCS)values of up to 12 MPa of the coral <strong>rock</strong>
12 Terra et Aqua | Number 110 | March 2008were found. <strong>The</strong>se values are extreme andnever before in the history of trailingsuction hopper dredging have such hard<strong>rock</strong>s been dredged; despite this, the EPCContractor decided to proceed with theplanned work-execution with theVasco da Gama.In order to ascertain the vessel’s nauticalsafety above the coral reef, the dredger’sdraught was kept below 8.6 m by rainbowingthe dredged materials sidewardsfrom the bow instead of loading inside thehopper. Trenching started at the end ofSeptember 2006 and was completed bymid November 2006. <strong>The</strong> trenchingoperation was executed by having thevessel navigated with stern towards shore,lowering the suction tube and trailing tothe offshore end whilst dredging andripping. At the end of each dredging track,the suction tube was hoisted and a newdredging cycle was executed. <strong>Dredging</strong>/ripping productivities ranged from 2,000to 4,000 m³/day and a total of 140,000 m³of soil was excavated and moved to achievea cut-&-fill profile as shown on thelongitudinal profile; approximately 75% ofthe excavated soil was dredged and sidecasted.<strong>The</strong> other 25% were bull-dozeddownhill the slope of the Reef 2.This material consisted of coral blocksfragmented by the ripper teeth (Figure 7)and trailed toward the end of the slope.It showed to be stable <strong>rock</strong>fill for thepipeline foundation. <strong>The</strong> bearing capacitywas tested by load test with the dragheadcompensation system. Ultimately, the EPCContractor accepted the cut-&-fill trenchprofile executed based on the bearingcapacity assessment, the free-span analysisand the pipeline stress-strain analysis.Figure 7. Coral blocks removed from the ripper draghead.surveys (Figure 8). This allowed both thedredging operators and the Client’srepresentative to monitor the trenchingoperation.CONCLUSIONSToo often insufficient attention is paid togeotechnics in engineering dredging works.In the Melut Basin Bashayer II project thiswas clearly the case. Despite this, the controlleddredging of an acceptable seabedprofile in water depths up to 50 m and inhard coral <strong>rock</strong> was successfully completed.<strong>The</strong> Vasco da Gama, equipped with aspecial modified ripper-teeth draghead hasproven to be able to meet this challengeand pushed the limits of trailing suctiondredger ever further. Coral <strong>rock</strong> in massivereef and blockformations with UCS valuesbetween 8 and 12 MPa was excavatedsuccessfully, thanks to a combination ofthe vessel’s extremely high-installed powerand this new generation of ripping draghead.<strong>The</strong> work was executed in over lessthan half the time originally estimated forthe Client.REFERENCES1. PISP report. “Sudan Melut Basin Oil TerminalDevelopment Project -EPC- Trenching and<strong>Dredging</strong> Specifications”(ref MTF-PLN-SPN-0019 Rev A 24 Nov 2004).2. FUGRO report for PISP. “GeotechnicalInvestigations for the Melut Basin OilDevelopment Project”(MTF-PLN-SP-0003, dd 4/03/2005).MONITORING OF TRENCH PROFILEAND FREE-SPAN ANALYSISDuring the whole trenching operation, thetrench and stockpile areas were monitoreddaily with multibeam echo-soundingFigure 8. 3D view of the trench made through the coralreef survey result (Left: in-survey; Right: out-survey).
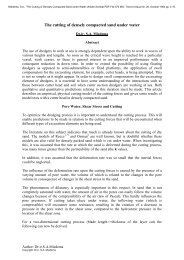
<strong>The</strong> Hansje Brinker Safety Award 13THE HANSJE BRINKER SAFETY AWARDEach and every one of the InternationalAssociation of <strong>Dredging</strong> Companies (IADC)member companies has made on-the-jobsafety a top priority. At Van Oord thisattention to safety is recognised in theannual Hansje Brinker Safety Award, anin-house safety award for projects andyards of the worldwide-operatingVan Oord group. Mythically renown as theyoung boy who put his finger in a hole inthe dike and saved Holland from beingflooded, Hans Brinker has become VanOord’s symbol for safety, health and theenvironment. Accordingly, each year theHansje Brinker Award is presented tohonour excellence in the implementationof the Van Oord Management Systemduring the execution of the works onprojects, vessels and yards with respectto safety (main criteria), health andenvironmental issues.<strong>The</strong> QHSE (quality, health, safety and theenvironment) policy at Van Oord has beencodified in very elaborate and detailedinspection lists to determine the awardwinner. For each category - vessels,projects and yards - a specific list has beencollated that includes questions concerningthe availability of the Management Systemand Safety Awareness as well specificsrelating to the site office, workshop andcrane, the yard office, the vessel’s bridgeand engine room, to name just a fewcategories.<strong>The</strong>se lists clearly define the spearheadsand the safety levels to be achieved, andthey are based on several national andinternational standards, such as:• ISO-9001 - International Organisationfor Standardisation: a quality standardregarding customer satisfaction, processmanagement and experience.• VCA - A Dutch safety system forcontractors focused on safety aboardships and on project sites, accidentprevention and protection of theenvironment.• ISM Code - International SafetyManagement Code: the internationalstandard for ships’ management aimedat safeguarding safety at sea and preventdamage to property or the environment.• ISPS Code - International Ship & PortFacility Security Code: a code to identifyand eliminate safety risks on board andin ports.Above: Cutter suction dredger Calabar River at work inTinapa, Nigeria, where a world-class multipurpose resortis being developed.• ISO-14001 - Environmental Standard:a guideline applicable in certain countriesthat have prioritised environmentalmatters and encourage possibilities toimprove the environment.• OHSAS-18001 - Occupational Healthand Safety Assessment Series guideline:a guideline that safeguards the safety ofpersonnel and visitors on a project siteand at the same time focuses on possibleimprovements.• Van Oord is also certified for ISO-9001,VCA, ISM and ISPS, and several of localbranch offices also hold ISO-14001 andOHSAS-18001 certificates.THE AWARD WINNERWork safety is thus completely integrated inthe execution of all Van Oord projects andthe safety policy is firmly embedded in themanagement system. Reducing the numberof accidents and incidents as much aspossible and reducing the risks for bothpeople and the environment alike is theobjective. Managers and crew have animportant role to play in the field of safety,as it is their job to motivate their people towork safely and monitor the implementationof the company safety policies.
14 Terra et Aqua | Number 110 | March 2008Progress in the execution of safety policiesis monitored on a quarterly basis. Becauseof the large amount of work, a safetyofficer is appointed on every sizeableproject. This inspector safeguards a highsafety level. In the past few years, whileturnover has been growing, the numberof accidents has been declining.All Van Oord ships over 500 GT arecertified according to the ISM Code incompliance with international legislation.This means that these ships meet theinternational standards for ship managementsafeguarding safety at sea andpreventing damage to property and theenvironment.<strong>The</strong>se vessels are frequently inspected byVan Oord auditors as well as auditors froman external agency. Given this closeattention to safety standards, choosing oneproject over another for an award takescareful consideration.In 2006, acknowledging the maximumeffort put into safety and security measureswhile working in an extraordinarily challengingenvironment, Van Oord Nigeria Ltdwas presented with the Hansje BrinkerAward for its overall achievements(Figures 1 and 2).<strong>The</strong> award recognised three Nigerian projectsites, a well-equipped maintenanceyard in Port Harcourt and the branch officein Lagos. One of the projects was thedredging for the creation of an artificiallake, “Lake Tinapa”, which is part of aworld-class integrated business resortcomplex being constructed on the banks ofthe Calabar River. Tinapa is located northof Calabar, eastern Nigeria’s main port.Some 885,000 m 3 soil has been removedwith a cutter suction dredger and the soilhas been efficiently reused to create newland for future leisure development.A second project is at Calabar, easternNigeria’s main port, which is situated83 km up the Calabar River in the NigerDelta. Nestled in the far southeast ofNigeria, Cross River State is Nigeria’sfrontier to Cameroon, Sao Tome, EquatorialGuinea and beyond. <strong>The</strong> seaport, namedFigure 1. At the awards presentation, Safety OfficerJ. Ogbo accepts the Hansje Brinker Award fromKoos van der Geer on behalf of Van Oord Nigeria, Ltd.Calabar New Port, has an array of modernfacilities for the export and import trade.Between 1976 and 1995 Van Oord carriedout several projects in the vicinity, includingrecently the maintenance of the CalabarChannel for National Ports Authority.<strong>The</strong> award-winning project involved theupstream dredging of the access channelto Calabar New Port being done by twotrailing suction hopper dredgers, which aredeepening the channel from -7 m to -10 mover a width of 150 m and a length of46 km. This will allow vessels with a lengthof 170 m and a deadweight of between10,000 and 15,000 tonnes to safely reachthe port. <strong>The</strong> estimated volume of sedimentto be dredged is 12,750,000 m 3 . <strong>The</strong>dredged material is placed in allocateddisposal areas.All these projects have been supportedby the yard at Port Harcourt. Generallyspeaking, Nigeria is not an easy countryto work and so winning this award wasa significant accomplishment.<strong>The</strong> standards of health and safety managementdemanded in Nigeria were nodifferent than those required by otherVan Oord projects. In fact, the difficultcircumstances created an optimumawareness by all employees both nationaland expatriate staff. Oil and gas standardsalso enhanced a high level of safety andsecurity morale.Amongst the safety measures consideredwere the Toolbox meetings which occuralmost daily somewhere in Nigeria. ToolboxFigure 2. A Toolbox meeting in progress: <strong>The</strong>y are anessential aspect of the stringent safety measures andoccur almost daily somewhere in Nigeria.meetings are brief meetings at which(near-) accidents, HSE (health, safety,environment) news and special subjects, arediscussed in relation to relevant activities(vessel-specific, project-specific or yardspecific).Safety walks, audits and implementationof consequential measures are aday-to-day activity. Van Oord Nigeria Ltd.also regularly undergoes external audits.<strong>The</strong> Van Oord Community Relations Plansafeguards a good relationship with theindigenous host communities at worksitesand offices throughout the country.In addition, a major focus is on medicalcare. <strong>The</strong> high safety standard withinVan Oord Nigeria features the presence ofan ambulance, a doctor and clinic fromSOS International at all project offices.<strong>The</strong> healthcare standards and Medivacarrangements are optimised through anSOS International contract wherebyhelicopter service can be rendered ondemand and present at site within aminimum time frame. <strong>The</strong> SOS clinic in PortHarcourt renders service for the expatriatestaff, while two audited retainer hospitalsprovide care for the Nigerian staff.In a brief overview: Van Oord Nigeria had459,000 work-hours, with 310 toolboxmeetings, 23 safety inspections and/oraudits, 5 safety checks by independentorganisations and only 1 accident thatresulted in absence. <strong>The</strong> LIFR, number ofLost Time Injuries per 1,000,000 workhours, was a minimal 2.18. All in all thesenumbers testify to the heightened safetyawareness at Van Oord Nigeria.
<strong>The</strong> Day After We Stop <strong>Dredging</strong>: A World Without Sediment Plumes? 15STEFAN G.J. AARNINKHOFTHE DAY AFTER WE STOP DREDGING:A WORLD WITHOUT SEDIMENT PLUMES?ABSTRACT<strong>Dredging</strong> activities are a pre-requisite forthe development of human welfare, coastalsafety and economic profit, yet thedredging industry is often criticised forhaving an adverse environmental impact,particularly through generation of sedimentplumes during project implementation.Would the day after we stop dredgingmark the onset of a world withoutsediment plumes? To answer this questiona wider range of natural and humaninduceddrivers of sediment plumes in deltaareas should be considered. Wouldshipping activities cease the day after westop dredging? Would natural rivers stopdischarging large quantities of finesediment during periods of high waterrun-off? To assess the environmentalbenefits of an “idyllic” world withoutdredging, the impact of maintenancedredging activities as compared to theimpact of other, ongoing drivers ofsediment plumes must be evaluated.<strong>The</strong> research presented here reflects recentprogress in the framework of the TASS(Turbidity Assessment Software) programme,which involves a series of largescalefield trials to collect high-quality datathat can be used for model validationpurposes. Recent field trials in Bremerhaven(2006) and Rotterdam (2007) resulted invaluable insight in optimal means to collectoverflow samples for the quantification ofoverflow losses over a range of soil types,overflow configurations and environmentalconditions.Moreover, the Rotterdam (2007) field trialis expected to help to assess the relevanceof draghead plumes and propeller wash inview of dredging-induced turbidity, as wellas the benefits of using a green valve. Bothdata sets will be used for TASS modelvalidation and the identification of futuremodel developments and research needs.Although the TASS programme focusses ondredging-induced turbidity increases, itshould be noted that dredging is just oneout of a series of processes that drivesediment plumes. <strong>The</strong>se processes includenatural events, shipping operations andfishing activities. An inventory of theseprocesses suggests, at least qualitatively,Above: <strong>Dredging</strong> operations often generate no moreincreased suspended sediments than are naturallypresent. Above a clear boundary forms where a riverwith high-levels of suspended sediments meets anocean environment with low-level suspended sediments.that the annual impact of these processesis of the same order of magnitude asdredging. <strong>The</strong> author wishes to acknowledgethe important contributions to thisresearch by W.F. Rosenbrand ofRoyal Boskalis Westminster nv, <strong>Dredging</strong>Development Department, C. van Rhee ofVan Oord <strong>Dredging</strong> and Marine ContractorsBV and T.N. Burt, recently retired fromHR Wallingford Ltd., UK as well as thefunding by Stichting SpeurwerkBaggertechniek (SSB) and Fonds CollectiefOnderzoek as part of crow. <strong>The</strong> paperwas originally presented at the CEDA<strong>Dredging</strong> Days in November 2007 and waspublished in the conference proceedings.It is reprinted with permission in a slightlyrevised and updated version.INTRODUCTION<strong>Dredging</strong> activities are a pre-requisite forthe development of human welfare, coastalsafety and economic profit. Nevertheless,the dredging industry is often criticised– and not seldom without any scientificjustification – for having an adverseenvironmental impact, particularly throughgeneration of sediment plumes duringproject implementation. Would the day
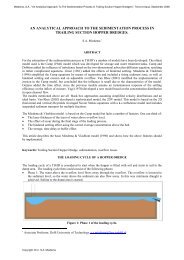
16 Terra et Aqua | Number 110 | March 2008NATURAL AND HUMAN-INDUCEDDRIVERS OF SEDIMENT PLUMESFigure 1. Examples of natural sediment plumes: An annually recurring sediment plume in Lake Michigan (left) andthe Mississippi River sediment plume (right). <strong>The</strong> first is driven by sediment resuspension off the bottom duringstorm events; seasonal and inter-annual fluctuations of the second correspond closely with large fluctuations inriver discharge.after we stop dredging mark the onset ofa world without sediment plumes?To answer this question a wider range ofnatural and human-induced drivers ofsediment plumes in delta areas must beconsidered. Would shipping activities ceasethe day after we stop dredging? Certainlynot. In fact, propeller wash impacts duringship-manoeuvring operations are likely toincrease since vessels will face channels andbasins of decreased water depth.Also, would natural rivers stop discharginglarge quantities of fine sediment duringperiods of high water run-off? Again theanswer is no. To assess the environmentalbenefits of an ‘idyllic’ world withoutdredging, evaluation of the impact ofmaintenance dredging activities ascompared to the impact of other, ongoingdrivers of sediment plumes is necessary.<strong>The</strong> research here addresses the impact ofdredging-induced sediment plumes in abroader context of natural and humaninducedturbidity variations, which governsuspended sediment background levels.For the time being, this assessment is donemostly qualitatitvely, on the basis of a seriesof key examples of natural and humaninducedsediment plumes. However, insearch of further quantification of theseimpact assessments, the dredging industryis funding and promoting a research programmecalled TASS (Turbidity AssessmentSoftware). This programme aims at thedevelopment and validation of a model topredict suspended sediment concentrationas a result of dredging operations (overflow,LMOB – “light mixture overboard”) aswell as other dredger-related sources (suchas propeller wash). A key component of theprogramme is a series of large-scale fieldexperiments to obtain quantitative insightin these processes and collect high-qualityground-truth data.This research presented here representsrecent work performed in the framework ofthe TASS programme, involving, amongstother things, two large-scale field trials inBremerhaven (2006) and Rotterdam (2007).Prior to that, an overview is given of highturbidityevents not related to dredging.In the summary section, the question ofwhether the day after we stop dredgingwill mark the onset of a world withoutsediment plumes is addressed qualitatively.Figure 2. Landsat 7image of shrimp trawlerfleet in the northernGulf of Mexico, USA.<strong>The</strong> entire scene here istinted a brown huefrom mud resuspendedby trawlers. Scale bar is1 kilometre. Courtesy ofthe Global Land CoverFacility (2007).Sediment plumes are often perceived as aphenomenon with adverse environmentalimpact. Water quality can be affected,for instance, through an increase of thebiological oxygen demand of the watercolumn or the release of previouslybound-up contaminants. Shading andsmothering may affect marine ecology,both in the water column and on the seabed. Moreover, shell-fisheries can beimpacted by sediment plumes as a result ofeffects on their filter-feeding efficiency.Thorough insight in the generation andevolution of sediment plumes is a prerequisitefor longer-term, sustainabledevelopment of aquatic environments.Although sediment plumes do certainlyoccur in the direct neighbourhood ofdredging operations, it is important torealise that dredging activities are not theonly driver of sediment plumes in deltaareas. Natural processes (such as river peakdischarges and resuspension of finesediments during storms) as well as otherhuman-induced activities (such as fishingand ship-manoeuvring operations) areassociated with sediment plumes as well.In fact, because of the worldwide scale andintensity of the latter processes andactivities, their combined impact may be anorder of magnitude larger than turbidityrates induced by dredging.Natural processesNatural sediment plumes are a commonlyobserved feature along many shorelines
<strong>The</strong> Day After We Stop <strong>Dredging</strong>: A World Without Sediment Plumes? 17IADC Secretary General Constantijn Dolmanscongratulates Stefan Aarninkhof (right) onwinning the IADC Award for younger authors.IADC AWARD 2007PRESENT AT CEDA DREDGING DAYS,NOVEMBER 7-9, 2007An IADC Best Paper Award was presented toStefan Aarninkhof, who is a senior projectengineer at Hydronamic, the engineeringgroup of Royal Boskalis Westminster. In 2003he received a PhD from Delft University ofTechnology, the Netherlands, for a thesis onthe quantification of coastal bathymetry fromvideo imagery. Prior to joining Boskalis in2006, he spent 10 years at Delft Hydraulics.He currently fulfills a specialist role in the fieldof morphology and marine environment, witha focus on the environmental aspects ofdredging.worldwide. Figure 1 shows examples ofthese, involving a massive recurring plumealong the south shores of Lake Michiganand the Mississippi River sediment plumeon the US south coast, in the northern Gulfof Mexico. <strong>The</strong> Lake Michigan plume wasextensively studied as part of the “EEGLE”,the Episodic Events Great Lakes Experiment,funded by the US National Oceanic andAtmospheric Administration NOAA inconjunction with the National ScienceFoundation (NSF). <strong>The</strong> great plume of siltappears each year after winter and was firstcaptured from satellite imagery in 1996,extending approximately 10 miles offshoreand 200 miles along the southern coastlineof Lake Michigan, from Wisconsin, pastChicago, and back into Michigan. It typicallylasts less than a month. Investigations ofmultiple plumes by Vanderploeg et al.(2007) reveal total suspended matterconcentrations in the core of plumes in theorder of 15-30 mg/l. <strong>The</strong> plume is driven bystorm events and most sediment in theplume is re-suspended off the bottom. <strong>The</strong>latter is associated with a redistribution ofcontaminants such as PCBs. Moreover, thesediment resuspension events were foundto alter the short-term nutrient and lightclimate of the nearshore waters (photicdepths reduced to 1-2 m, Vanderploeg etal., 2007), temporarily reducing phytoplanktonreproduction and photosynthesisinside the plume.Variability of the Mississippi river plume wasstudied by the Louisiana Universities MarineConsortium (LUMCON) and reported inWalker (1996). Investigation of five years ofsatellite imagery (112 images) showed thatthe sediment plume ranged in size from450 km 2 under low discharge conditions to7699 km 2 under high discharge conditions.Suspended sediment concentrations of10-30 mg/l were used to define the plumeextent. On seasonal and inter-annual timescales, variations in plume area were mainlydriven by fluctuations in river discharge;however, day-to-day variability in plumesize was more closely associated withchanges in the wind field.FishingMarine fisheries catch more than 120 millioncubic metric tonnes of sea life each year(Pauly et al., 2002). Among the variousmethods to catch fish, trawling anddredging are considered particularlyunsustainable (Van Houtan and Pauly,2007b). <strong>The</strong>se fishing gears adversely affectEach year at selected conferences, theInternational Association of <strong>Dredging</strong>Companies grants awards for the best paperswritten by younger authors. In each case theConference Paper Committee is asked torecommend a prizewinner whose papermakes a significant contribution to theliterature on dredging and related fields.<strong>The</strong> purpose of the IADC Award is “tostimulate the promotion of new ideas andencourage younger men and women in thedredging industry”. <strong>The</strong> winner of an IADCAward receives €1000 and a certificate ofrecognition and the paper may then bepublished in Terra et Aqua.Figure 3. Aerial photograph of Port Elizabeth, New Jersey. <strong>The</strong> picture reveals prominent sediment plumes behinda container ship entering the Elizabeth channel (upper right) and the container ship approaching along the easternberthing area (right). Hardly any sediment plume is visible near the dredger also operating in the channel.Image courtesy of the Port Authority of New York and New Jersey, taken from Clarke et al. (2007a).
18 Terra et Aqua | Number 110 | March 2008non-targeted benthic animals and thestructures they build (such as reefs), thuscreating flat, muddy areas with littlebiodiversity. In addition to the directimpact, fisheries also re-suspend mud intothe water column which yields sedimentplumes in the wake of fishing vessels.Van Houtan and Pauly (2007b) assess theoccurrence and dimensions of mudtrails leftin the wake of fishing vessels from highresolution satellite images sampled acrossthe planet. Images were taken from GoogleEarth (2007).Sites investigated include Louisiana (USA) inthe Northern Gulf of Mexico, Perhak(Malaysia) in the East Indian Ocean, Sonora(Mexico) in the Gulf of California, Luzon(Phillippines) in Manila Bay and Jiangsu(China) near the mouth of the YangtseRiver. Trailer mudtrails are frequently foundin shallow waters, typically appearingseveral hundreds of metres wide andseveral kilometres in length. Figure 2 istaken from their work, showing the impactof fishing activities on the marine ecosystemalong the Gulf of Mexico coastlineof Louisiana (USA). <strong>The</strong> discovery of theseimages has revealed new insights the scaleof sediment plumes induced by fisheries.Shipping operationsShipping operations are often associatedwith the generation of sediment plumes,particularly with decreasing water depths inharbour areas. Measurements byPennekamp et al. (1991) in the Port ofRotterdam revealed a strong turbidityincrease caused by the sailing and mooringof vessels (propeller impact of tugboats andreturn flows between bottom of vessel andsea bed in shallow water). Turbidityincreases up to 500 mg/l (backgroundconcentration 20 mg/l) were measured atdistances of about 50 to 200 m from alarge bulk carrier during mooring at a quaywith assistance of four tugs. An order ofmagnitude analysis by Pennekamp et al.(1991) indicated that the annual dredginginducedturbidity is of the same order asthe total turbidity generated by all shippingand mooring operations in the same basin.Very recently, Clarke et al. (2007a) reportedthe outcome of a measurement campaignto assess sediment resuspension by shiptraffic in Newark Bay, New Jersey (USA).Sediment plumes were found to varysubstantially among type (e.g. deep draftcontainer ship versus shallow draft barge/tug) and movement pattern (e.g. containership under power or manoeuvring withassistance of tug tenders, passage in openwater versus docking at berths).Total suspended sediment concentrationsoften exceeded 90 mg/l over broad areasfollowing vessel manoeuvres, and remaineddetectable against background conditionsin open waters for at least 50 minutes afterdeparture of the vessel. Residual plumes inthe lower 2 m of the water column withconcentrations of 40 mg/l or less weremeasured at the point of deep draft vesselpassage for at least 65 minutes.Clarke et al. (2007a) conclude that theassessment of dredging impacts withoutreference to these processes can result inmisleading conclusions.Intriguingly, resuspension caused by toodeep draft vessel traffic has seldom beenmeasured simultaneously with concurrentturbidity induced by dredging activities.Clarke et al. (2007b) report results from aturbidity monitoring campaign near a grabdredger working on navigation dredging inthe Arthur Kill Waterway (New Jersey).<strong>The</strong> dredger was equipped with an environmentalbucket and worked with relativelysmall hoist speed, at relatively lowproduction rates. Rather than the absolutevalues of the measured turbidity levels– which are relatively small owing to theparticular environmental conditions anddredging characteristics met on site –the main interest for this study is in thesimultaneous measurement of dredgingandshipping-induced sediment plumes(Clarke et al. 2007b). For the situationconsidered here, dredging activities andshipping operations do indeed generatesediment plumes with concentrations ofcomparable magnitude, whereas the spatialextent of the shipping induced plume maybe somewhat larger. Notice that thisobservation particularly applies to thedeeper part of the water column, whereshipping-induced impacts are relativelylarge. In the upper part of water column,grab dredging does have a discernableimpact (albeit small) whereas hardly anyeffect of the shipping operations isobserved.<strong>Dredging</strong> in perspective<strong>The</strong> case examples of sediment plumesinduced by fishery gear, natural processesand shipping operations readily reveal that“the day after we stop dredging” is by nomeans synonymous with “a world withoutsediment plumes”. <strong>Dredging</strong> is just oneprocess out of a series of processes drivingsediment plumes. <strong>The</strong> environmentalimpact of dredging works may beconsiderable in the direct vicinity of thedredger, however the impact usually actson relatively small spatial and temporalscales (Erftemeijer and Robin Lewin III,2006) and dredging operations oftengenerate no more increased suspendedsediments than commercial shippingoperations, bottom fishing or severe storms(Pennekamp et al., 1996).<strong>The</strong>se observations find support in recentlypublished data on dredging-inducedturbidity (Clarke et al. 2007b; Burt et al.2007; Land et al. 2007), sampled with thehelp of state-of-the-art ADCP-basedtechniques to measure suspended sedimentconcentrations.An effective assessment of the environmentalimpact of dredging operationstherefore demands thorough insight indredging-induced turbidity levels for variousenvironments and types of equipment, aswell as fluctuations in the backgroundturbidity level as driven by other processessuch as storms, river peak discharges,fishing and shipping. Unfortunately,a straightforward, quantitative comparisonof turbidity levels associated with thevarious driving processes is not entirelytrivial, since sediment plumes are sitespecificby nature owing to variations insediment composition, environmentalconditions, characteristics of dredgingrespectively, fishing operations, and othersite-specific elements. Moreover, theestablishment of threshold levels for theallowable dredging-induced increase ofturbidity levels should ideally be based onsound knowledge on recovery capabilitiesof ecological habitats at various time scales(Van Raalte et al., 2007). <strong>The</strong> latter
<strong>The</strong> Day After We Stop <strong>Dredging</strong>: A World Without Sediment Plumes? 19Figure 4. <strong>The</strong>oreticalanalysis of overflowmixing processes (Svasek,2006). Identification ofrelevant processes (a) andfeasible vertical range forcollecting well-mixedsamples from single-pointsampling device (b).(a)(b)demands further research on naturalecosystem dynamics.<strong>The</strong> range of knowledge gaps identifiedabove can only be filled through dedicatedcollaboration between universities, researchinstitutes, public authorities and thedredging industry, involving both engineersas well as environmental specialists.<strong>The</strong> dredging industry actively adds to thisby running research programmes aimed atthe quantitative assessment of dredginginducedsediment plumes. Recent workcarried out in the framework of the TASSprogramme is presented here.ASSESSMENT OF DREDGING-INDUCEDTURBIDITY (TASS PROGRAMME)With increasing appreciation of the importanceof environmental issues amongstpublic, government agencies and otherstakeholders, the dredging industry andassociated parties have carried out significantresearch efforts in the quantitativeassessment of sediment plumes(e.g. Pennekamp et al. 1996; John et al.2000) and will continue to do so in thenearby future (Van Raalte et al., 2007).One of the major programmes currentlyrunning is the TASS programme(Land et al., 2004). <strong>The</strong> TASS progammeaims at the development of TurbidityAssessment Software (TASS) for theprediction of the sediment release in thewater column amongst different type ofdredging equipment. <strong>The</strong> initial stages ofthe project were funded by VBKO(‘Vereniging van Waterbouwers in deBagger-, Kust- en Oeverwerken’) and theDutch Ministry of Public Works Rijkswater-staat, resulting in a preliminary modeldeveloped by HR Wallingford (1998-1999).This model includes formulations to predictthe rate of release of sediment from thefollowing dredging plant:• grab (clamshell) dredgers;• backhoes;• bucket (ladder) dredgers;• cutter suction (cuterhead) dredgers;• trailing suction hopper dredgers.Later stages of the project were funded bythe SSB (Stichting Speurwerk Baggertechniek),a strategic research cooperationof Royal Boskalis Westminster andVan Oord. During these later stages, TASSresearch efforts – at least those funded bythe Dutch dredging industry – focussedentirely on the trailing suction hopperdredgers.Further model extensions during this periodinvolved, amongst others, the inclusion of adynamic plume model to describe thedescent of the sediment plume under thedredger, directly after release from theoverflow. Shortly after release of themodels, it was recognised that high-qualitydata sets (i.e. suitable for validation ofoverall model behaviour as well as modelsub-components) were not available in thepublic domain. Field measurement methodswere inconsistent and often failed to obtain(and/or report) all the data required toassess releases from different types of plantworking in different soil conditions.Consequently, a set of standard fieldmeasurement protocols was developed foreach of the five dredgers covered by theproject (Land et al., 2004). <strong>The</strong> protocolsare freely available for anyone interestedand are still in use for the design of TASSfield experiments.<strong>The</strong> applicability of theprotocols was tested on the basis of twolarge-scale field trials, both described byLand et al. (2004). <strong>The</strong> first took place onthe River Tees (UK) in May 2000 around agrab dredger undertaking maintenancework (Burt et al., 2007). <strong>The</strong> second wasorganised in June 2002 and measuredsediment release from a trailing suctionhopper dredger working on sand miningand maintenance dredging in the Port ofRotterdam (the Netherlands).Given the present focus on trailing suctionhopper dredgers, the Rotterdam (2002) trialwas particularly relevant in view ongoingTASS research presently undertaken.<strong>The</strong> outcome of the two trials can besummarised as:• Overall the two trials were considered assuccessful in terms of providing usefuldata for model validation and testing themeasurement techniques;• Nevertheless, it must be recognised thatsome of the measurement were and willbe complex to undertake, thus yieldingdata of little practical value.This particularly holds for the sonarmeasurements of the dynamic plume(success rate 15%) and the ADCPmeasurements of draghead plumes(success rate 50%).• <strong>The</strong> Rotterdam (2002) TSHD experimentwas less successful in that it revealeddiscrepancies, when dredging sand,between two different techniquesdeployed for overflow sampling. It wasfound that the flow-through samplers(mounted on the rim of the overflow)yielded much higher concentrations thanthe bottle sampler. Despite severalefforts, no clear explanation was foundfor these discrepancies.
20 Terra et Aqua | Number 110 | March 2008<strong>The</strong>se findings were adopted as the startingpoint for two successive TASS field trialscarried out in Bremerhaven (June 2006) andRotterdam (May 2007). Both are describedbelow.TASS FIELD TRIAL BREMERHAVEN(2006)Design of field trialAs a continuation of the Rotterdam (2002)field trial, experiments were carried out inBremerhaven with the specific objective toarrive at a robust technique to collectrepresentative overflow samples duringdredging. As the use of sampling deviceson the rim of the overflow had proven tobe non-successful, it was recognizedsamples should be taken from within theoverflow with the help of a suction-typedevice. This involved two challenges.<strong>The</strong> technical challenge was to design asampling system which is robust enough towithstand the hostile hydrodynamicenvironment in the overflow and flexibleenough to take samples at various locationsand elevations within the overflow. Thissystem is described below. <strong>The</strong> theoreticalchallenge was to make sure that overflowsamples taken from a single point wererepresentative for sediment concentrationsacross the entire overflow cross-section.In other words, the samples should betaken from an area where the sedimentconcentration is uniformly distributed overthe overflow cross-section.<strong>The</strong> latter question was addressed bymeans of a theoretical analysis of mixingprocesses in the overflow (Svasek, 2006).<strong>The</strong> stages considered include the inflow,Figure 5. Location of theBremerhaven test site.supercritical flow over the rim, a free fallphase followed by a plunging jet, decayingturbulence in the pipe, uniform pipe flowand the outflow (Figure 4a). Based onsimple hydronamic rules and a fewconservative assumptions, it was found thatfor an open (i.e. non-drowned) overflow,samples could reliably be taken from anarea between 3 times the pipe diameterbelow the water surface and 1 pipediameter above the bottom end of theoverflow (Figure 4b). Moreover, since thepresence of air bubbles adversely affectsthe performance of the sampling pumps,it was recommended to locate the pumpsas deep as possible. <strong>The</strong> theoretical analysisdid not reveal a preferred horizontalposition within the overflow cross-section.During the field trial, dedicated experimentswere carried out to verify the feasibility ofthe submerged pump sampling system andthe representativeness of the samplestaken. <strong>The</strong> latter involved high-frequencysampling (typically twice per minute) in asingle point, repetitive sampling at two tothree different locations across the overflowcross-section (fixed elevation) and repetitivesampling at different elevations over a2.5 m range.Field measurements<strong>The</strong> Bremerhaven field trial was carried outbetween June 8 to 13 around the trailingsuction hopper dredger Cornelia, whichwas built in 1981, has two suction pipesand a hopper capacity of 6360 m 3 .During the measurement period she wasdredging sand in the harbour entrancechannel for the construction of a newcontainer terminal CT4. <strong>The</strong> site (Figure 5)is characterised by a tidal range of 3-4 m,significant tidal flow velocities (up to about2 m/s) and fine sand. Being located withinthe Weser estuary, the entrance channel issomewhat sheltered from direct waveaction.For the purpose of this field trial, anoverflow sampling system was developedand mounted in the overflow of theCornelia (Figure 6). <strong>The</strong> system consistedof a suction tube (Figure 6a) which wasconnected to two sub-merged pumps(Ircem DA 12M), mounted in series, witha maximum head of 10.4 m each.<strong>The</strong> suction device could be rotated arounda vertical axis to enable sampling fromdifferent locations over the cross-section.<strong>The</strong> whole system was mounted on avertical plate (Figure 6b) which could bemoved up and down the overflow, so thatsamples could be taken at differentelevations. Samples were collected by fillingbottles (Figure 6c) of known weight andvolume, which were weighted onboard todetermine sediment concentrations.To obtain in-situ flow velocities, a MarshMcBirney single axis current sensor wasmounted near the suction mouth(Figure 6a). Finally, a CTD diver ofVan Essen was used to measure salinity,temperature and conductivity throughoutthe experiments.<strong>The</strong> Bremerhaven field trial yielded a totalnumber of eight successful experiments,two of which were carried out duringmaintenance dredging of muddy materialin front of the existing container terminaland the other six during offshore sandmining for the construction of the newterminal.ResultsFigure 7 shows example time series ofsediment concentrations (a, b) and flowvelocities (c, d) measured in the overflow,representing a fine sand run (Trip 158,panel a, c) in the offshore borrow area anda maintenance run with muddy sediment(Trip 157, panel b, d) in front of theexisting terminal. <strong>The</strong> upper panels alsoshow time series of the hopper volume forboth trips, to indicate when the overflowwas being operated.
<strong>The</strong> Day After We Stop <strong>Dredging</strong>: A World Without Sediment Plumes? 21abcFigure 6. Overflow sampling during the Bremerhaven (2006) field trial. Sampling device in lifted position (a), deployment of total sampling system on movable plate in overflow (b)and filling 1 liter bottles (c).Trip 158 was meant to investigate thetemporal variability of overflow samplestaken from a single point at a fixedelevation. <strong>The</strong> results show that the pumpsampling system is capable of measuring aconsistent time series, particularly if theoverflow is at a constant level (i.e. prior to21:00 hr). While lowering the overflow(21:00-21:20 hr) the flow pattern is moreirregular and air entrainment becomesmore of an issue, and consequentlyvariations in sampled discharges occur.This may explain the somewhat largervariability in measured concentrations asobserved from Figure 7a. Nevertheless, alsoduring the latter phase, variability is smallas compared to the overall signal. It isconcluded that a sampling frequency ofonce per minute is sufficient to resolve theevolution of overflow concentrations overtime. <strong>The</strong> measured concentration profileof Trip 157 illustrates the effect of samplingat different locations within the overflowcross-section (while dredging mud).Samples were taken at 30 (blue dots),60 (red dots) and 90 (green dots) cm fromthe wall. <strong>The</strong> concentrations measured inthe three locations are entirely consistentwith each other, thus demonstrating spatialuniformity of the concentration distribution.Similar results were obtained whiledredging sandy material, albeit thatsampling system often failed to collectmaterial at the near-wall sampling location.This was attributed to the presence of airbubbles; a sound explanation for this observationhas however not been found yet.<strong>The</strong> two lower panels (c, d) show largefluctuations in the flow velocity in theoverflow, suggesting a highly turbulentflow with major eddies. To ground-truththese data, the total discharge through theoverflow was computed from integration ofthe measured velocities over time,multiplied with overflow area.For all experiments, the overflow dischargewas rougly similar to the combineddischarge in the two suction pipes asdetermined from the on-board instruments.To minimise sampling logistics and complexity,it was concluded that for futureexperiments the average velocity in theoverflow could safely be estimated fromthe velocity meters in the suction pipes.Overall, the following conclusions aredrawn from the Bremerhaven (2006) fieldtrial:1. the use of a submerged pumping systemto collect in-situ samples from a singlepoint near the bottom end of theoverflow is a reliable method to quantifysediment losses in a free-flow overflow(i.e. without the use of an environmentalvalve);2. the presence of air bubbles in the mixturecauses occasional failure of the samplingsystem;3. a sampling frequency of once per minuteis sufficient to resolve the evolution ofsediment concentrations over time;4. for the purpose of this work,measurement of in-situ flow velocities isof little added value as compared to theuse of velocity estimates determined fromthe on-board sensors in the suctionpipes.<strong>The</strong> Bremerhaven (2006) data are presentlybeing exploited for the validation of theoverflow model in the trailer module of theTASS model.TASS FIELD TRIAL ROTTERDAM (2007)Design of field trial<strong>The</strong> Rotterdam (2007) field trial was set-upwith a four-fold objective (Figure 8):1. measurement of overflow losses, toenable validation of the TASS trailermodule;2. measurement of concentrations in thesediment plume behind the dredger, toenable validation of passive plumemodels (which are feeded by the TASSdynamic plume model) and to assess thebenefit of the use of a green valve in theoverflow;3. measurement of draghead-inducedturbidity, to address the importance ofbulldozing effects and jets for environmentalassessments;
22 Terra et Aqua | Number 110 | March 2008Figure 7. Example timeseries of sediment concentration(a, b) andflow velocity (c, d) fora mining run (Trip 158,fine sand) and a maintenancerun (Trip 157,mud) during theBremerhaven (2006)field trial. <strong>The</strong> upperpanels also show timeseries of hopper volume(blue line) to indicatewhen the overflow wasbeing operated.4. measurement of propeller wash behindthe dredger as well as other vessels, tofacilitate evaluation of dredging-inducedturbidity increase against other, “natural”sources affecting the background level.<strong>The</strong> “Protocol for the Field Measurementof Sediment Release from Dredgers”(HR Wallingford, 2003) was adopted asa starting point for the design of theRotterdam (2007) trial. As an extension ofthis, it was decided to follow a top-downapproach as regard to the balance betweenoverall impact measurements and detailedprocess measurements. For instance, theassessment of the benefits of the greenvalve will be based on measured passiveplume concentrations rather than detailedprocess measurements of active plume –propeller interaction and bubble dynamicsunder, besides and direct behind the trailer.<strong>The</strong> latter (complex) process measurementsare only relevant for TASS development ifthe application of a green valve doesindeed result in substantially smaller plumesand lower sediment concentrations.A similar rationale applies to the measurementof propeller wash. An SSB-fundedreview of the effect of propeller wash neardredging equipment (HR Wallingford, 2006)indicated that for fairly regular conditions,the vertical erosion rate at the point ofgreatest erosion could be in the order of10-15 cm/s. On the basis of this study, itwas decided to attempt to quantifypropeller wash from simple depth soundingbehind the moving vessel, in combinationwith simultaneous ADCP concentrationmeasurements over the water column,rather than putting frames on the seabedequipped with very advanced sensors thatmeasure propeller wash during passage ofthe vessel over the frame.<strong>The</strong> harbour entrance of the Port ofRotterdam (Figure 9a) was selected as thefield site for this trial for several reasons.Since most parties involved are based inRotterdam or its direct neighbourhood,logistics are relatively easy. Moreover, thesite offered the opportunity to monitor acombined nourishment / maintenancedredging project, which was carried out bythe trailing suction hopper dredger Oranje.This dredger, operated by Boskalis, isequiped with a green valve and wasscheduled for a docking period just prior tothe field trial. <strong>The</strong> latter offered theFigure 8. Site layout left, of the Rotterdam (2007) field trial and of grain size distributions of areas F and G.
<strong>The</strong> Day After We Stop <strong>Dredging</strong>: A World Without Sediment Plumes? 23opportunity to mount specific overflowsampling equipment safely and accuratelyunder controlled, dry conditions.Field measurements<strong>The</strong> Rotterdam (2007) field trial was carriedout between May 1 and May 12, coveringa total of 7 measurement days. Overflowmeasurements were carried out onboard ofthe Oranje (Figure 9); all other measurementswere taken from with the help ofthe survey boat Corvus (Figure 10), whichis operated by <strong>The</strong> Dutch Ministry of PublicWorks Rijkswaterstaat.Figure 9. Overflow measurements were carried out onboard TSHD Oranje involved with the Rotterdam (2007) field trial.During the first two measurement days,the Oranje was dredging sand for beachnourishment in front of Hook of Holland;the other five measurement days werespent on maintenance dredging in theMaasgeul (areas E, F and G, cf. Figure 8).Most good-quality measurements werecollected during maintenance dredging.<strong>The</strong> site is characterised by a 1-2 m tidalrange, fairly strong currents (up to 1.5 m/s)and, being fully exposed to North Seawaves and swell, possibly big waves.A variety of sediment grain sizes is found,ranging from sand in the offshore borrowareas, via fine sand, Area G and fine sandwith silt, Area F to mud, Area E (Figure 8).<strong>The</strong> measurements onboard of the Oranjefocussed on the quantification of overflowlosses. To that end, an airlift was beingdesigned and built to lift mixture samplesfrom the lower end of the overflow to decklevel. An airlift type construction waschosen to enable in-situ sampling in theoverflow, while avoiding the need tomount vulnerable, submerged pumps in theoverflow and minimizing possible failuresdue the presence of air bubbles. <strong>The</strong> airlift(Figure 11a) consisted of a 2.5 cm wide,approx. 18 m long suction tube mountedwithin a strong, steel pipe to createsufficient stability. Near the lower end, avertical suction mouth was placed, whichwas continously flushed while not in use toavoid siltation. A third, 1 cm tube wasmounted within the overflow to inject air inthe suction tube at approximately 1 mabove the lower end. After being collected,the mixture is run through a combinedmixing / sampling device (Figure 11b/c).While doing so, the material passes aperspex cylinder with a so-called Medusasensor mounted on it, which measuresmixture density in real time from theradiance decrease across the cylinder.In addition, simultaneous bottle sampleswere collected during a few runs, insupport of further ground-truthing (inretro-respect) of overflow samples takenduring the Rotterdam (2002) field trial.<strong>The</strong> survey boat Corvus was responsiblefor all measurements around the trailer,including collection of bed and watersamples for calibration purposes. <strong>The</strong>Corvus was equipped with two ADCPs,one mounted on a stabilised towfish(Figure 12a) for the monitoring of dragheadplumes and a second mounted on a frameaside the Corvus (Figure 12c) for themonitoring of passive plumes behind thetrailer. <strong>The</strong> data on draghead resuspensionwere obtained by sailing the Corvusextremely close astern the Oranje (Figure12b) with the ADCP towfish floating at adepth of about 10 m to avoid anyinterference with propeller impacts.Besides the frame-mounted ADCP data,concentration measurements were alsocollected with the help of a string equippedwith three OBS sensors. During sailingthese sensors migrate up and down thewater column to arrive at a good spatialcoverage of the plume. <strong>The</strong> two duplicatemeasurements were carried out to obtaingood understanding of the accuracy ofboth methods, as a function of the distanceto the dredger (hence air bubble effects).Figure 10. <strong>The</strong> survey boat Corvus which was providedby <strong>The</strong> Dutch Ministry of Public Works Rijkswaterstaat.
24 Terra et Aqua | Number 110 | March 2008acFigure 11. Measurement of overflow losses on-boardof the Oranje: (a) Airlift, (b) overview of measurementarea including Medusa sensor and (c) mixture samplingin 0.5 liter bottles from mixing device.insight in optimal means to collect overflowsamples for the quantification of overflowlosses over a range of soil types, overflowconfigurations and environmentalconditions.bMoreover, it is expected that the Rotterdam(2007) field trial will help to assess therelevance of draghead plumes and propellerwash in view of dredging-induced turbidity,as well as the benefits of using a greenvalve. Both data sets will be used for TASSmodel validation and the idenfication offuture model developments and researchneeds.Although the TASS programmefocusses on dredging-induced turbidityincreases, it should be noted that dredgingis just one of a series of processes that drivesediment plumes.Finally, regular survey equipment wasdeployed for the measurement of propellerwash from bathymetric changes and waterquality parameters such as salinity andtemperature.ResultsDuring the Rotterdam (2007) field trial,overflow losses were measured during14 different trips. Besides, a total numberof 6 passive plumes, 11 draghead plumesand 8 propeller wash events weremeasured. When compared to numbersaimed for prior to the trial, this correspondsto data return rates of about 90%(overflow losses), 30% (passive plume),70% (draghead plumes) and 80%(propeller wash). <strong>The</strong> large percentage forthe overflow losses is attributed to goodperformance of the airlift, in combinationwith the added value of the bottle samplesand Medusa concentration measurements.<strong>The</strong> somewhat disappointing percentage ofdata return for the passive plumes is due tothe large wave height offshore, whichexceeded 1.5 m during most of the experiment.Fairly good percentages of data returnwere obtained for the draghead andpropeller wash measurements. <strong>The</strong> datasampled during the Rotterdam (2007) fieldtrial are presently being analysed. Preliminaryresults reveal robust performance of theairlift system to collect sediment samplesfrom the overflow.Moreover, mixture densities thus measuredare consistent with the data retrieved fromthe Medusa sensor. <strong>The</strong> data will be usedfor the validation of specific components ofthe TASS model as well as the identificationof future model developments.CONCLUSIONS<strong>The</strong> work presented here shows the recentprogress in the framework of the TASS(“Turbidity Assessment Software”)programme, which aims at the developmentof a validated model to predictdredging-induced turbidity levels. A keycomponent of this program is the executionof a series of large-scale field trials tocollect high-quality data that can be usedfor model validation purposes. Recent fieldtrials carried out in Bremerhaven (2006)and Rotterdam (2007) resulted in valuable<strong>The</strong>se processes include natural events,shipping operations and fishing activities.An inventory of these processes suggests,at least qualitatively, that the annual impactof these processes is of the same order ofmagnitude as dredging. Consequently, theconclusion must be that “<strong>The</strong> day after westop dredging” will by no means mark theonset of a world without sediment plumes.REFERENCESBurt, N., Land, J. and Otten, H. (2007).Measurement of sediment release from a grabdredge in the River Tees, UK, for the calibrationof turbidity prediction software. WODCON 2007Conference Proceedings, Orlando (FL, USA), pp.1173-1190.Clarke, D., Dickerson, C., Reine, K., Zappala, S.,Pinzon, r. and Gallo, J. (2007a). Preliminaryassessment of sediment resuspension by shiptraffic in Newark Bay, New Jersey. WODCON2007 Conference Proceedings, Orlando (FL,USA), pp. 1155-1172.Clarke, D., Reine, K., Dickerson, C., Zappala, S.,Pinzon, R. and Gallo, J. (2007b). Suspended
<strong>The</strong> Day After We Stop <strong>Dredging</strong>: A World Without Sediment Plumes? 25abcFigure 12. Deployment of survey boat Corvus during Rotterdam (2007) field trial: (a) Stabilised ADCP, (b) Corvus passing astern of the Oranje while monitoring draghead plumes,and (c) overview of measurement equipment onboard of Corvus including. frame for ADCP- as well as OBS-based passive plume monitoring.sediment plumes associated with navigationdredging in the Arthur Kill Waterway, NewJersey. WODCON 2007 Conference Proceedings,Orlando (FL, USA), pp. 1135-1154.Erftemeijer, P.L.A. and Robin Lewis III, R.R.(2006). Environmental impacts of dredging onseagrasses: A review. Marine Pollution Bulletin52 (2006), pp. 1553-1572.Google Earth (2007). Google, Mountain View,CA (USA). See http://earth.google.com.John, S.A., Challinor, S.L., Simpson, M., Burt, T.N.and Spearman, J. (2007). Scoping the assessmentof sediment plumes from dredging. CIRIA ReportC547, London, 188 pp.Land, J., Burt, N. and Otten, H. (2004).Application of a new international protocol tomeasurement of sediment release from dredgers.WODCON 2004 Conference Proceedings,Hamburg (Germany), paper B5-1.Land, J., Clarke, D., Reine, K. and Dickerson, C.(2007). Acoustic determination of sediment lossterms for mechanical dredging operations atProvidence, RI, USA. WODCON 2007 ConferenceProceedings, Orlando (FL, USA), pp. 1209-1228.Pauly, D., Christensen, V., Guenette, S., Pitcher,T.J., Sumaila, U.R., Walters, C.J., Watson, R. andZeller, D (2002). Towards sustainability in worldfisheries. Nature 418, pp. 689-695.Pennekamp, Joh.G.S., Blokland, T. and Vermeer,E.A. (1991). Turbidity caused by dredgingcompared to turbidity caused by navigation.Paper B2, CEDA-PIANC Conference, Amsterdam,the Netherlands. 9 pp.Pennekamp, Joh.G.S., Epskamp, R.J.C.,Rosenbrand, W.F., Mullié, A., Wessel, G.L., Arts,T. and Deibel, I.K. (1996). Turbidity causes bydredging: Viewed in perspective. Terra et Aqua,Number 64, Sept. 1996.Svasek (2006). Overflow measurements“Cornelia”. Svasek Report BvP/06598/1364.Vanderploeg, H.A., Johengen, T.H., Lavrentyev,P.J., Chen, C., Lang, G.A., Agy, M.A., Bundy,M.H., Cavaletto, J.F., Eadie, B.J., Liebig, J.R.,Miller, G.S., Ruberg, S.A. and McCormick, M.J.(2007). Anatomy of the recurrent coastalsediment plume in Lake Michigan and its impacton light climate, nutrients and plankton. Journalof Geophysical <strong>Research</strong>, 112, CO3S90,doi:10.1029/2004JCO02379.Van Houtan, K.S. and Pauly, D. (2007a). Ghostsof destruction. Nature, Vol. 447, 10 May 2007,pp. 123.Van Houtan, K.S. and Pauly, D. (2007b). Remoteobservation of mudtrails from fishing trawlers.<strong>Research</strong> paper, in preparation.Van Raalte, G., Dirks, W., Minns, T., Van Dalfsen,J., Erftemeijer, P., Aarninkhof, S. and Otter, H.(2007). Building with nature: Creatingsustainable solutions for marine and inland waterconstructions. New research initiative towards aCentre of Excellence. WODCON ConferenceProceedings, Orlando (FL, USA), pp. 637-648.Walker, N.D. (1996). Satellite assessment ofMississippi River plume variability; Causes andpredictability. Remote sensing of environment.ISSN 0034-4257, Vol. 58, No. 1, pp. 21-35.
26 Terra et Aqua | Number 110 | March 2008Oliver stoschekPOSSIBILITIES OF MINIMISINGSEDIMENTATION IN HARBOURSIN A BRACKISH TIDAL ENVIRONMENTABSTRACTSedimentation in harbour entrances at tidaland brackish rivers owing to tidal currentsand turbulent mixing processes cannot beavoided. Reducing sedimentation inharbours can significantly decreasemaintenance dredging costs. Differentmechanisms of sediment movement into aharbour in a tidal and brackish environmentare evaluated in a regional numerical3-dimensional-model of the Weser Estuary.In a parametric study, complex multidimensionalboundary conditions wereextracted from this regional model to runseveral detailed numerical 3-dimensionalmodelswith different geometries, tidalconditions and salinity.<strong>The</strong> influence of these parameters onsedimentation in harbours was determined.<strong>The</strong> results of this parametric study wereused to develop solutions to reducesedimentation in harbours in a brackishtidal environment.<strong>The</strong> study was part of a joint researchproject financed by the German FederalMinistry of Education and <strong>Research</strong>(Bundesministerium für Bildung undForschung, BMBF) and carried out at theFranzius Institut, University of Hannover.<strong>The</strong> author gratefully acknowledges thecooperation and provision of field datafrom Prof. H. Nasner, University of AppliedSciences, Bremen and the FederalWaterway Authority (WSA Bremerhaven).This article was presented at the Black SeaCoastal Association Conference (BSCA) onPort Development and Coastal Environment,September 2007, held in Varna, Bulgariaand is reprinted here with permission ina slightly adapted version.INTRODUCTIONHarbours in sediment-laden rivers andestuaries with their changing flow velocitiesand directions and water levels owing todaily tides often show heavy sedimentation.To keep such vital facilities operational,costly removal of sediments is necessaryeither permanently or periodically.Sediment loads originate from bed andbank erosions or influx from the catchmentareas upstream. Variation in sedimentqualities and in quantities is considerablewith the discharge varying over the year.Above: Tugboats lined up at the entrance to theKaiser-Lock, at the port of Bremenhaven.In the downstream part of an estuary mixingof salt water from the sea with fresh riverwater results in density variation causingdensity currents near river beds andadditional sediment transport caused bybrackish water effects.<strong>The</strong> large quantities of often contaminatedsediments to be removed from a harbourbasin and the cost associated with suchmaintenance dredging and disposal createa strong stimulus and interest to understandthe exchange processes betweenrivers and harbours and, upon such understanding,find solutions for reduction oreven prevention of sediment intrusion anddeposition.OBJECTIVES<strong>The</strong> objectives of this study are to analysethe complex coherencies in a brackish tidalzone. For this reason the complex 3-dimensionalcurrents were split into the differentcomponents to gain new knowledge onsedimentation in harbours. <strong>The</strong> complexsituation in the brackish tidal zone ofthe River Weser was used to set up aconceptual model to investigate the effectsof tidal and density induced currents on
Possibilities of Minimising Sedimentation in Harbours in a Brackish Tidal Environment 27Figure 1. Density differences, flows, sediment and water exchange in a tidal harbour.DR. OLIVER STOSCHEKreceived the CEDA Environmental Commission prizefor the best paper from Neville Burt (left), Chairmanof the Central <strong>Dredging</strong> Association EnvironmentCommission at the Black Sea Coastal AssociationConference on Port Development and CoastalEnvironment, September 2007, in Varna, Bulgaria.Dr. Stoschek graduated in 1997 as a civil engineerwith a speciality in hydraulic engineering (Dipl.-Ing.)from the University of Hannover, Germany and in2003 received a Ph.D. in coastal engineering from theFranzius-Institut, University of Hannover. He ispresently Head of the Hydraulic Department at DHIWasser & Umwelt GmbH, Syke, Germany.sedimentation in harbours. <strong>The</strong> results wereused for investigations to reduce thesedimentation inside a harbour in thebrackish tidal zone in Bremerhaven.gradation of sediment to the outside fromfine to coarse.Reversing and unsteady river flows in anestuary during a tidal cycle change thedirections of vortices while sediment influxfrom the river continues, depending uponsediment loads and variation of the riverflow velocities (Langendoen, 1992).Additional water exchange during a tidalcycle from the so-called tide effect, whichdepends on the tidal range, increasessediment influx into the harbour.In lower parts of an estuary inflow of saltwater from the sea, stratification caused bydensity differences and the resultinginitiation of density currents may occur,adding considerable complexity to thesedimentation problem (Figure 1).In addition, specific biogenic and cohesiveflocs and their time dependent behaviourincrease the complexities. In this studya 3-dimensional approach as applied bydifferent researchers, e.g. Mehta (1986)and Langendoen (1992) gave better insightsinto the problem and some technicalproposals for reduction of sediment influxand deposition.Only recently, detailed measurements withadvanced instrumentation gave a basis fora detailed calibration of 3-dimensionalsimulations. With observations and datafrom the lower part of the Jade-WeserEstuary discharging into the southern NorthWATER AND SEDIMENT EXCHANGENumerous experimental investigations havebeen carried out on the exchange of watersbetween a river and a harbour basin formore than six decades to understand thebasic processes. A first systematic approachby Rohr (1933) was limited to 2-dimensionalhorizontal flow fields, neglectingvertical velocity profiles.It could be shown that the so-called floweffect initiates one or more vertical largescale vortices in the harbour, dependingupon the entrance width and harbourgeometry as well as river flow velocities(Figure 1). Experiments and site observationsconfirmed that sedimentation is concentratedin the centres of such vortices with theFigure 2. Weser Estuary around the port of Bremerhaven and model boundaries.
28 Terra et Aqua | Number 110 | March 2008oftheSalinity, suspended sediment and waterlevel at Gauge “Bremerhaven”:a) Spring Tide (Q River= 210 m 3 /s)b) Neap Tide (Q River= 300 m 3 /s)c) Spring Tide (Q River= 800 m 3 /s)d) Max. and min. suspended sediment and freshwater discharge (Q river)Figure 3. Suspended sediment and salinity varying with tide and river discharge at Bremerhaven.Sea extensive simulations for the Port ofBremerhaven and for similar harbours weremade to extract the different effects.Based on these model results technicaloptions for reduction of sedimentation ina tidal harbour were evaluated (Stoschek,2004; Stoschek et al., 2003).various contents and fractions. <strong>The</strong> modelarea is shown in Figure 2. <strong>The</strong> modelresolution rages from 45 m in the outerregions to 5 m in the harbour area. In thesedetailed areas the numerical results will becompared with measurements.Tides are semidiurnal and asymmetric.<strong>The</strong> mean tidal range is about 3.8 m atBremerhaven. <strong>The</strong> long-term mean riverdischarge recorded about 30 km upstreamfrom the tidal barrage at gauge “Intschede”is about 320 m³/s. Sediment dischargesMODEL AREA AND BOUNDARYCONDITIONS<strong>The</strong> Port of Bremerhaven, located at thelower end of the Weser Estuary (Figure 2)at the southern North Sea coast is one ofthe major ports of Germany with athroughput of 14 Mio tonnes annually.Navigation on the 60 km long lower RiverWeser, which has been continuouslydeepened and widened within the fairwayfor more than 110 years, allows ships toapproach with a draft of up to 14.5 m attidal low waters. Sediment intrusions intothe various harbour basins require annualdredging of sediment, to be disposed onland after separation and specific treatment Figure 4. Water level differences and salinity variations at gauge station Bremerhaven for period A.
Possibilities of Minimising Sedimentation in Harbours in a Brackish Tidal Environment 29from upstream vary from 10 kg/m³ to morethan 500 kg/m³ and salt water concentrationsvary from 0 to above 32 g/l (Figure 3).MODELLING TECHNOLOGYTo set up this study a numerical finitedifferences model of DHI was used (MIKE 3):<strong>The</strong> programme was selected after comparisonand tests of various 3-dimensionalprogrammes, considering the adequatemodelling of turbulence, shear stress, massexchange between bed layers of varyingconsolidation, settling of particles and flocsin cohesive sediments, sedimentation anderosion processes at and within the layerand density effects from varying salinityintrusions. It uses Finite Difference (FD)algorithms, solving the 3-dimensional nonhydrostaticNavier-Stokes Equations. Smallscalestructures could be modelled withhorizontally compacted grids (nesting).Vertical resolution was with equidistantlayers, except for the bottom and top layer,to allow bottom and tidal variations (DHI2003 a, b). <strong>The</strong> theoretical background ofMIKE 3 HD can be found in Vested et al.(1992) and Ekebjaerg and Justensen (1991).MODEL AND MODEL CALIBRATIONCalibration of the hydrodynamics anddensities/salinities for Gauge “Bremerhaven- Alter Leuchtturm” were made for twoperiods (Period A - spring tide: 13.09.200002:00 to 14.09.2000 22:00 and Period B -neap tide: 14.05.2001 06:00 to 16.05.200101:00). <strong>The</strong> calculated tidal water levelshowed maximum deviations of 0.08 mfrom the recorded tidal range of > 3.4 m(Figure 4).For additional calibration and verification offlow velocities, ADCP measurements from aharbour basin and some river profiles infront of the harbour of Bremerhaven NorthLock (IWA-Bremen, 2003) were used.Comparison has to be done extremelycareful, due to the necessary time toproduce an area map of flow velocities fromADCP profiles. Thus, flow velocities wereselected on a point-to-point basis andcompared with model results at preciseFigure 5. Measured and calculated salinity (left, point 4: 14.09.2000 8:35, around TLW) and suspended sedimentconcentration (right, point 6: 15.05.2001 08:44, 2.2h after THW).time and location of the measurement(Franzius-Institut, 2003). Flow velocitieswere averaged over MIKE 3 cells and transferredto calculation nodes for each verticalADCP measurement (spot).Flow velocities in the harbour entrance andin the River Weser differ with a maximumof 10 cm/s. Comparisons show that majoreddy structures are reproduced (dimension,time of development, rotation, shape andmovement through the harbour duringtidal cycle). <strong>The</strong> resulting parameter setafter the hydrodynamic calibration is shownin Table I. <strong>The</strong> comparison of the measuredand computed salinity show differences ofless than 3 g/l from a maximum of 21 g/l insalinity (Figure 4). Good agreements couldalso be observed for the vertical salinityprofile (Figure 5). Larger deviation betweenmeasurements and simulations are owingto the single location measurements in theRiver Weser, and mixing zones of sea andriver water vary with tides and riverdischarges.Suspended sediment intrusion andsedimentation inside the harbour showedTable I. Parameter set after hydrodynamic model calibration.Bottom roughness for the whole model area: k=0.05 mTurbulence Model: c sm=0.5, c m=0.09, c 1=1.44, c 2=1.92, c 3=0, s k=1, s e=1.3, k=1e -7 , e=5e -10Table II. Calibration parameter for sediment transport model.Model ParameterValueDispersion Factor [-] 0.01Settling Velocity [mm/s] 0.2Maximum Concentration for Deposition [kg/m 3 ] 3.0Partial Shear Stress for Deposition [N/m 3 ] 1.5Critical Shear Stress for Deposition [N/m 3 ] 0.06Erosion Constant [-]Critical Shear Stress for Erosion (upper Layer) [N/m 2 ]Density of Bed Layer (upper Layer) [kg/m 3 ]1.00E-050.3 (Harbour) / 2.0 (River)1000 (Harbour) / 2000 (River)
30 Terra et Aqua | Number 110 | March 2008good agreement between measurementand simulation (Figure 5). Transport ofsuspended materials along the River Weserand, during certain tidal phases, the largetidal mud flats, its motion and fluctuationof concentration over the tidal cycles couldbe visualized (Stoschek, 2004). In Figure 5the calculated and the measured verticaldistribution of the suspended sedimentconcentration 2.25 h after THW is shown.<strong>The</strong> calculated SSC underestimates themeasurements. <strong>The</strong> calibration parameterare given in Table II.Model results show that sedimentationoccurs mainly at the end of the floodperiod (last 30%). <strong>The</strong> maximum suspendedsediment concen tration can be foundat the end of the flood period and at theend of the ebb period of spring tide.Consequently, the period of main sedimenttransport into the attached harbours ofBremerhaven is identified.Figure 6. Detailed model area and boundary conditions of a parametric study.EFFECT OF HARBOUR GEOMETRY ONSEDIMENTATIONThis model from a real estuary was taken toanalyse the relation between flow effect,tide effect and density effects with systematicsimulations of various harbourgeometries, i.e. varying basin lengths,widths, entrance openings and diversionangles (Stoschek, 2004). For this reasonthe depth- and time-varying boundaryconditions for a detailed harbour modelwith varying harbour geometries wereextracted from this calibrated Weser model(Figure 6).A significant result is the importance ofdensity currents on sediment intrusions,driven by varying salinities over the tide,initiating a two-layer counteracting vortexsystem in the harbour basin (Figure 7) overcertain periods of a tidal cycle. During floodtide in the upper parts of the harbour withless salinity and sediment in suspension,flows are directed seawards.Sand sediments will settle near the harbourentrance while fine sediments will be transportedinside the harbour. Two differenttypical types of harbour were used for thesystematic study. <strong>The</strong> first one (A) is anearly quadratic type of harbour (width B H:450 m; length L H: 550 m). This harbour hasa larger surface and, in general, a reducedentrance width. In this case the entrancewidth B Ewas altered from 450 m to 50 mNear the bottom, velocities are directedinto the harbour. <strong>The</strong>se velocities are belowcritical bed shear stress that major parts ofthe suspended sediments can settle down.Figure 7. 3-dimensional exchange flows between a nearly rectangular harbour and a river showing differing vectorsand directions from surface to bottom due to flood currents a) with density effects and b) without density effects(B E=B H; spring tide, mNN= German Reference Level).
Possibilities of Minimising Sedimentation in Harbours in a Brackish Tidal Environment 31(Table III). <strong>The</strong> second investigated harbourtype (B) is a rectangular harbour basin. Thisbasin has a significantly reduced width B Has well as a significantly reduced harboursurface.In general the angle a of theharbour axis to the river axis differs from90° due to nautical reasons. In this case theharbour length is L H=500 m. <strong>The</strong> harbourwidth is B H=120 m. <strong>The</strong> angle from thebasin axis to the river axis a differs from30° to 150°.<strong>The</strong> entrance width is a function of theharbour width and the angle a (Table III).<strong>The</strong> systematic study shows that, togetherwith the increased suspended sedimentconcentration in the lower part of the waterbody, the harbour basin fills with additionalwater by a factor up to 3.3 for the harbourA and up to 4.6 for the harbour B,compared to the situation without densitygradients (Table III). <strong>The</strong> density effect isgetting more important (proportional) dueto smaller harbour entrances. <strong>The</strong> overallamount of exchanged water in a brackishtidal environment will be reduced nearlylinearly to the width of the harbourentrance (Table III). <strong>The</strong> amount ofsediment will be reduced significantly(Figure 8).<strong>The</strong> effect of the angle between basin andriver axis, which for nautical reasons oftendeviate from 90°, results in increasedinflows and intrusions of sediment loadedTable III. Water Exchange and Sedimentation due to systematic simulations ofvarious harbour geometries.HarbourTypeTable IV. Mean water exchange and sedimentation between harbour andWeser during 1 Tide for different harbour entrances.BremerhavenEntrancewidth[m]DiversionAngle withRiver [ o ]Harbour Area[m 2 ]Spring Tide,DH=3.94m,with Flow +Tide EffectsMean water exchange[m 3 /Tide]waters from the river (Table III). Here it hasto be noted that in order to keep aconstant basin area the entrance widthbecomes larger for geometrical reasonsresulting in higher sedimentation.Water Exchange [m 3 /Tide]Spring Tide,DH=3.94 m,with DensityEffectsChange[%]Neap Tide,DH=3.55 m,with DensityEffectsSpring Tide,DH=3.94 m,with Flow +Tide EffectsMean edimentationheight [mm/Tide]Actual 3.751.676 3.04Sedimentation [m 3 /Tide]Spring Tide,DH=3.94 m,with DensityEffectsNeap Tide,DH=3.55 m,with DensityEffects(1) (2) (3) (4) (5) (6) (7) (8) (9) (10)1 450 90 247.500 4.917.391 10.513.386 8.338.120 -6,74 374,87 46,372 350 90 247.500 3.322.590 8.698.277 6.915.276 -7,41 368,13 44,46A 3 250 90 247.500 2.178.146 6.651.345 5.262.207 -5,00 355,73 43,374 150 90 247.500 1.260.375 4.157.517 3.092.442 -2,58 276,22 35,465 50 90 247.500 1.060.565 1.679.478 1.339.391 1,42 134,87 12,651 240 30 60.000 2.457.937 4.352.531 3.659.360 -6,95 99,71 6,502 165 45 60.000 1.390.596 3.263.988 2.540.703 -3,72 100,38 10,673 135 60 60.000 1.057.531 2.787.299 2.204.052 -2,38 99,10 11,994 120 75 60.000 770.196 2.658.203 2.017.014 -1,89 107,09 12,13B 5 120 90 60.000 666.495 2.633.147 1.920.268 0,30 123,97 12,236 120 105 60.000 581.919 2.700.524 1.927.273 -1,40 131,65 13,537 135 120 60.000 852.847 2.825.066 2.031.677 -1,16 134,94 14,008 165 135 60.000 1.144.178 3.262.983 2.345.280 -1,65 156,09 14,579 240 150 60.000 1.909.930 4.211.583 2.855.396 -4,88 166,15 12,39Change[%]40% reduced entrance width 2.860.040 -23.8% 2.91 -4.5%CDW 3.382.488 -9.8% 2.90 -4.8%Break line / level difference 3.613.193 -3.7% 2.81 -7.6%CDW + break line 3.116.604 -16.9% 2.76 -9.1%A summary of results in basin sedimentationis given in Table III. It shows thatsalinity driven currents clearly increasesedimentation. Without salinity gradient theinflowing sediment would be driven out ofFigure 8. Mean sedimentation height per tide in a nearly rectangular harbour with a) full entrance width (B E=1,0B H) and b) reduced entrance width (B E=0,11B H)
32 Terra et Aqua | Number 110 | March 2008Figure 9. Current Deflecting Walldownstream a tidal harbourentrance combined with a sill.the basin as indicated by the negativesedimentation in Table III.CASE STUDY “BREMERHAVENNORDSCHLEUSE”For harbour type A from 50% (smallentrance) to 90% (B E=B H) of the waterexchange result from density and floweffect. Water exchange in harbour type Bis permanently larger than 90% with smallvariations owing to the angle a. Limitationon the reduction of one of both maineffects will not result in optimised harbourgeometry.For the Test Case “Bremerhaven Nordschleuse”the calibrated model will be usedto redesign the entrance of the harbour infront of the North Lock (Figure 2). Fourdifferent entrance variations were tested:1 <strong>The</strong> entrance width was reduces by 40%.2 A Current Deflection Wall (CDW) wastested to reduce the flow effect(Leeuwen, Hofland, 1999; Figure 9).3 Density currents were influenced by usinga sill / bottom level difference in front ofthe complete entrance width.4 <strong>The</strong> combination of the level differenceand a CDW was tested.<strong>The</strong> results are shown in Table IV. <strong>The</strong> waterexchange between river and harbour wasreduced significantly by reducing theentrance width. <strong>The</strong> sedimentation heightwas only notably reduced by a combinationof two measures. A relation between waterexchange and the mean sedimentationheight could not be found.CONCLUSIONSSediment intrusion from tide- and densitydrivenestuaries into a diverting harbourbasin will remain a major factor in operationand maintenance of harbours. For optimisationof orientation of the harbour axis andentrance width an effective method ofsignificantly decreasing harbour sedimentation3-dimensional simulations havereached a reliable standard for identificationof the governing local processes, from flow,tide, density effects on sediment intrusionand deposition. Maintenance dredging,fluidisation measures or structures againstsedimentation can be rationally supported.REFERENCESDHI (2003a). MIKE 3: Estuarine and CoastalHydraulics and Oceanography, ScientificDocumentation, Danish Hydraulic Institute,Horsholm, Denmark.DHI (2003b). MIKE 3: Estuarine and CoastalHydraulics and Oceanography, Mud TransportModule, Danish Hydraulic Institute, Horsholm,Denmark.Ekebjaerg, L., Justensen, P. (1991). An explicitscheme for advection-diffusion modelling in twodimensions, Computer Methods in AppliedMechanics and <strong>Engineering</strong>, (88) 3.Franzius-Institut (2003). Sedimentation inbrackwasserbeeinflussten Häfen, Teilprojekt:Maßnahmen zur Minimierung der Sedimentationim Bereich brackwasserbeeinflusster Vorhäfen,Final report of the combined BMBF researchproject, Franzius-Institut, University of Hannover,Germany.Langendoen, E. (1992). Flow Patterns andTransport of Dissolved Matter in Tidal Harbours,Communications on Hydraulic and Geotechnical<strong>Engineering</strong>, University of Delft.Leeuwen, S. and Hofland, B. (1999). <strong>The</strong> CurrentDeflecting Wall in a Tidal Harbour with DensityInfluences. Final Report in the Framework of theEuropean Community’s Large Scale Installationsand Facilities Programme III, Delft,<strong>The</strong> Netherlands.Mehta, A.J. (1986). Characterization of CohesiveSediment Properties and Transport Processes inEstuaries, Lecture Notes on Coastal EstuarineStudies, Issue 14, Springer Verlag, Berlin,New York.Rohr, F., 1933, Wasser- und Sinkstoff-Bewegungen in Fluss- und Seehäfen,Dissertation, R. Oldenbourg, Munich.Stoschek, O. (2004). Sedimentation undGegenmaßnahmen in tide- und brackwasserbeeinflusstenHäfen: eine Analyse mit Hilfe3-dimensionaler Simulationen, Dissertation,Mitteilungen des Franzius-Instituts, Issue No. 90.Stoschek, O., Geils, J., Matheja, A. andZimmermann, C. (2003). <strong>Dredging</strong> Alternatives –<strong>The</strong> Current Deflection Wall Minimizing <strong>Dredging</strong>Activities in Harbours. CEDA <strong>Dredging</strong> Days,Amsterdam, Netherlands.Vested, H.J., Justensen, P. and Ekebjaerg, L. (1992).Advection dispersion modelling in three dimensions,Appl. Mathematical Modelling, Vol. 16.
Books/Periodicals Review 33BOOKS/PERIODICALS REVIEW<strong>The</strong> Rock Manual: <strong>The</strong> Use of Rock in Hydraulic<strong>Engineering</strong>BY CIRIA, CUR, CETMEFPublished by CIRIA. 2007.ISBN: 0-86017-683-5. 1267 pp. + CD.When you think of <strong>rock</strong>, you think of hard <strong>rock</strong> orsolid <strong>rock</strong>, but in this case also of heavy <strong>rock</strong>. This<strong>manual</strong>, counting 1267 pages, feels like a <strong>rock</strong> andmust weigh a few kilos. So if you are travelling youmay not want to carry it in your luggage. Luckily, inthe front of the hard copy of the book is also a CDwith the whole <strong>manual</strong> in PDF format. However, sincethe resolution of the pictures in the PDF files is notvery high, the CD is suitable as a search tool, but notas a replacement of the book. <strong>The</strong> electronic versioncan also be found on the websites of CIRIA (www.ciria.org, click on Bookshop, or www.ciriabook.com)and CETMEF (www.cetmef.equipement.gouv.fr).Rock is a commonly used construction material in thehydraulic environment. It is used in the marine andfluvial environments to provide protection againstscour and erosion and to limit wave overtopping andflooding. Estimates suggest that at least 10 milliontonnes of armourstone per year are used inconstruction across Europe.In 1991 CIRIA/CUR published the original Manual onthe Use of Rock in Coastal and Shoreline <strong>Engineering</strong>,commonly referred to as “<strong>The</strong> Rock Manual”. Thiswas followed in 1995 by the Manual on the Use ofRock in Hydraulic <strong>Engineering</strong> by CUR. This newedition of “<strong>The</strong> Rock Manual” has been completelyrevised and updated by a joint UK, French and Dutchteam represented by CIRIA, CETMEF and CUR,respectively, and presents current good practice forthe design and construction of <strong>rock</strong> structures forerosion and flood control at coasts and rivers.Where appropriate it presents new or emergingtechnologies that have not, at the time of thewriting, become standard practice, to allow thereader to be fully aware of, and make the best useof, the latest research findings.<strong>The</strong> target audience for the <strong>manual</strong> is wide andincludes planners, developers, engineeringconsultants and designers, architects, buildingmanagers, facility managers, contractors, producersand suppliers, owners, staff from regulators, fundersand educational institutions. <strong>The</strong> guidance is suitablefor worldwide applications with the stated aim ofachieving a long-term improvement in the use of<strong>rock</strong> and will promote conservation of naturalsystems in balance with the proper protection ofhuman life and property. Although the editorssuggest that the reader should have a degree in Civil<strong>Engineering</strong> and at least two years of experience,Mechanical Engineers with an affinity to Civil<strong>Engineering</strong> should be able to understand the<strong>manual</strong> as well.<strong>The</strong> <strong>manual</strong> is a very good enchiridion and isrecommended to all who are involved in the use of<strong>rock</strong> in hydraulic engineering.This book is available from www.ciriabooks.com.S.A. MIEDEMAFACTS ABOUTEnvironmental Impact AssessmentsINTERNATIONAL ASSOCIATION OF DREDGINGCOMPANIESJanuary 2008. 4 pp. Available free of charge.<strong>Dredging</strong> is a complicated matter and nowadaystrying to be an expert in everything is impossible.Yet all kinds of stakeholders come into contact withsome of the technical aspects of dredging and areconfronted with terminology that is not obviouslycomprehensible. FACTS ABOUT EnvironmentalImpact Assessments is the third in an ongoing seriesof leaflets published by the International Associationof <strong>Dredging</strong> Companies (IADC). <strong>The</strong> aim of this newseries of concise, easy-to-read leaflets is to give aneffective overview of essential facts about specificand important dredging and maritime constructionsubjects. Questions such as “What is the differencebetween an EIA, an EIS, an EES and an ES?” and“What is the World Bank definition of an EIA?” areanswered in a succinct and clear manner. For thoseneeding more in-depth or detailed information, areference list of other literature is provided.<strong>The</strong>se publications are part of IADC’s on-going effortto support clients and others in understanding thefundamental principles of dredging and maritimeconstruction – because providing effectiveinformation to all involved parties is an essentialelement in achieving a successful dredging project.All “FACTS ABOUT…” are available in PDF form onthe IADC website: www.iadc-dredging.com. Printedcopies can be ordered by contacting the IADCSecretariat: info@iadc-dredging.com.MC
34 Terra et Aqua | Number 110 | March 2008SEMINARS/ CONFERENCES/ EVENTSCEDA Conference on <strong>Dredging</strong> and ReclamationDOHA, QATARMAY 5-7 2008For the first time, CEDA is organizing an internationalconference in the Middle East. Entitled “<strong>Dredging</strong>and Sustainability: How Wide is the Gulf”, theconference will give a comprehensive overview ofthe latest developments and innovations of thevarious technical issues relevant to dredging andland reclamation works. It will run parallel to Ship &Port + Europort Maritime exhibition organised byAhoy Rotterdam and Al Fajer Dubai, which are takingplace in the brand new Qatar International ExhibitionCentre. <strong>The</strong> Ritz-Carlton Hotel has been appointed asthe conference hotel.<strong>The</strong> conference programme is: May 5, Arrival,opportunity to visit Ship & Port + Europort Maritimeand Icebreaker in the evening. May 6, ConferenceDay 1: all day technical sessions; May 7, ConferenceDay 2: morning, technical sessions, afternoon, a SiteVisit and in the evening a farewell dinner. On May 8a post-conference desert safari will be organised.For further information contact:Anna Csiti, General ManagerCEDA SecretariatTel: + 31 (0)15 268 2575Fax: + 31 (0)15 268 2576E-mail: ceda@dredging.orgWeb: www.dredging.org5th International SedNet ConferenceNORWEGIAN GEOTECHNICAL INSTITUTEOSLO, NORWAYMAY 27-29, 2008Two themes will be dealt with in this conference.On days 1 and 2, Urban Sediment Management andPort Redevelopment will focus on areas oftenhistorically contaminated as as result of industrialactivities, dockyard and harbour operations as wellas discharges of municipal wastewater and urbansurface water run-off.On day 3, Sediment in River Basin ManagementPlans will be dedicated to state-of-the-art sedimentmanagement including major EC projects such asAquaTerra, Modelkey, and RISKBASE. Poster sessionswill be held during all days. <strong>The</strong> conferenceprogramme will be available in December 2007.For further information contact:SedNet Secretariat: www.sednet.orgEmail: marjan.euser@tno.nlConSoil 2008STELLA POLARE CONGRESS CENTRE –FIERA MILANO, MILANO, ITALYJUNE 3-6, 2008<strong>The</strong> 10th ConSoil Conference will continue theprogrammes of the previous ConSoil series.Besides the traditional focus on contamination of soiland groundwater, will again deal with thefunctioning of the soil-water systems. With thismulti-focus, ConSoil 2008 will follow the EU policythat aims at the sound and integrated managementof the soil-water systems in Europe and will thus staythe platform to exchange news and knowledgebetween scientists, policy makers, consultants/serviceproviders, administrators, site owners/river basinmanagers, remediation companies/contractors, andbanking and insurance companies.ConSoil 2008 is supported by the Provincia di Milano(IT), German Ministry of Education and <strong>Research</strong>(BMBF/DE) and the Netherlands Ministry of Housing,Spatial Planning and Environment (VROM/NL).For further information visit the website:http://www.consoil.de/WEDA XXVIII & 39th TAMU SeminarST. LOUIS AIRPORT MARRIOTT HOTELST. LOUIS, MISSOURI, USAJUNE 8-11, 2008WEDA XVIII & Texas A & M’s 39th Annual <strong>Dredging</strong>Seminar with the theme “WHY WE DREDGE”will focus on dredging throughout the WesternHemisphere, its impact on the ever-expanding globaleconomy and areas of the marine environment.<strong>The</strong> theme selected will provide a unique forum forall throughout the Western Hemisphere: <strong>Dredging</strong>contractors, port & harbor authorities, governmentagencies, environmentalists, consultants, civil &marine engineers, surveyors, ship yards, vendors,and academicians to exchange information andknowledge with their professional counterparts whowork in the exciting and challenging fields related todredging. Discussions on “Why we dredge” and theimportance of dredging will be asked and answered.
Seminars/Conferences/Events 35Also asked and answered will be the effect theinability to dredge would have on the worldeconomy and its environment.For further information please contact:Larry Patella, Executive DirectorWestern <strong>Dredging</strong> AssociationPO Box 5795, Vancouver, WA 98668 USATel: +1 360 750 0209Email: WEDA @comcast.net30th International Seminar on <strong>Dredging</strong> andReclamationDELFT, THE NETHERLANDSJUNE 16-20, 2008Aimed at (future) decision makers and their advisorsin governments, port and harbour authorities,offshore companies and other organisations whichare involved with the execution of dredging projects,the International Association of <strong>Dredging</strong> Companies,in co-operation with UNESCO – IHE, organises theInternational Seminar on <strong>Dredging</strong> and Reclamationeach year in Delft.Since 1993 IADC has provided a week-long seminarespecially developed for professionals in dredgingrelatedindustries. <strong>The</strong>se intensive courses are oftenorganised in co-operation with local technicaluniversities and have been successfully presented inDelft, Singapore, Dubai, Buenos Aires, Bahrain andMexico. <strong>The</strong> Seminars reflect IADC’s commitment toeducation, to encouraging young people to enterthe field of dredging, and to improving knowledgeabout dredging throughout the world.This five-day course strives to provide an understandingthrough lectures by experts in the field andworkshops. Some of the subjects covered are:- the development of new ports and maintenanceof existing ports;- project phasing (identification, investigation,feasibility studies, design, construction, andmaintenance);- descriptions of types of dredging equipment andboundary conditions for their use;- state-of-the-art dredging techniques as well asenvironmentally sound techniques;- pre-dredging and soil investigations, designing andestimating from the contractor’s view;- costing of projects and types of contracts such ascharter, unit rates, lump sum and risk-sharingagreements.An important feature of the seminars is a trip on atrailing suction hopper or a cutter suction dredger toa nearby dredging project. A visit to a dredging yardis also included.<strong>The</strong> cost of the seminar will be € 1,350. This feeincludes all tuition, seminar proceedings andworkshops and a special participants dinner duringthe week, but is exclusive of travel costs andaccommodation. If needed, IADC can assist withfinding accommodation.For further information please contact:Mr. Frans-Herman Cammel,cammel@iadc-dredging.com or<strong>The</strong> IADC Secretariat:Tel: + 31 70 352 3334International Symposium on SedimentManagementLILLE, FRANCEJULY 10-12, 2008Over the ages, river estuaries have given economicprosperity to those who live on their embankments.Much of this prosperity is based on the sedimentsbrought by the rivers, which carry with themcontaminants. Even if regulations and a bettercontrol of contaminants have been established toreduce their emission, many contaminants are stillpresent in bottom sediments. In fact, some of themare persistent and continue to pose a risk to theenvironment. Since the contaminated sedimentproblem is extended throughout the world, thissymposium will be international event, reviewingrecent advances on sediments management relatedresearch and focus on engineering aspects including:- Management of dredging operation and storageof sediments.- Treatments and transport of contaminatedsediments.- Ecotoxicological approaches and developments ofbiotests.- Analyses and water treatments.- Beneficial uses of dredged marine and riversediments in civil engineering and in other fields.
36 Terra et Aqua | Number 110 | March 2008Call for papersAll papers and presentations will be in English.Official languages of the symposium are English andFrench, with simultaneous translations providedduring plenary sessions.For further information contact:Karine Kominiarz, Ecole des Mines de DouaiInternational Symposium on Sediment Management941, rue Charles Bourseul, BP 10 838F59508 Douai cedex, FranceTel: +33 3 27 71 30 05, Fax: +33 3 2771 29 16Email: abriak@ensm-douai.frCEDA <strong>Dredging</strong> Days 2008CONFERENCE CENTRE ’T ELZENVELDANTWERP, BELGIUMOCTOBER 1-3, 2008With the title “<strong>Dredging</strong> Facing Sustainability” CEDABelgium intends to raise a wider awareness of thestakeholders to the efforts of the dredging world– contractors, shipyards and consultants – to sustainabledevelopment. Topics include: How to tackle sealevel rise – dredging for coastal flood protection;<strong>Dredging</strong> as a key player in the energy discussion;Creating estuarine wetlands – vital ecosystems forsustainable development; <strong>Dredging</strong> in sensitive areas– balancing between socio-economic developmentand nature conservation – improving technology toachieve “no impact”; Efforts to reduce emissions inthe dredging industry; sustainability concerningdecision process.For further information contact:Technologisch Instituut, Att: Rita PeysDesguinlei 214BE 2018 Antwerpen, BelgiumTel: +32 3 260 0861, Fax: +32 3 216 0689Email: rita.peys@ti.kviv.bewww.dredgingdays.org/2008Hydro8 SymposiumBRITANNIA ADELPHI HOTELLIVERPOOL, UKNOVEMBER 4-6, 2008<strong>The</strong> Hydrographic Society UK, on behalf of theInternational Federation of Hydrographic Societies,is to stage the 16 th International HydrographicSymposium, Hydro8, in Europe’s 2008 Capital ofCulture, Liverpool. To be held at the City’s historicBritannia Adelphi Hotel, the three-day event willfeature a main conference and an exhibition ofequipment and services in addition to a series ofworkshops, equipment demonstrations, midafternoontechnical visits and a social programmehighlighted by a special Symposium Dinner inLiverpool’s celebrated Georgian Town Hall.Conference proceedings will cover a wide range ofcontemporary survey and environmental-relatedissues under the theme, New Opportunities.Scheduled topics include Deep Water TerminalChallenges, Sediment Hydraulics/Dynamics for<strong>Dredging</strong>, ENCs, Tidal Predictions, the EU WaterFramework Directive & Its Hydrographic Implications,Wind Farm Development, and Latest Acoustic &Multibeam System Developments and Applications.Abstracts of not more than 300 words on any ofthese topics and related technical issues are requiredby no later than 31 March.Hydro8, which is expected to attract a worldwidedelegate audience and over 50 major exhibitorcompanies and organisations,For further information about abstract submissionand further general details contact:www.hydro8.org.uk
Membership list IADC 2008Through their regional branches or through representatives, members of IADC operate directly at all locations worldwideAfrica<strong>Dredging</strong> and Reclamation Jan De Nul Ltd., Lagos, Nigeria<strong>Dredging</strong> International Services Nigeria Ltd., Ikoyi Lagos, NigeriaNigerian Westminster <strong>Dredging</strong> and Marine Ltd., Lagos, NigeriaVan Oord Nigeria Ltd., Ikeja-Lagos, Nigeria<strong>Dredging</strong> International - Tunisia Branch, Tunis, TunisiaBoskalis South Africa, Pretoria, South AfricaAsiaFar East <strong>Dredging</strong> (Taiwan) Ltd., Taipei, Taiwan ROCFar East <strong>Dredging</strong> Ltd. Hong Kong, P.R. ChinaVan Oord ACZ Marine Contractors b.v. Hong Kong Branch, Hong Kong, P.R. ChinaVan Oord ACZ Marine Contractors b.v. Shanghai Branch, Shanghai, P.R. ChinaP.T. Boskalis International Indonesia, Jakarta, IndonesiaP.T. Penkonindo LLC, Jakarta, IndonesiaVan Oord India Pte. Ltd., Mumbai, IndiaBoskalis <strong>Dredging</strong> India Pvt Ltd., Mumbai, IndiaVan Oord ACZ India Pte. Ltd., Mumbai, IndiaJan De Nul <strong>Dredging</strong> India Pvt. Ltd., IndiaPenta-Ocean Construction Co. Ltd., Tokyo, JapanToa Corporation, Tokyo, JapanHyundai <strong>Engineering</strong> & Construction Co. Ltd., Seoul, KoreaVan Oord <strong>Dredging</strong> and Marine Contractors b.v. Korea Branch, Busan, Republic of KoreaBallast Ham <strong>Dredging</strong> (Malaysia) Sdn. Bhd., Johor Darul Takzim, MalaysiaTideway DI Sdn. Bhd., Kuala Lumpur, MalaysiaVan Oord (Malaysia) Sdn. Bhd., Selangor, MalaysiaVan Oord <strong>Dredging</strong> and Marine Contractors b.v. Philippines Branch, Manilla, PhilippinesBoskalis International Pte. Ltd., Singapore<strong>Dredging</strong> International Asia Pacific (Pte) Ltd., SingaporeJan De Nul Singapore Pte. Ltd., SingaporeVan Oord <strong>Dredging</strong> and Marine Contractors b.v. Singapore Branch, SingaporeAustraliaBoskalis Australia Pty. Ltd., Sydney, AustraliaDredeco Pty. Ltd., Brisbane, QLD, AustraliaVan Oord Australia Pty. Ltd., Brisbane, QLD, AustraliaWA Shell Sands Pty. Ltd., Perth, AustraliaNZ <strong>Dredging</strong> & General Works Ltd., Maunganui, New ZealandEuropeDEME Building Materials N.V. (DBM), Zwijndrecht, Belgium<strong>Dredging</strong> International N.V., Zwijndrecht, BelgiumInternational Seaport Private Ltd., Zwijndrecht, BelgiumJan De Nul n.v., Hofstede/Aalst, BelgiumN.V. Baggerwerken Decloedt & Zoon, Oostende, BelgiumBoskalis Westminster <strong>Dredging</strong> & Contracting Ltd., CyprusVan Oord Middle East Ltd., Nicosia, CyprusBrewaba Wasserbaugesellschaft Bremen m.b.H., Bremen, GermanyHeinrich Hirdes G.m.b.H., Hamburg, GermanyNordsee Nassbagger - und Tiefbau G.m.b.H., Wilhelmshaven, GermanyTerramare Eesti OU, Tallinn, EstoniaDRACE, Madrid, SpainDravo SA, Madrid, SpainSociedade Española de Dragados S.A., Madrid, SpainTerramare Oy, Helsinki, FinlandAtlantique Dragage S.A., Nanterre, FranceAtlantique Dragage Sarl, Paris, FranceSociété de Dragage International ‘SDI’ S.A., Lambersart, FranceSodranord SARL, Le Blanc - Mesnil Cédex, France<strong>Dredging</strong> International (UK) Ltd., Weybridge, UKJan De Nul (UK) Ltd., Ascot, UKRock Fall Company Ltd., Aberdeen, UKVan Oord UK Ltd., Newbury, UKWestminster <strong>Dredging</strong> Co. Ltd., Fareham, UKIrish <strong>Dredging</strong> Company, Cork, IrelandVan Oord Ireland Ltd., Dublin, IrelandBoskalis Italia, Rome, ItalyDravo SA, Italia, Amelia (TR), ItalySocieta Italiana Dragaggi SpA ‘SIDRA’, Rome, ItalyEuropean <strong>Dredging</strong> Company s.a., Steinfort, LuxembourgTOA (LUX) S.A., Luxembourg, Luxembourg<strong>Dredging</strong> and Maritime Management s.a., Steinfort, LuxembourgBaltic Marine Contractors SIA, Riga, LatviaAannemingsbedrijf L. Paans & Zonen, Gorinchem, NetherlandsBaggermaatschappij Boskalis B.V., Papendrecht, NetherlandsBallast Nedam Baggeren b.v., Rotterdam, NetherlandsBoskalis B.V., Rotterdam, NetherlandsBoskalis International B.V., Papendrecht, NetherlandsBoskalis Offshore b.v., Papendrecht, Netherlands<strong>Dredging</strong> and Contracting Rotterdam b.v., Bergen op Zoom, NetherlandsMijnster zand- en grinthandel b.v., Gorinchem, NetherlandsTideway B.V., Breda, NetherlandsVan Oord ACZ Marine Contractors b.v., Rotterdam, NetherlandsVan Oord Nederland b.v., Gorinchem, NetherlandsVan Oord n.v., Rotterdam, NetherlandsVan Oord Offshore b.v., Gorinchem, NetherlandsWater Injection <strong>Dredging</strong> b.v., Rotterdam, NetherlandsDragapor Dragagens de Portugal S.A., Alcochete, PortugalDravo S.A., Lisbon, PortugalBaggerwerken Decloedt en Zoon N.V., St Petersburg, RussiaBallast Ham <strong>Dredging</strong>, St. Petersburg, RussiaBoskalis Sweden AB, Gothenburg, SwedenMiddle EastBoskalis Westminster M.E. Ltd., Abu Dhabi, U.A.E.Gulf Cobla (Limited Liability Company), Dubai, U.A.E.Jan De Nul <strong>Dredging</strong> Ltd. (Dubai Branch), Dubai, U.A.E.Van Oord Gulf FZE, Dubai, U.A.E.Boskalis Westminster Middle East Ltd., Manama, BahrainBoskalis Westminster (Oman) LLC, Muscat, OmanBoskalis Westminster Middle East, Doha, QatarBoskalis Westminster Al Rushaid Co. Ltd., Al Khobar, Saudi ArabiaHAM Saudi Arabia Company Ltd., Damman, Saudi Arabia<strong>The</strong> AmericasVan Oord Curaçao n.v., Willemstad, CuraçaoCompañía Sud Americana de Dragados S.A., Buenos Aires, ArgentinaVan Oord ACZ Marine Contractors b.v. Argentina Branch, Buenos Aires, ArgentinaBallast Ham <strong>Dredging</strong> do Brazil Ltda., Rio de Janeiro, BrazilDragamex S.A. de C.V., Coatzacoalcos, Mexico<strong>Dredging</strong> International Mexico S.A. de C.V., Veracruz, MexicoMexicana de Dragados S.A. de C.V., Mexico City, MexicoCoastal and Inland Marine Services Inc., Bethania, PanamaStuyvesant <strong>Dredging</strong> Company, Louisiana, U.S.A.Boskalis International Uruguay S.A., Montevideo, UruguayDravensa C.A., Caracas, Venezuela<strong>Dredging</strong> International N.V. - Sucursal Venezuela, Caracas, VenezuelaTerra et Aqua is published quarterly by the IADC, <strong>The</strong> International Association of<strong>Dredging</strong> Companies. <strong>The</strong> journal is available on request to individuals or organisationswith a professional interest in dredging and maritime infrastructure projects includingthe development of ports and waterways, coastal protection, land reclamation,offshore works, environmental remediation and habitat restoration. <strong>The</strong> name Terra etAqua is a registered trademark.© 2008 IADC, <strong>The</strong> NetherlandsAll rights reserved. Electronic storage, reprinting or abstracting of the contents isallowed for non-commercial purposes with permission of the publisher.ISSN 0376-6411Typesetting and printing by Opmeer Drukkerij bv, <strong>The</strong> Hague, <strong>The</strong> Netherlands.
International Association of <strong>Dredging</strong> Companies