LESSON PLAN GRADES 9-12 FOR TEACHERS Lesson Plan: A ...
LESSON PLAN GRADES 9-12 FOR TEACHERS Lesson Plan: A ...
LESSON PLAN GRADES 9-12 FOR TEACHERS Lesson Plan: A ...

Create successful ePaper yourself
Turn your PDF publications into a flip-book with our unique Google optimized e-Paper software.
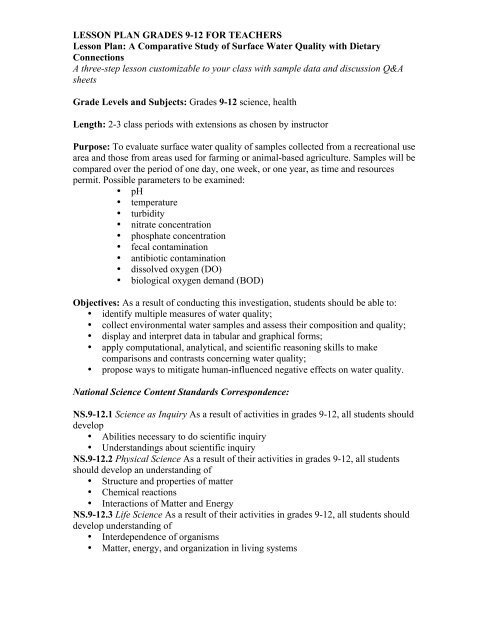
<strong>LESSON</strong> <strong>PLAN</strong> <strong>GRADES</strong> 9-<strong>12</strong> <strong>FOR</strong> <strong>TEACHERS</strong><strong>Lesson</strong> <strong>Plan</strong>: A Comparative Study of Surface Water Quality with DietaryConnectionsA three-step lesson customizable to your class with sample data and discussion Q&AsheetsGrade Levels and Subjects: Grades 9-<strong>12</strong> science, healthLength: 2-3 class periods with extensions as chosen by instructorPurpose: To evaluate surface water quality of samples collected from a recreational usearea and those from areas used for farming or animal-based agriculture. Samples will becompared over the period of one day, one week, or one year, as time and resourcespermit. Possible parameters to be examined:• pH• temperature• turbidity• nitrate concentration• phosphate concentration• fecal contamination• antibiotic contamination• dissolved oxygen (DO)• biological oxygen demand (BOD)Objectives: As a result of conducting this investigation, students should be able to:• identify multiple measures of water quality;• collect environmental water samples and assess their composition and quality;• display and interpret data in tabular and graphical forms;• apply computational, analytical, and scientific reasoning skills to makecomparisons and contrasts concerning water quality;• propose ways to mitigate human-influenced negative effects on water quality.National Science Content Standards Correspondence:NS.9-<strong>12</strong>.1 Science as Inquiry As a result of activities in grades 9-<strong>12</strong>, all students shoulddevelop• Abilities necessary to do scientific inquiry• Understandings about scientific inquiryNS.9-<strong>12</strong>.2 Physical Science As a result of their activities in grades 9-<strong>12</strong>, all studentsshould develop an understanding of• Structure and properties of matter• Chemical reactions• Interactions of Matter and EnergyNS.9-<strong>12</strong>.3 Life Science As a result of their activities in grades 9-<strong>12</strong>, all students shoulddevelop understanding of• Interdependence of organisms• Matter, energy, and organization in living systems
NS.9-<strong>12</strong>.5 Science and Technology As a result of activities in grades 9-<strong>12</strong>, all studentsshould develop• Abilities of technological design• Understandings about science and technologyNS.9-<strong>12</strong>.6 Personal and Social Perspectives As a result of activities in grades 9-<strong>12</strong>, allstudents should develop understanding of• Personal and community health• Population growth• Natural resources• Environmental quality• Natural and human-induced hazards• Science and technology in local, national, and global challenges*Education World (2008) U.S. National Education Standards. Retrieved September 18 th ,2009 http://www.education-world.com/standards/national/index.shtmlMaterials Needed (lab supplies needed only if instructor selects a particular test.Companies which sell the products listed include www.carolina.com;http://las.perkinelmer.com; www.coleparmer.com; www.sci-bay.com; andwww.fishersci.com. There are inexpensive kits to test for some of the parameters listed inthis lesson plan available from www.worldwatermonitoringday.org andwww.lamotte.com/pages/edu/5886.html):• Whiteboard markers, whiteboard, blackboard, or overhead projector• pH paper• thermometersPrior Knowledge and Skills Needed:• Farm run-off and erosion as major sources of surface water pollution• Animal manure, treated or not, discharged into freshwater bodies or spread onfields• Fresh water as a requirement for healthy living and a healthy environment• Reading information from test strips, portable field testing machines, and tables• Making predictions• Collecting data in the field• Arranging data into tabular and graphical formsAssessment:Students will be assessed through these means:• Successful completion of teams’ data collection sheets while in the field• Successful completion of data tables and graphs• Participation in the composition of a written letter to a local government officialVocabulary:• natural resource: an economically valuable, naturally occurring material (e.g.,timber, oil, minerals, water)• water conservation: the preservation and careful management of water• water pollutant: a contaminant of waterbodies that renders them harmful toanimals, plants, and/or humans (e.g., animal manure, motor oil, etc.)• pH: refers to a measurement scale that indicates the acidity or basicity of water;pH = 7 is neutral; less than 7 is acidic and greater than 7 is basic• nitrate: a nitrogen-based nutrient that makes plants grow; often found infertilizer. Too much contributes to eutrophication.
• eutrophication: an increase in nutrients, especially in nitrogen- or phosphoruscontainingcompounds, in a land-based or water-based ecosystem. Usually refersto excessive plant growth and decay.• phosphate: a phosphorus-based nutrient that makes plants grow; often found infertilizer and detergent. Too much contributes to eutrophication.• turbidity: degree to which water is cloudy or unclear; may be due to dissolvedsolids (e.g., manure) or to an abundance of microscopic organisms• fecal contamination: refers to the presence of coliform bacteria from the fecalmatter of animals in water; high values mean water is unsafe for drinking andswimming• dissolved oxygen (DO): the amount of oxygen available in water for fish andother marine animals; low values implies eutrophication (possible algal blooms)and suggests impending death to animals, plants and possibly of the waterbodyitself• biological oxygen demand (BOD): refers to how fast oxygen in water will getused up by aquatic life present in water; a high value means there is a lot oforganic matter (e.g., decaying leaves or manure) present<strong>Lesson</strong> Background:Teachers may look at the United Nations’ 2006 report titled Livestock’s Long Shadowavailable at http://www.fao.org/docrep/010/a0701e/a0701e00.htm Chapter IV deals withwater pollution due to animal agriculture. Both national and global issues are discussed.The major conclusion of this Report is that livestock production is a leading source ofenvironmental damage including climate change; water and air pollution; landdegradation; and loss of biodiversity. The Report suggests that a human diet that is plantbasedwould prevent much of the environmental damage caused by animal agriculture,including the feed crop production associated with it.Please see the section titled Water Facts (below) for tabular information and otherrelevant statistics involving direct and indirect (i.e., through diet) personal water use. TheResources section (below) lists many websites filled with all kinds of supplementalinformation that may be helpful in science fair project development.This lesson runs like a basic course in environmental science. Many tests analyzevariables, such as pH and temperature, that students may be familiar with, but in a newcontext. Teachers may choose the extent of this lesson and suit it to their purposes. It mayserve as an Earth Day or World Water Monitoring Day activity.A lesson plan similar to this one which is accompanied by a document which explainswhat the field results mean can be found at www.chicagoriver.org It contains manyillustrative examples of several key vocabulary terms used here.Procedure:NOTE: Although designed as a one-year investigation, teachers may wish to restrict thestudy to a single day, week, or season. Teachers may also wish to reduce the number ofparameters tested due to time, resource, or facility constraints.
<strong>Lesson</strong> Step #1: Introduction and Topic SettingTeacher introduces the topic by referring to Chapter IV of the United Nations’Livestock’s Long Shadow, http://www.fao.org/docrep/010/a0701e/a0701e00.htmWater pollution facts and figures are given throughout the chapter. Teacher may wish tocopy and put on overhead Table 4.10 that shows ranges of BOD concentrations forvarious livestock wastes; and Table 4.19 which shows statistics on the amount oflivestock contributions of nitrogen and phosphorus to surface waters in the U.S. Teachermay show pictures of polluted waterways, manure piles at livestock farms, etc. Teacherasks students to predict which would be cleaner: a lake at a state park or a stream runningby a hog farm, and why.<strong>Lesson</strong> Step #2: Field Activity: Collecting and Testing Water Samples from Two Sites1. Teams of students research the meanings of the parameters considered in thisstudy; how they are quantified in the field; and how to interpret values:• pH uses inexpensive test paper• temperature uses inexpensive thermometer• turbidity uses an expensive portable machine; see DO and BOD below forinexpensive kit alternatives• nitrate concentration uses an inexpensive test kit; see DO and BOD belowfor inexpensive kit alternatives• phosphate concentration uses an inexpensive test kit; see DO and BODbelow for inexpensive kit alternatives• fecal contamination easy-to-do explanation of method with inexpensivesupplies:http://www.science-projects.com/fecaltest.htm; see DO and BODbelow for inexpensive kit alternatives• antibiotic contamination testing recommended at a local university orprivate company• dissolved oxygen (DO) http://www.worldwatermonitoringday.org offersinexpensive kits for DO and for testing some other parameters included inthis lesson plan• biological oxygen demand (BOD) GREEN Low Cost Water MonitoringKit offered by http://www.lamotte.com/pages/edu/5886.html withinstructions in English and Spanish2. Students present information collected about #1 and present to teacher and class.3. Using maps and other data, teams and teacher decide which locales to designateas study sites. A local state park with a waterbody and freshwater running near afarmland/livestock facility are preferable.4. Dressed appropriately with all necessary equipment, teams and teacher collectwater samples at designated sites on designated days throughout the testingperiod.5. Whether in the field, at school, or at some other appropriate place, studentsconduct sample tests.6. Students test samples and record data.7. Steps 5 and 6 are repeated as specified.8. After all data is collected, students use appropriate software to tabulate and graphdata.
9. Teams determine if patterns exist in the test results in light of major events suchas heavy rains, manure application, effluent discharge, etc., and suggest reasonsfor the patterns. Teams describe any seasonal variation in the data. Teamsdetermine if there are any direct or inverse relationships between two or morevariables. Teams note any patterns seen in the data sets.10. Teams publicly display data and major conclusions. (See http://nces.ed.gov/nceskids/createAgraph/default.aspx, http://www.smartdraw.com/downloads/ orsimilar websites for free downloads of graphing software if you do not haveaccess to similar software at school.)<strong>Lesson</strong> Step #3: Culminating ActivityTeams write to local officials with graphical summaries of their data and analyses.Teams propose ways that local surface water quality may be maintained andimproved. Livestock’s Long Shadow serves as a good starting point for theseproposals.Water Facts:Table 1. Water Consumed during Daily Activities (data taken from EPA websitehttp://www.epa.gov/reg5rcra/wptdiv/p2pages/water.pdf)ActivityWater consumed (gallons)Flush toilet 5-7Run dishwasher 15-25Wash dishes by hand 20Water a small lawn 35Take a shower 25-50Take a bath 50Wash a small load in a washing machine 35Brush teeth with water running 2-5U.S. and Global Daily Water IntakesChapter Four of Livestock’s Long Shadow cites sources that on average, people consume30-300 L of water per day for household uses while 3,000 L of water are used to growtheir daily food.David and Marcia Pimentel, authors of Food, Energy, and Society, 3 rd ed. (2008), citesources that Americans average 400 L water/person/day. They point out that in eightythreeother countries, the average daily water use per person is below 100 L. In the U.S.,daily freshwater withdrawals of surface and groundwater used mainly for irrigation ofcrops for humans and livestock are 5,700 L per person. Worldwide, the average dailyvalue of water for food production is 1,970 L/person.
Table 2. Estimated Amount of Water Used to Produce Crops and Livestock in theU.S. (Liter/kilogram)(Note: One liter is approximately the same as one quart. One kilogram is approximately the same as 2.2lbs.)Food ItemHoekstra &Chapagain(L/kg)Corn 500Wheat 850Soybeans 1,900Rice 1,600Cow’s milk 700Eggs 1,500Beef (feedlot) 13,000Pork 3,900Poultry 2,400Note: Values taken from Chapagain A, Hoekstra A (2004) Water Footprints of Nations Volume One: MainReport. Value of Water Research Report Series No.16. Delft (The Netherlands): UNESCO – IHE Institutefor Water Education. http://www.waterfootprint.org/Reports/Report16Vol1.pdfTable 3. Water Used to Produce Some Common Items(Note: One liter (approximately one quart) equals 1,000 milliliters (ml). One pound equals 454 g.)Food ItemWater Needed for Production (L)1 cup of coffee (<strong>12</strong>5 ml) 1401 glass of milk (200 ml) 2001 slice of bread (30g) 401 slice of bread (30g) with cheese (10g) 901 potato (100 g) 251 bag of potato chips (200g) 1851 apple (100 g) 701 tomato (70 g) 131 glass of apple juice (200 ml) 1901 egg (40 g) 1351 hamburger (150 g) 2400Dry pasta (made in Italy;1 kg)* 1900Cheese pizza (made in Italy; 725 g)* <strong>12</strong>00 (or 248 L per 150 g = ~1/4 pizza)Tomato pizza (made in Italy; 600 g)* 300 (or 75 L per 150 g = ~1/4 pizza)Note:Values taken from Chapagain A, Hoekstra A (2004) Water Footprints of Nations Volume One: MainReport. Value of Water Research Report Series No.16. Delft (The Netherlands): UNESCO – IHE Institutefor Water Education. http://www.waterfootprint.org/Reports/Report16Vol1.pdfAsterisked values taken from Aldaya M, Hoekstra A. (2009) The Water Needed to Have Italians Eat Pastaand Pizza. Value of Water Research Report Series No.36. Delft (The Netherlands): UNESCO – IHEInstitute for Water Education. http://www.waterfootprint.org/Reports/Report36-WaterFootprint-Pasta-Pizza.pdf
RESOURCES:1. Educational materials, teacher’s guides, lesson plans and student pageshttp://www.earthday.netThere are several categories of well-developed environmental lesson plans for all gradelevels. Topics include climate, sustainability, and organics and food. Site has anenvironmental jeopardy game that students will enjoy.http://www.ec.gc.ca/water/en/info/pubs/lntwfg/e_contnt.htmEnvironment Canada, analogous to the EPA of the U.S., has a thorough unit study onwater that ranges across the curriculum, complete with activities and assessments of alltypes.http://eelink.net/pages/<strong>Lesson</strong>+<strong>Plan</strong>sThe North American Association for Environmental Education (NAAEE) has a multitudeof lesson plans, teacher guides, and student resources at its site.http://www.epa.gov/kids/This site is written to appeal to children of all ages. There are many interactive featuresand many downloadable resources. With art, game, and science rooms, as well as pagesdevoted to environmental issues of all types, this site could make a good supplementalresource or lesson enhancement.http://www.footprintnetwork.orgProvides an interactive quiz that students will enjoy to calculate the ecological footprintof cities, businesses, and individuals.http://kids.niehs.nih.gov/National Institute of Environmental Health Sciences (NIEHS) has an enormous websitefilled with useful resources for teachers and students in all grade levels. Certain pages arewritten at a child’s level and cover many different topics related to environmental health.http://www.unep.org/tunza/children/The United Nations Environment Programme has a website just for young people of allages. There are story time videos created by UNEP, youth environmental action updates,competitions, and events among many other pages.http://www.unesco.org/water/wwap/The World Water Assessment Programme, a division of UNESCO, provides facts andfigures on global water issues. The organization publishes many documents, includingthe United Nations World Water Development Reports, which serve as good referencesfor educators in many subject areas and excellent source information for student projects.http://www.waterfootprint.org/?page=files/WaterFootprintCalculatorQuick and extended individual water footprint calculators are available on this website.The publications page of UNESCO-IHE’s Institute for Water Education contains manyreports and articles of interest.
2. Water non-profit organizationsThese groups offer many fundraising ideas and opportunities for a socially-motivatedstudent, class, or school.http://www.charitywater.org/http://www.cleanwateraction.org/http://www.ryanswell.ca/First grader Ryan Hreljac was inspired by a classroom lesson about children who don’thave clean water around the world and began raising money to provide it. Over ten yearslater, his Ryan’s Well Foundation is still very active. At this site, children and youth canlearn about fundraising projects and ways to get involved so that everyone in the worldcan have clean water.http://thewaterproject.orghttp://www.waterforpeople.org
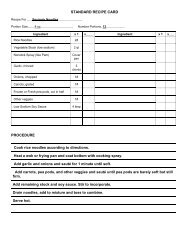
A Comparative Study of Surface WaterQuality with Dietary ConnectionsSample Data Collection Sheet <strong>GRADES</strong> 9-<strong>12</strong>Name ____________________________________________ Date ________________Team ____________________________Site Tested ___________________________________Parameter Tested _______________________________Date, Time Reading Comments
A Comparative Study of Surface WaterQuality with Dietary ConnectionsDiscussion Question Sheet <strong>GRADES</strong> 9-<strong>12</strong>Name ____________________________________________ Date ________________Team ____________________________Directions: Research, reflect upon, and discuss the followingquestions with your team members. Be prepared to includethis information in your letter to local officials.1. How clean are the recreational and livestock/farmland areas sampled in yourstudy? Be specific for each parameter tested. Note any extenuating circumstancesthat may have skewed results to differ from your predictions. Discuss limits ofaccuracy and precision and any sources of error.________________________________________________________________________________________________________________________________________________________________________________________________________________________________________________________________________________________________________________________________________________________________________________________________________________________________________________________________________________________________________________________________________________________________________________________________________________________________________________________________________________________________________________________________________________________________________________________________________________________________
2. Considering your results and the information presented in Tables 1-3 from thislesson and those in Chapter IV of Livestock’s Long Shadow, what connections existbetween dietary preference, water pollution, and water usage?________________________________________________________________________________________________________________________________________________________________________________________________________________________________________________________________________________________________________________________________________________________________________________________________________________________________________________________________________________________________________________________________________________________________________________________________________________________
Possible answers to discussion questions:1. Answers may vary. Assuming the state park waterbody has not experienced run-offfrom local farms or livestock facilities, expected results should be in the normal range forall parameters tested. The pH should be close to 7; turbidity, and concentrations of nitrateand phosphate should be low. Coliform bacteria and antibiotic levels should be negligibleor non-existent. Close to a farm, pH may be higher or lower depending on if a limestonebed is present, if acid rain is prevalent, etc. Turbidity should be higher. Some coliformbacteria and antibiotics may be detectable. Nitrates and phosphates should be higher. DOshould be lower and BOD should be higher than state park waters in most cases. Recentmanure applications and heavy rains should exacerbate levels, possibly in both the parkand near the farm, making DO lower; and [nitrate], [phosphate], [antibiotic], and BODhigher.Possible limits to the reliability of results include: inaccurate and/or imprecisemeasurement tools; inexact readings (human error); and slight differences in samplinglocation and time.2. Tables 1-3 show how much more water is used to produce livestock products includingmeat, milk, and eggs than is to produce foods typical in vegetarian and vegan diets suchas grains, legumes, vegetables, and fruits. Compounding the problem of significantlygreater water use is the larger amount of freshwater pollution contributed by livestock astables in Chapter IV of Livestock’s Long Shadow.