Annual Report 2012 - APG|SGA
Annual Report 2012 - APG|SGA
Annual Report 2012 - APG|SGA

Create successful ePaper yourself
Turn your PDF publications into a flip-book with our unique Google optimized e-Paper software.
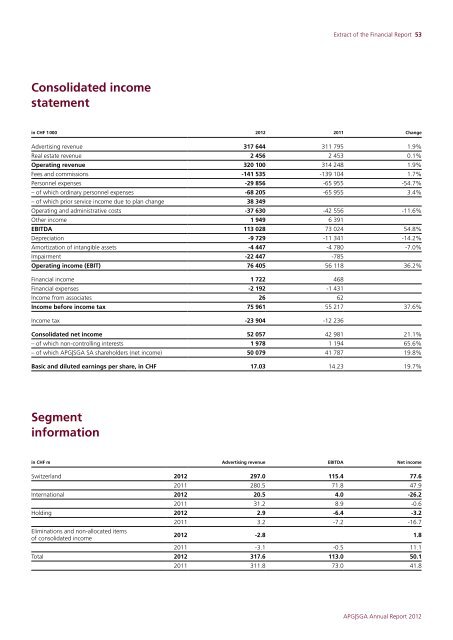
Extract of the Financial <strong>Report</strong> 53Consolidated incomestatementin CHF 1000 <strong>2012</strong> 2011 ChangeAdvertising revenue 317 644 311 795 1.9%Real estate revenue 2456 2453 0.1%Operating revenue 320 100 314 248 1.9%Fees and commissions -141 535 -139 104 1.7%Personnel expenses -29 856 -65 955 -54.7%–ofwhich ordinary personnel expenses -68 205 -65 955 3.4%–ofwhich prior service income due to plan change 38 349Operating and administrative costs -37 630 -42 556 -11.6%Other income 1949 6391EBITDA 113 028 73 024 54.8%Depreciation -9 729 -11 341 -14.2%Amortization of intangible assets -4 447 -4 780 -7.0%Impairment -22 447 -785Operating income (EBIT) 76 405 56 118 36.2%Financial income 1722 468Financial expenses -2 192 -1 431Income from associates 26 62Income before income tax 75 961 55 217 37.6%Income tax -23 904 -12 236Consolidated net income 52 057 42 981 21.1%–ofwhich non-controlling interests 1978 1194 65.6%–ofwhich <strong>APG|SGA</strong> SA shareholders (net income) 50 079 41 787 19.8%Basic and diluted earnings per share, in CHF 17.03 14.23 19.7%Segmentinformationin CHF m Advertising revenue EBITDA Net incomeSwitzerland <strong>2012</strong> 297.0 115.4 77.62011 280.5 71.8 47.9International <strong>2012</strong> 20.5 4.0 -26.22011 31.2 8.9 -0.6Holding <strong>2012</strong> 2.9 -6.4 -3.2Eliminations and non-allocated itemsof consolidated income2011 3.2 -7.2 -16.7<strong>2012</strong> -2.8 1.82011 -3.1 -0.5 11.1Total <strong>2012</strong> 317.6 113.0 50.12011 311.8 73.0 41.8<strong>APG|SGA</strong> <strong>Annual</strong> <strong>Report</strong> <strong>2012</strong>