Annual Report 2012 - APG|SGA
Annual Report 2012 - APG|SGA
Annual Report 2012 - APG|SGA

You also want an ePaper? Increase the reach of your titles
YUMPU automatically turns print PDFs into web optimized ePapers that Google loves.
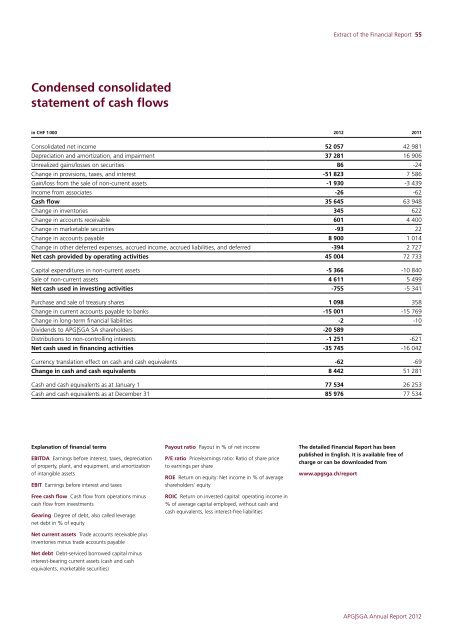
Extract of the Financial <strong>Report</strong> 55Condensed consolidatedstatement of cash flowsin CHF 1000 <strong>2012</strong> 2011Consolidated net income 52 057 42 981Depreciation and amortization, and impairment 37 281 16 906Unrealized gains/losses on securities 86 -24Change in provisions, taxes, and interest -51 823 7586Gain/loss from the sale of non-current assets -1 930 -3 439Income from associates -26 -62Cash flow 35 645 63 948Change in inventories 345 622Change in accounts receivable 601 4400Change in marketable securities -93 22Change in accounts payable 8900 1014Change in other deferred expenses, accrued income, accrued liabilities, and deferred -394 2727Net cash provided by operating activities 45 004 72 733Capital expenditures in non-current assets -5 366 -10 840Sale of non-current assets 4611 5499Net cash used in investing activities -755 -5 341Purchase and sale of treasury shares 1098 358Change in current accounts payable to banks -15 001 -15 769Change in long-term financial liabilities -2 -10Dividends to <strong>APG|SGA</strong> SA shareholders -20 589Distributions to non-controlling interests -1 251 -621Net cash used in financing activities -35 745 -16 042Currency translation effect on cash and cash equivalents -62 -69Change in cash and cash equivalents 8442 51 281Cash and cash equivalents as at January 1 77 534 26 253Cash and cash equivalents as at December 31 85 976 77 534Explanation of financial termsEBITDA Earnings before interest, taxes, depreciationof property, plant, and equipment, and amortizationof intangible assetsEBIT Earnings before interest and taxesFree cash flow Cash flow from operations minuscash flow from investmentsGearing Degree of debt, also called leverage:net debt in %ofequityNet current assets Trade accounts receivable plusinventories minus trade accounts payableNet debt Debt-serviced borrowed capital minusinterest-bearing current assets (cash and cashequivalents, marketable securities)Payout ratio Payout in %ofnet incomeP/E ratio Price/earnings ratio: Ratio of share priceto earnings per shareROE Return onequity: Net income in %ofaverageshareholders’ equityROIC Return oninvested capital: operating income in%ofaverage capital employed, without cash andcash equivalents, less interest-free liabilitiesThe detailed Financial <strong>Report</strong> has beenpublished in English. It is available free ofcharge or can be downloaded fromwww.apgsga.ch/report<strong>APG|SGA</strong> <strong>Annual</strong> <strong>Report</strong> <strong>2012</strong>