Professional Graphics with SAS/GRAPH(r) - NESUG
Professional Graphics with SAS/GRAPH(r) - NESUG
Professional Graphics with SAS/GRAPH(r) - NESUG

You also want an ePaper? Increase the reach of your titles
YUMPU automatically turns print PDFs into web optimized ePapers that Google loves.
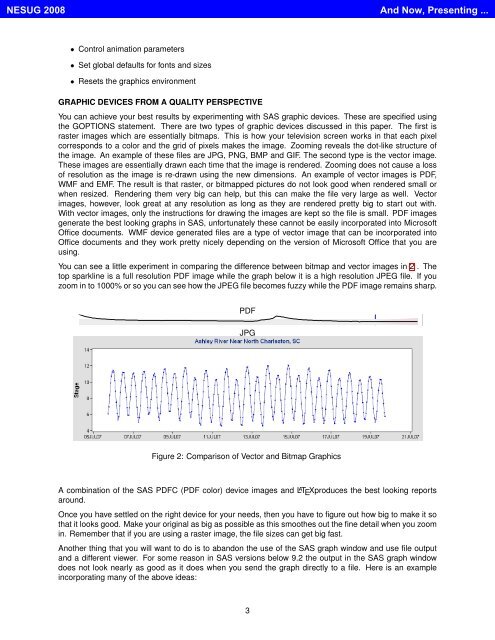
<strong>NESUG</strong> 2008And Now, Presenting ...• Control animation parameters• Set global defaults for fonts and sizes• Resets the graphics environment<strong>GRAPH</strong>IC DEVICES FROM A QUALITY PERSPECTIVEYou can achieve your best results by experimenting <strong>with</strong> <strong>SAS</strong> graphic devices. These are specified usingthe GOPTIONS statement. There are two types of graphic devices discussed in this paper. The first israster images which are essentially bitmaps. This is how your television screen works in that each pixelcorresponds to a color and the grid of pixels makes the image. Zooming reveals the dot-like structure ofthe image. An example of these files are JPG, PNG, BMP and GIF. The second type is the vector image.These images are essentially drawn each time that the image is rendered. Zooming does not cause a lossof resolution as the image is re-drawn using the new dimensions. An example of vector images is PDF,WMF and EMF. The result is that raster, or bitmapped pictures do not look good when rendered small orwhen resized. Rendering them very big can help, but this can make the file very large as well. Vectorimages, however, look great at any resolution as long as they are rendered pretty big to start out <strong>with</strong>.With vector images, only the instructions for drawing the images are kept so the file is small. PDF imagesgenerate the best looking graphs in <strong>SAS</strong>, unfortunately these cannot be easily incorporated into MicrosoftOffice documents. WMF device generated files are a type of vector image that can be incorporated intoOffice documents and they work pretty nicely depending on the version of Microsoft Office that you areusing.You can see a little experiment in comparing the difference between bitmap and vector images in 2 . Thetop sparkline is a full resolution PDF image while the graph below it is a high resolution JPEG file. If youzoom in to 1000% or so you can see how the JPEG file becomes fuzzy while the PDF image remains sharp.PDFJPGFigure 2: Comparison of Vector and Bitmap <strong>Graphics</strong>A combination of the <strong>SAS</strong> PDFC (PDF color) device images and L A T E Xproduces the best looking reportsaround.Once you have settled on the right device for your needs, then you have to figure out how big to make it sothat it looks good. Make your original as big as possible as this smoothes out the fine detail when you zoomin. Remember that if you are using a raster image, the file sizes can get big fast.Another thing that you will want to do is to abandon the use of the <strong>SAS</strong> graph window and use file outputand a different viewer. For some reason in <strong>SAS</strong> versions below 9.2 the output in the <strong>SAS</strong> graph windowdoes not look nearly as good as it does when you send the graph directly to a file. Here is an exampleincorporating many of the above ideas:3