Annual Report 1999 - Fiskarsgroup.com
Annual Report 1999 - Fiskarsgroup.com
Annual Report 1999 - Fiskarsgroup.com
- No tags were found...

You also want an ePaper? Increase the reach of your titles
YUMPU automatically turns print PDFs into web optimized ePapers that Google loves.
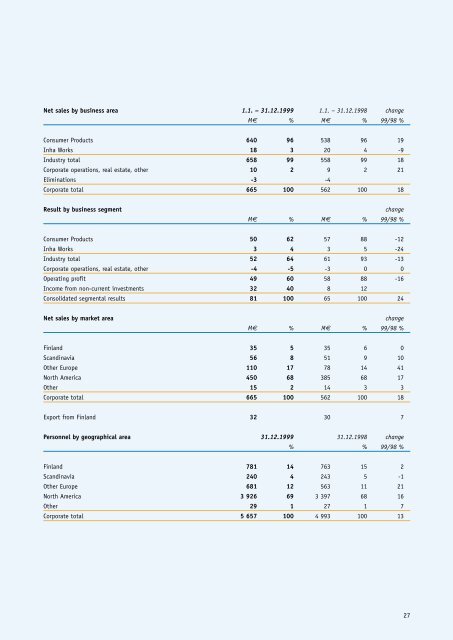
Net sales by business area 1.1. – 31.12.<strong>1999</strong> 1.1. – 31.12.1998 changeM€ % M€ % 99/98 %Consumer Products 640 96 538 96 19Inha Works 18 3 20 4 -9Industry total 658 99 558 99 18Corporate operations, real estate, other 10 2 9 2 21Eliminations -3 -4Corporate total 665 100 562 100 18Result by business segmentchangeM€ % M€ % 99/98 %Consumer Products 50 62 57 88 -12Inha Works 3 4 3 5 -24Industry total 52 64 61 93 -13Corporate operations, real estate, other -4 -5 -3 0 0Operating profit 49 60 58 88 -16In<strong>com</strong>e from non-current investments 32 40 8 12Consolidated segmental results 81 100 65 100 24Net sales by market areachangeM€ % M€ % 99/98 %Finland 35 5 35 6 0Scandinavia 56 8 51 9 10Other Europe 110 17 78 14 41North America 450 68 385 68 17Other 15 2 14 3 3Corporate total 665 100 562 100 18Export from Finland 32 30 7Personnel by geographical area 31.12.<strong>1999</strong> 31.12.1998 change% % 99/98 %Finland 781 14 763 15 2Scandinavia 240 4 243 5 -1Other Europe 681 12 563 11 21North America 3 926 69 3 397 68 16Other 29 1 27 1 7Corporate total 5 657 100 4 993 100 1327