Roadside Truck Survey 2013 - City of Edmonton
Roadside Truck Survey 2013 - City of Edmonton
Roadside Truck Survey 2013 - City of Edmonton

You also want an ePaper? Increase the reach of your titles
YUMPU automatically turns print PDFs into web optimized ePapers that Google loves.
THE WAY WE MOVEROADSIDETRUCKSURVEYFINAL REPORTFEBRUARY <strong>2013</strong>
Executive SummaryIn September and October 2012, the <strong>City</strong> <strong>of</strong> <strong>Edmonton</strong> conducted a roadside truck survey. Thesurvey was conducted by Transportation Services in cooperation with <strong>Edmonton</strong> Police Servicewith an aim to better understand the movement <strong>of</strong> goods in <strong>Edmonton</strong> and provide input to the<strong>Edmonton</strong> Goods Movement Strategy. Drivers <strong>of</strong> trucks with a gross vehicle weight <strong>of</strong> 4,500 kgor more were asked to enter a safe waiting area where they were voluntarily interviewed bysurvey staff regarding:• Trip origins and destinations• Routes taken while travelling in the city and the regional highways• Commodities carried• Experiences while travelling on the <strong>Edmonton</strong> transportation networkIn total, 2,294 surveys were completed over 14 days. Major findings are:• Within the city, the largest movement <strong>of</strong> trucks is between the Northwest and Southeastquadrants – consistent with results <strong>of</strong> the 1996 <strong>Truck</strong> Study and the 2001 Commodity Flow<strong>Survey</strong>.• 74% <strong>of</strong> trucks began and ended their day at the same location, their ‘home-base’ - a trippattern that is consistent with the results from the 2001 Commodity Flow <strong>Survey</strong>.• Between the region and the city, the highest volume <strong>of</strong> movement occurred between theEast, West and South Regions; previous studies have found similar trends although the Westand East Regions have become more important as generators <strong>of</strong> trips to and from the city.• Yellowhead Trail is the most used facility with 67% <strong>of</strong> truck drivers indicating using theroadway and 60% using Anthony Henday Drive.• 60% <strong>of</strong> trucks using Yellowhead Trail and Anthony Henday Drive had as part <strong>of</strong> their trip anorigin or a destination in the <strong>City</strong> <strong>of</strong> <strong>Edmonton</strong> while nearly a quarter <strong>of</strong> all trucks using <strong>of</strong>Yellowhead Trail and Anthony Henday Drive had an origin or destination in the region.• 81% <strong>of</strong> truck drivers surveyed indicated they chose their routes because they were the mostdirect.• <strong>Edmonton</strong>’s roads are important to the oil, gas and construction industries – 54% <strong>of</strong> truckscarry materials such as chemicals, fuel petroleum and construction materials.• <strong>Truck</strong> drivers reported a high level <strong>of</strong> overall satisfaction (62%) with <strong>Edmonton</strong>’s truckroutes and roadways - much higher than other jurisdictions in Canada and the United States.• Most frequent suggestions from truck drivers about the roadway network includedimprovements to pavement condition, opening 75 Street to trucks and improvements tosignage and truck route information.
Table <strong>of</strong> Contents1. Introduction ............................................................................................................ 12. Background ............................................................................................................. 12.1 1996 <strong>Truck</strong> Route Study...................................................................................... 12.2 2001 Commodity Flow Study.............................................................................. 22.3 Where We Are Today.......................................................................................... 22.3.1 Transportation Industry Trends.................................................................. 22.3.2 <strong>Truck</strong> Volume Trends .................................................................................. 32.3.3 Direction from <strong>City</strong> Council................................................................................ 33. 2012 <strong>Edmonton</strong> <strong>Roadside</strong> <strong>Truck</strong> <strong>Survey</strong>................................................................. 53.1 Purpose and Methodology ................................................................................. 53.2 Study Area and Timeframes................................................................................ 53.3 Consultation and Communication ...................................................................... 74. <strong>Survey</strong> Results......................................................................................................... 84.1 Scaling the <strong>Survey</strong> Sample Results...................................................................... 84.2 Vehicle Characteristics........................................................................................ 84.2.1 <strong>Truck</strong> Types ........................................................................................................ 94.2.2 Vehicle Weight................................................................................................. 114.2.3 Vehicle Ownership ........................................................................................... 114.3 Trip Characteristics ........................................................................................... 124.3.1 Trip Origins and Destinations........................................................................... 124.3.2 Inner Ring Road and Anthony Henday............................................................. 154.3.3 Route Choice.................................................................................................... 164.3.4 Provincial Highways ......................................................................................... 174.3.5 Connections to Airports................................................................................... 174.4 Load Characteristics.......................................................................................... 184.4.1 Load Efficiency and Diversity ........................................................................... 184.4.2 Goods Pr<strong>of</strong>ile.................................................................................................... 194.4.3 Dangerous Goods............................................................................................. 204.5 Driver Satisfaction............................................................................................. 215.0 Discussion <strong>of</strong> Findings........................................................................................... 225.1 Driver Comments.................................................................................................... 225.2 Key Goods Movement Corridors ............................................................................ 245.2.1 Importance <strong>of</strong> Yellowhead Trail & Anthony Henday Drive ...................... 246.0 Conclusions ........................................................................................................... 256.1 Key Findings ............................................................................................................ 256.2 Next Steps ............................................................................................................... 26References ........................................................................................................................ 27Acknowledgements........................................................................................................... 28Appendix A. <strong>Edmonton</strong> <strong>Roadside</strong> <strong>Truck</strong> <strong>Survey</strong> Locations ··············································29Appendix B. Sample <strong>Survey</strong> ·····························································································30Appendix C. Map <strong>of</strong> Anthony Henday Drive···································································32i
List <strong>of</strong> FiguresFigure 1 - <strong>Roadside</strong> <strong>Truck</strong> <strong>Survey</strong> Locations ....................................................................... 6Figure 2 - Sample <strong>of</strong> <strong>Truck</strong> Types <strong>Survey</strong>ed ........................................................................ 9Figure 3 - Sample <strong>of</strong> <strong>Truck</strong> Types Not <strong>Survey</strong>ed ............................................................... 10Figure 4 – <strong>Truck</strong> Types on <strong>Edmonton</strong> Road ...................................................................... 10Figure 5 - Distribution <strong>of</strong> <strong>Truck</strong> Gross Vehicle Weight...................................................... 11Figure 6 - Vehicle Ownership............................................................................................ 11Figure 7 - Daily Origins and Destinations at Start and End <strong>of</strong> Day (All <strong>Truck</strong>s)................. 13Figure 8 - Daily <strong>Truck</strong> Trip Patterns................................................................................... 14Figure 9 - Percentages <strong>of</strong> All <strong>Truck</strong>s Using Inner Ring Road Corridors ............................. 15Figure 10 - Route Choice Rationale Distribution .............................................................. 16Figure 11 - Percentages <strong>of</strong> <strong>Truck</strong>s Using Provincial Highways.......................................... 17Figure 12 - Load Efficiency ................................................................................................ 18Figure 13 - Commodities Carried by <strong>Truck</strong>s...................................................................... 19Figure 14 - Types <strong>of</strong> Dangerous Goods Carried ................................................................ 20Figure 15 - Driver Satisfaction........................................................................................... 21Figure 16 - Word Cloud <strong>of</strong> Driver Comment Themes ....................................................... 22Figure 17 - Most Used Roadway Facilities by <strong>Truck</strong>s........................................................ 24ii
1. IntroductionThe Way We Move, <strong>Edmonton</strong>’s Transportation Master Plan, identifies the <strong>City</strong>’s commitment tosupport safe, efficient and effective goods movement in order to support economicdevelopment and the competitiveness <strong>of</strong> businesses within the Capital Region. Thetransportation <strong>of</strong> commodities throughout the city is largely carried out by trucks and is criticalfor an efficient and productive economy.The purpose <strong>of</strong> this report is to present the results <strong>of</strong> the <strong>City</strong> <strong>of</strong> <strong>Edmonton</strong> <strong>Roadside</strong> <strong>Truck</strong><strong>Survey</strong> which is a component in the development <strong>of</strong> the <strong>Edmonton</strong> Goods Movement Strategy.2. Background<strong>Edmonton</strong> plays an important role in Alberta’s economy and has undergone significant growthover the past decade. The city’s transportation and warehousing sector is a major contributor tothis growth and that is expected to continue into the future. In keeping with this growth, majortransportation infrastructure developments have occurred including large investments by theProvince <strong>of</strong> Alberta in <strong>Edmonton</strong>’s Anthony Henday Drive ring road, scheduled for completion in2016.Two key studies were conducted over the past two decades in order to gain a betterunderstanding <strong>of</strong> the impacts, characteristics and requirements for efficient goods movement in<strong>Edmonton</strong>: the 1996 <strong>Truck</strong> Route Study and the 2001 Commodity Flow Study. However, growthand infrastructure developments over the past decade have necessitated an update to thesestudies. In April 2012, <strong>Edmonton</strong> <strong>City</strong> Council passed a motion to review and update theunderstanding <strong>of</strong> goods movement within <strong>Edmonton</strong> and the region. The 2012 <strong>City</strong> <strong>of</strong> <strong>Edmonton</strong><strong>Roadside</strong> <strong>Truck</strong> <strong>Survey</strong> is one component that will help to advance the understanding <strong>of</strong> goodsmovement and will inform a larger Goods Movement Strategy.2.1 1996 <strong>Truck</strong> Route StudyIn 1995, in preparation for the development <strong>of</strong> the <strong>City</strong> <strong>of</strong> <strong>Edmonton</strong> Transportation MasterPlan (TMP), the <strong>City</strong> commissioned a study <strong>of</strong> the truck route system as a technical component<strong>of</strong> the TMP process. The intent <strong>of</strong> the study was to identify a means <strong>of</strong> resolving and minimizingcurrent problems associated with the truck route system at the time, “including regulationspertaining to restrictions by time, by types <strong>of</strong> goods and by vehicle weight, and establishingcriteria to assist in the rationalization <strong>of</strong> future truck route system changes” 1 .The data collection phase <strong>of</strong> the project included a literature review, a review <strong>of</strong> the <strong>City</strong>’sprevious truck route changes, a public involvement component and a detailed survey <strong>of</strong> truckingactivity.Key findings <strong>of</strong> the 1996 <strong>City</strong> <strong>of</strong> <strong>Edmonton</strong> <strong>Truck</strong> Route Study included:1 Morrison Hershfield, <strong>City</strong> <strong>of</strong> <strong>Edmonton</strong> <strong>Truck</strong> Route Study, 19961
• <strong>Truck</strong>s are estimated to make 145,000 trips travelling over 2.16 million km on a daily basis• The heaviest concentration <strong>of</strong> truck travel occurred internally between the northwest andsoutheast sectors <strong>of</strong> the city due to the industrial nature <strong>of</strong> these areas• Most trucks serviced local regional needs, whereas few (1-2%) were destined to, ororiginated from, outside the region2.2 2001 Commodity Flow StudyDuring 2001 and 2002, the <strong>City</strong> <strong>of</strong> <strong>Edmonton</strong> and Alberta Transportation undertook a study <strong>of</strong>truck and commodity movements in both the city and the region 2 . There were two componentsto the study: a commodity flow survey and an <strong>Edmonton</strong> region roadside survey. The studyprovided the data needed to “assist in the assessment <strong>of</strong> regional transportation needs, and inparticular truck and service vehicle needs, and to include these needs in the development <strong>of</strong>short-term and long-term transportation plans.” 3Key findings <strong>of</strong> the 2001 Commodity Flow <strong>Survey</strong> included:• 3.16 million vehicle-kilometers or 11% <strong>of</strong> all vehicle-kilometers travelled on a daily basis arefor the delivery <strong>of</strong> goods and services (compared to 2.16 million vehicle-kilometres in 1995)• The majority <strong>of</strong> daily truck trips originate in the southeast and northwest suburbs <strong>of</strong> the city(a similar trend was identified in the 1996 study)• The highest number <strong>of</strong> vehicle trips occurring between the SE Suburb-NW Suburb, the SESurburb-SE Inner and the NW Suburb-NE Inner zones• The highest regional truck trips took place between <strong>Edmonton</strong>-Leduc and SpruceGrove/Stony Plain-<strong>Edmonton</strong>2.3 Where We Are Today2.3.1 Transportation Industry TrendsIn Alberta, the transportation and logistics industry is an important aspect <strong>of</strong> the competitiveadvantage <strong>of</strong> the province. According to the Government <strong>of</strong> Alberta, trucks are “moving over60% <strong>of</strong> all freight within the province” and are responsible for “about $7 billion or 29% <strong>of</strong>Alberta’s non-pipeline international exports.” 4 In addition, the transportation and warehousingsector contributes $10.2 billion annually to the Alberta economy and employs more than 98,000people. 5 As Alberta’s economy grows it has a direct impact on transportation and logistics.Between 1991 and 2011, Alberta’s gross domestic product (GDP) grew at an average annual rate2 International Results Group, Commodity Flow <strong>Survey</strong>, 20023 <strong>Edmonton</strong> Region Commodity Flow Study Project Report, November 20034 Transportation and international logistics - Industry Sector Pr<strong>of</strong>ile. Alberta Enterprise and Advanced Education, Government <strong>of</strong>Alberta. http://albertacanada.com/business/industries/transportation-and-logistics.aspx5 ibid.2
<strong>of</strong> 3.4% 6 while over the past 10 years alone, the registration <strong>of</strong> heavy trucks in the provinceincreased by 46%. 7Over the past 10 years, trends in GDP growth in the <strong>Edmonton</strong> census metropolitan area (CMA)have followed those <strong>of</strong> the province. In the <strong>Edmonton</strong> CMA, the overall GDP grew by 43% whileGDP growth in the transportation and warehousing sector grew by 39% during that period 8 .In terms <strong>of</strong> employment, the transportation and warehousing sector grew by a marked 12%between 2011 and 2012 9 . Employment growth in this sector in the coming 10 years isforecasted to be much more modest at between 1% to 2% per year 10 . However, GDP growth inthe transportation and warehousing sector is expected to continue to grow steady at an annualrate <strong>of</strong> 3%, amounting to an overall increase in the sector <strong>of</strong> 32% over the next ten years 11 .2.3.2 <strong>Truck</strong> Volume TrendsOne-day truck volume counts have been collected annually at various locations around the citysince 2004. Some data collection units are set up around the city such that they can effectivelyprovide a cordon count between the city and the region. From these units we are able to gain anidea about the volume <strong>of</strong> trucks travelling between the city and the region on a given day. Datacollected between 2004 and 2012 indicates that city-region truck travel is increasing withvolumes between the city and the West Region nearly doubling. Data collected from a unit onCalgary Trail south <strong>of</strong> Ellerslie Road show truck volumes entering and leaving from the SouthRegion increased by over 75% in the 8-year period. According to the counts, city-region trucktravel has increased by nearly 40% between 2004 and 2012. This data is representative <strong>of</strong> theinteraction between the city and the immediate surrounding region as well as the city and areasoutside <strong>of</strong> the region.<strong>Truck</strong> travel on the Inner Ring Road is also captured and provides a view into the travel internalto the city. According to truck volumes collected between 2004 and 2012 on these facilities,volumes have remained effectively unchanged. Volumes collected from Anthony Henday Drivehowever have shown a three-fold increase in the same time period indicating that some <strong>of</strong> thegrowth in truck travel demand is being absorbed by Anthony Henday Drive.2.3.3 Direction from <strong>City</strong> CouncilIn April 2012, at a meeting <strong>of</strong> the Transportation and Infrastructure Committee <strong>of</strong> <strong>Edmonton</strong>’s<strong>City</strong> Council, a number <strong>of</strong> questions were raised by councilors in relation to goods movement.They expressed the need for a better understanding <strong>of</strong> truck movements in the city, in particularwith regards to volumes, origins and destinations and routes taken for goods movement. Thisneed was identified in light <strong>of</strong> the many infrastructure changes that had occurred over the pastdecade in <strong>Edmonton</strong>, including Anthony Henday Drive. There was also a need to investigate6 Alberta Economic Quick Facts, October 2012. Alberta Enterprise and Advanced Education, Government <strong>of</strong> Alberta.7 Transportation and international logistics - Industry Sector Pr<strong>of</strong>ile. Alberta Enterprise and Advanced Education, Government <strong>of</strong>Alberta. http://albertacanada.com/business/industries/transportation-and-logistics.aspx8 Calculated from data provided by John Rose, Chief Economist, <strong>City</strong> <strong>of</strong> <strong>Edmonton</strong>, 2012.9 ibid.10 ibid.11 ibid.3
possible changes in the movement <strong>of</strong> truck traffic between the city and the region, and thetypes <strong>of</strong> loads carried.Direction was given to update the information presented in the 1996 <strong>Truck</strong> Route Study. Thisupdated truck survey report will serve as an important input to the development <strong>of</strong> an<strong>Edmonton</strong> Goods Movement Strategy and implementation plan which will provide strategicdirection for enabling safe and efficient goods movement in <strong>Edmonton</strong>.4
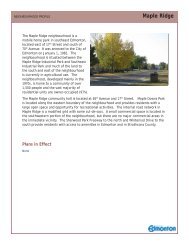
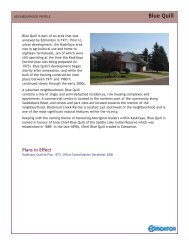
3. 2012 <strong>Edmonton</strong> <strong>Roadside</strong> <strong>Truck</strong> <strong>Survey</strong>3.1 Purpose and MethodologyTo better understand the movement <strong>of</strong> goods in<strong>Edmonton</strong> and provide input to the <strong>Edmonton</strong>Goods Movement Strategy, a truck survey wascommissioned by the <strong>City</strong>. A roadside surveywas chosen as it is both cost-effective and yieldshigher response rates than a mail-out survey.The survey was conducted by TransportationServices in cooperation with <strong>Edmonton</strong> PoliceService in September and October <strong>of</strong> 2012.Police <strong>of</strong>ficers directed trucks with a grossvehicle weight <strong>of</strong> 4,500 kilograms or more into asafe waiting area where they were voluntarily interviewed by survey staff regarding:• Trip origins and destinations• Routes taken while travelling in the city and the regional highways• Commodities carried• Experiences while travelling on the <strong>Edmonton</strong> transportation networkIn the <strong>City</strong> <strong>of</strong> <strong>Edmonton</strong>, any vehicle weighing more than 8,000 kg or having a length greaterthan 12.5 metres is considered to be a heavy vehicle and is subject to Bylaw 5590.However, for the purposes <strong>of</strong> this survey, the focus was on vehicles weighing more than4,500 kg in order to remain consistent with the methodology <strong>of</strong> the 2001 <strong>Edmonton</strong> Regionroadside survey. In addition, under federal legislation, trucks registered with a weight <strong>of</strong> morethan 4,500 kg must comply with National Safety Code standards on regional highways.3.2 Study Area and TimeframesThe survey was conducted at fourteen separate locations around the city over 14 days. Thelocations were selected based on the following criteria: high volume truck routes, ability fortrucks to stop safely, survey staff safety and sufficient road capacity to minimize impacts onmotorists. A map <strong>of</strong> the survey locations and dates is provided in Figure 1. Appendix A providesa map with more detailed information on the survey locations. Initially the survey was to beconducted in both the city and in the <strong>Edmonton</strong> region, however after consulting with AlbertaTransportation, resource limitations prevented the participation <strong>of</strong> Alberta Transportation in thesurvey and so the study was limited to locations within the city.5
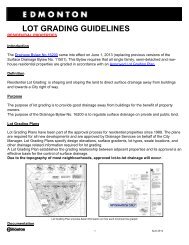
Figure 1 - <strong>Roadside</strong> <strong>Truck</strong> <strong>Survey</strong> LocationsSite Map LegendSITE LOCATION DATE SITE LOCATION DATE1 Yellowhead Trail west <strong>of</strong> 121 Sept. 18 8 99 Street south <strong>of</strong> 39 Avenue Oct. 12Street2 Whitemud Drive at 75 Street Sept. 19 9 Sherwood Park Freeway west Oct. 19<strong>of</strong> 34 Street3 Anthony Henday Drive north Sept. 20 10 Anthony Henday Drive near St. Oct. 24<strong>of</strong> Lessard RoadAlbert Trail4 170 Street north <strong>of</strong>Sept. 25 11 75 Street north <strong>of</strong> McIntyre Oct. 25Yellowhead TrailRoad5 50 Street north <strong>of</strong> Eleniak Sept. 26 12 Manning Drive north <strong>of</strong> 153 Oct. 26RoadAvenue6 Yellowhead Trail west <strong>of</strong> 50 Sept. 27 13 Highway 16A at Winterburn Oct. 30StreetRoad7 Wayne Gretzky Drive at 101Avenue (northbound only)and 116 Avenue(southbound only)Oct. 5 14 Gateway Boulevard north <strong>of</strong> 23Avenue (northbound) andCalgary Trail south <strong>of</strong> 42Avenue (southbound)Oct. 236
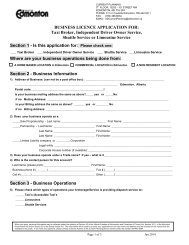
The survey was conducted on fourteen different days between Tuesday to Friday and between9 a.m. and 3 p.m., as previous studies have shown this is peak period for trucks. It also has theadded benefit <strong>of</strong> reducing impacts on motorists. The days selected to conduct the survey werebased on two factors:• The first three survey days were selected in order to coincide with the <strong>Edmonton</strong> PoliceService and Provincial fall check program• <strong>Truck</strong> volumes are typically higher Tuesday through Friday and during the <strong>of</strong>f-peak periods. 12This is also consistent with experiences in other Canadian jurisdictions.3.3 Consultation and CommunicationThe survey was designed to gather qualitative andquantitative information on the movement <strong>of</strong> trucks in<strong>Edmonton</strong> by way <strong>of</strong> a two- to three-minute interview. Asurvey questionnaire was developed after a literaturereview, internal consultation and review by an expertadvisor. Drivers were informed that the survey wasvoluntary and were <strong>of</strong>fered a thank-you card with ac<strong>of</strong>fee voucher as a gesture <strong>of</strong> appreciation. A detaileddescription <strong>of</strong> the development <strong>of</strong> the survey tool and techniques used are provided in the<strong>Roadside</strong> <strong>Truck</strong> <strong>Survey</strong> Techniques Report. The types <strong>of</strong> questions asked included the origins anddestinations <strong>of</strong> the truck, types <strong>of</strong> commodities carried, routes used and the quality <strong>of</strong> thedriving experience. A sample <strong>of</strong> thesurvey tool is provided in Appendix B.The questions were broadly similar tothose asked in the 2001 CommodityFlow Study with the main differencesbeing that in 2001 a comprehensivetrip diary was used, no driversatisfaction questions were asked andinformation on the value <strong>of</strong> the goodscarried was gathered. The budget forthe 2001 survey was ten times largerthan the 2012 roadside survey, whichallowed for greater detail to beobtained on trips made over a 24-hour period.A communication plan was alsodeveloped and informationdistributed to <strong>City</strong> Council, the media,industry representatives, governmentagencies and the public. A websitewas created to convey theinformation.12 Based on weigh-in-motion data provided by the Province <strong>of</strong> Alberta.7
4. <strong>Survey</strong> Results4.1 Scaling the <strong>Survey</strong> Sample ResultsOver the course <strong>of</strong> the 2012 <strong>Edmonton</strong> <strong>Roadside</strong> <strong>Truck</strong> <strong>Survey</strong>, 2,294 trucks were surveyed atfourteen locations around the <strong>City</strong> <strong>of</strong> <strong>Edmonton</strong> on various days. As the data represents only asample <strong>of</strong> all the truck movements in <strong>Edmonton</strong>, thedata had to be expanded to represent the overalltruck movements on a given day. All analysis wasconducted on the expanded data set. In combiningthe data from fourteen different sites arepresentative day was created.4.2 Vehicle CharacteristicsThe data collected on vehicle characteristics, includingtruck type, weight and information on dangerous goods loads, helps us to better understand thetypes <strong>of</strong> vehicles transporting goods on <strong>Edmonton</strong> roadways. These characteristics also help todetermine whether the vehicle is subject to the sections <strong>of</strong> the <strong>City</strong> <strong>of</strong> <strong>Edmonton</strong>’s Bylaw 5590pertaining to truck routes and movement <strong>of</strong> dangerous goods. Drivers were also asked aboutthe type <strong>of</strong> vehicle ownership <strong>of</strong> the truck. Details on the data expansion methodology can befound in the <strong>Roadside</strong> <strong>Truck</strong> <strong>Survey</strong> Data Expansion Report.8
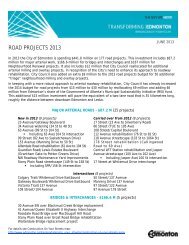
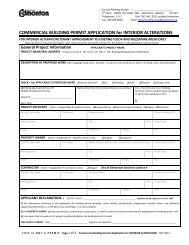
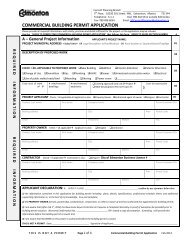
4.2.1 <strong>Truck</strong> Types<strong>Truck</strong>s travelling on <strong>Edmonton</strong> roadways take many forms. Figure 2 provides examples <strong>of</strong> thetypes <strong>of</strong> trucks that were interviewed for the roadside truck survey. Some <strong>of</strong> these trucks maynot have fallen under the category <strong>of</strong> a ‘heavy vehicle’ as defined by the <strong>City</strong> <strong>of</strong> <strong>Edmonton</strong> Bylaw5590 and so would not be subject to heavy vehicle regulations.Pick up with trailerSingle unit truckSingle trailerMulti-unit trailer (long combination vehicles)Figure 2 - Sample <strong>of</strong> <strong>Truck</strong> Types <strong>Survey</strong>ed9
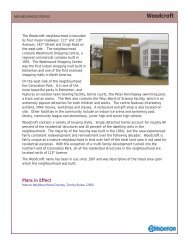
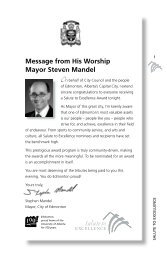
The focus <strong>of</strong> this survey was to gather information on trucks having a gross vehicle weight <strong>of</strong>4,500 kg or more which was consistent with the methodology used in the 2001 <strong>Edmonton</strong>Region roadside survey. Examples <strong>of</strong> vehicles that were not interviewed for the survey areshown in Figure 3.Figure 3 - Sample <strong>of</strong> <strong>Truck</strong> Types Not <strong>Survey</strong>edPickup with trailer5%Multiunit trailer7%Single trailer37%Single Unit51%The data presented in Figure 4indicates that 56% <strong>of</strong> trucks travellingon <strong>Edmonton</strong> road consist <strong>of</strong> singleunittrucks and a small number <strong>of</strong>pickups with trailers. The remaining44% include the larger tractor-trailerswith either single or multiple trailers.Figure 4 - <strong>Truck</strong> Types on <strong>Edmonton</strong>Road10
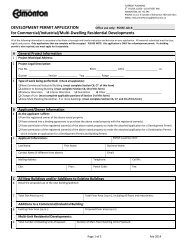
4.2.2 Vehicle WeightThe tare (empty) weights and gross vehicle weights <strong>of</strong> all trucks were collected when available ifprinted on the truck or provided by the driver. The distribution <strong>of</strong> gross vehicle weight is shownin Figure 5. The weight distribution <strong>of</strong> the vehicles indicates that the majority <strong>of</strong> trucks fellwithin the 20,000 kg to 70,000 kg gross weight range.35%30%30%25%Percentage <strong>of</strong> <strong>Truck</strong>s20%15%10%5%2%7%20%8%17%5%10%0%Less Than4,5004,500 to8,0008,000 to20,00020,000 to30,00030,000 to40,00040,000 to50,00050,000 to60,00060,000 to70,000<strong>Truck</strong> Gross Vehicle Weight (kg)4.2.3 Vehicle OwnershipFigure 5 - Distribution <strong>of</strong> <strong>Truck</strong> Gross Vehicle WeightLeased10%For Hire5%The information collected on vehicleownership presented in Figure 6 showsthat the vast majority <strong>of</strong> the trucks, 85%,are company-owned and the remainderare leased or for-hire vehicles.Figure 6 - Vehicle OwnershipCompany Owned85%11
4.3 Trip CharacteristicsTo gain insight into truck trip patterns, origin-destination and route choice information wascollected. In addition, drivers were asked to provide the reasons for their route choices andwhether they made a connection to an airport.4.3.1 Trip Origins and DestinationsOverall Trip PatternsDrivers were asked to provide the address at which they began and ended their trip on the day<strong>of</strong> the survey as well as the most recent stop before and after the survey. Figure 7 provides theorigin and destination data for the start and end <strong>of</strong> day. Data was also aggregated for all trucktrips in and around <strong>Edmonton</strong> with the most predominant truck movement patterns shownvisually in Figure 8.The results show that within the city, the origin-destination pair with the highest movement <strong>of</strong>trucks occurs between the Northwest and Southeast quadrants. This is consistent with theresults <strong>of</strong> the 2001 Commodity Flow <strong>Survey</strong> as well as the 1996 <strong>Truck</strong> Study. This also aligns withthe land use characteristics <strong>of</strong> these two quadrants as they have high industrial land use. Alsosignificant was truck movements between the Northwest and Northeast as well as theNortheast and Southeast quadrants <strong>of</strong> the city.‘Home base’ MovementsOf the trucks surveyed over 40,000, or 74%, began and ended their day at the same location, orwhat drivers <strong>of</strong>ten referred to as their ‘home base’. These trucks are typically company-owned,single-unit vehicles that make many daily stops. Notably, <strong>of</strong> all the trucks surveyed, 84% plannedto or had made a stop in the <strong>City</strong> <strong>of</strong> <strong>Edmonton</strong> during their day. These trucks are an importantpart <strong>of</strong> the <strong>Edmonton</strong> economy as they are likely to be used for local goods movement. Thesurvey identified the Northwest industrial area as the largest ‘home base’ in <strong>Edmonton</strong>, withnearly 13,000 trucks reporting starting and ending their day in this area.<strong>City</strong>-Region <strong>Truck</strong> MovementsBetween the <strong>City</strong> and the Region the highest volume <strong>of</strong> trips were generated to and from theEast, West and South Regions. The substantial movement <strong>of</strong> goods to and from the SouthRegion is consistent with previous studies while the growth <strong>of</strong> movement to and from the Westand East Regions is a new development. Overall, the most significant origins and destinationswere between <strong>Edmonton</strong> and Sherwood Park, St. Albert, Spruce Grove, Stony Plain, Acheson,Nisku, Leduc and Fort Saskatchewan. Outside <strong>of</strong> the region, important origins and destinationswere Calgary, Fort McMurray and Wetaskiwin. Outside <strong>of</strong> Alberta, a frequent origin-destinationwas Saskatoon.12
18,00016,00014,000Number <strong>of</strong> <strong>Truck</strong>s (Scaled)12,00010,0008,0006,0004,0002,000-NW<strong>Edmonton</strong>SE<strong>Edmonton</strong>NE<strong>Edmonton</strong>OutsideRegionEastRegionWestRegionSouthRegionNorthRegionOutsideAlbertaSW<strong>Edmonton</strong>OutsideCanadaOrigin 16,440 13,060 5,490 5,450 4,040 3,180 2,290 1,550 530 940 20Destination 16,390 12,360 5,940 4,930 3,840 3,130 1,820 1,620 1,560 1,280 140Figure 7 - Daily Origins and Destinations at Start and End <strong>of</strong> Day (All <strong>Truck</strong>s)13
Figure 8 - Daily <strong>Truck</strong> Trip Patterns14
4.3.2 Inner Ring Road and Anthony HendayTo better understand the routes that were used to complete the trips, drivers were askedwhether they used the Inner Ring Road or Anthony Henday Drive (map in Appendix 3) tocomplete their journey that day. For the Inner Ring Road corridors, the results show thatYellowhead Trail was used the most at 67% while 75 Street was used the least at 21%. Resultsare shown in Figure 9. Anthony Henday Drive was nearly as popular as Yellowhead Trail with60% <strong>of</strong> drivers indicating that they would be or had used Anthony Henday Drive for their tripsthat day.Figure 9 - Percentages <strong>of</strong> All <strong>Truck</strong>s Using Inner Ring Road Corridors15
4.3.3 Route ChoiceTo gain a better understanding <strong>of</strong> the factors influencing route choices, drivers were asked toselect from a list <strong>of</strong> reasons <strong>of</strong> why they chose the routes they did or to provide a reason <strong>of</strong> theirown 13 . The results are provided in Figure 10 and indicate that by far the factor that mostinfluenced the drivers’ route choice was that it was the most direct to their destination.90%80%81%70%60%50%40%30%20%14%12% 11% 11%10%5%0%0%Most Direct Route<strong>Truck</strong> Route RestrictionsAvoid Traffic CongestionPlanned Stop Along RouteLeast Number <strong>of</strong> Traffic LightsOther ReasonsDon't KnowFigure 10 - Route Choice Rationale Distribution13 Drivers were allowed to select more than one rationale for their route choice.16
4.3.4 Provincial HighwaysAfter consulting with Alberta Transportation, a question on which provincial highways wereused by drivers was included in the survey. The results are presented in Figure 11 and show thatHighway 16 was the most used <strong>of</strong> the provincial highways which aligns with the findings fromthe trip origins and destinations showing that most trips between the <strong>City</strong> and the Region tookplace between Northwest sector <strong>of</strong> the city and the East and West Regions.4.3.5 Connections to AirportsFigure 11 - Percentages <strong>of</strong> <strong>Truck</strong>s Using Provincial HighwaysAfter consultation with the <strong>Edmonton</strong> International Airport, a question was developed askingdrivers if they made or planned to make a connection to an airport. The results indicate thatvery few trucks connected to an airport with 3.7% connecting to the <strong>Edmonton</strong> InternationalAirport and 0.5% to the Calgary International Airport.17
4.4 Load CharacteristicsIn this section <strong>of</strong> the survey truck drivers were asked to provide information on the type <strong>of</strong> loadbeing carried and on the load efficiency, i.e. whether the truck was full, partially full, empty orwhether the truck was a service vehicle. Examples <strong>of</strong> service vehicles include vehicles used fortowing, landscaping, snow removal and electrical and plumbing services.4.4.1 Load Efficiency and DiversityDrivers were asked to provide information on how much load they were carrying in terms <strong>of</strong>having a full, partially full or empty truck. Figure 12 provides the distribution <strong>of</strong> load efficiency.In examining the travel patterns <strong>of</strong> load-carrying trucks, full trucks are more likely to have anorigin or destination outside <strong>of</strong> the region as compared to those staying within the city andregion. Just over a third <strong>of</strong> trucks reported travelling empty or “dead-heading” which indicatessome inefficiency. Drivers were also given the option <strong>of</strong> identifying their truck as a servicevehicle and as such were not carrying a goods load. Of the service vehicles surveyed, 79% werecity-based with less than 1% traveling outside <strong>of</strong> the region. In terms <strong>of</strong> the diversity <strong>of</strong> theirload, the results indicate that the majority, 82% <strong>of</strong> trucks, are carrying single commodities whilethe remaining 18% were carrying multiple commodities 14 .ServiceVehicle3%Full Load23%Empty36%Partially FullLoad38%Figure 12 - Load Efficiency14 A commodity category contains several types <strong>of</strong> goods, so although the truck is carrying a single type <strong>of</strong> commodity there may bemany different types <strong>of</strong> goods on board.18
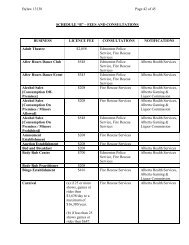
4.4.2 Goods Pr<strong>of</strong>ileOf the trucks that were full or partially full, the goods carried were aggregated into elevencategories by truck type in Figure 13. Results indicate the most frequently transported good wasnon-metallic minerals such as gravel, soil and glass, followed by fabricated metal products suchas metal pipes and beams. This is consistent with <strong>Edmonton</strong>’s position as a transportation hubfor construction and heavy industry.Miscellaneous5%Waste4%Food/Farm9%Manufactured Goods11%Wood/Paper13%Vehicles/Equipment11%Chemicals5%Plastics4%Fuel/Petroleum9%Fabricated Metal14%Non-Metallic Minerals15%Figure 13 - Commodities Carried by <strong>Truck</strong>s19
4.4.3 Dangerous GoodsDangerous goods being carried by trucks were reported in the survey by recording the UnitedNations number <strong>of</strong> the dangerous good as indicated on a placard on the truck. Only 92 trucksrepresenting 4.3% <strong>of</strong> those surveyed were transporting one or more dangerous good. The typesand distribution <strong>of</strong> dangerous goods being transported are illustrated in Figure 14. As shown inthe figure, 72% <strong>of</strong> the trucks carrying dangerous goods were hauling petroleum fuels, liquefiedpetroleum gases, petroleum distillates or crude oil. Of the remaining 28%, half were carryingindustrial chemicals including acids, solvents, alcohols, ketones, peroxides and sulphur.solvents and paint-relatedcompunds2% other9%ketones2%wet-cell batteries4%compressed gas5%industrial alcohols6%gasoline and fuel oil51%crude oil7%liquefied petroleum gases14%Figure 14 - Types <strong>of</strong> Dangerous Goods Carried20
4.5 Driver SatisfactionTo gauge the quality <strong>of</strong> the driving experience for truck drivers on <strong>Edmonton</strong> road, threequalitative questions were asked on the survey. For each <strong>of</strong> the questions, drivers were asked torate their level <strong>of</strong> satisfaction on a scale <strong>of</strong> one to five, with 1 being ‘Do not agree at all’ and 5being ‘Completely agree’. Figure 15 summarizes the findings. Although overall the majority <strong>of</strong>truck drivers interviewed are satisfied with their driving experience, drivers were most satisfiedwith ability to understand the truck routes in <strong>Edmonton</strong> but were least satisfied with theirability to keep to their schedules. This last finding is consistent with verbal comments fromdrivers (summarized in Section 5.1) in which congestion and bottlenecks are highlighted asissues. By comparison, these satisfaction rates are significantly more favourable than those seenin other jurisdictions such as Toronto and the United States.100%90%80%Don't KnowDo Not Agree At AllSomewhat DisagreeNeutralSomewhat AgreeCompletely Agree70%60%50%40%30%20%10%0%<strong>Edmonton</strong>'s <strong>Truck</strong>Routes Are Easy toUnderstandI Am Able toMaintain MySchedule on<strong>Edmonton</strong>'sRoadwaysOverall, I AmSatisfied with<strong>Edmonton</strong>'s <strong>Truck</strong>Routes andRoadwaysFigure 15 - Driver Satisfaction21
5.0 Discussion <strong>of</strong> FindingsData collected from the roadside truck survey <strong>of</strong>fers the ability to better understand themovement <strong>of</strong> trucks as well as the motivations for selected particular routes and corridors. Thedata helps us to validate trends that were observed in previous goods studies and <strong>of</strong>fers insightinto new or changing trends.5.1 Driver CommentsAlong with answering the survey questions, drivers also <strong>of</strong>fered their own personal commentsregarding truck routes and their experiences in travelling on <strong>Edmonton</strong> roadways. The wordcloud in Figure 16 provides a quick visual <strong>of</strong> the most commonly mentioned words and relatedissues such as traffic, construction and potholes. This was one way <strong>of</strong> understanding thecommon ideas conveyed by truck drivers during the survey.Figure 16 - Word Cloud <strong>of</strong> Driver Comment ThemesThe most frequent comments from truck drivers were in relation to improvements to roadwaymaintenance. In particular, potholes, rutting and raised manholes which contribute to vehicledamage and driver discomfort were concerns. Comments included:22
“Smoother road - pot holes. Man holes [need to be] covered better on road or theydamage truck suspension.”“Whitemud 99st-91st [needs to be] fixed. It's too wavy, it affects driver's head and neck,the tires loose traction and it loosens loads.”Route directness was also important to drivers. The opening <strong>of</strong> 75 Street between 90 Avenueand 98 Avenue is noted as one <strong>of</strong> the main themes to achieve this. Improvements to truck routesignage size, locations and ease <strong>of</strong> understanding were also important to drivers.“75 St / Capilano bad for commercial truckers because they need it and can't use it.”“75 St should be straight through. Too circuitous right now.”“Bad signage - not enough notice or trees are covering the signs.”“More signage needed along routes, i.e. not enough warning, sign appears and that's it.You are supposed to obey [but] not enough time to obey.”An additional sub-theme that immerged from the driver comments was the frustration withconstruction and congestion along key goods movement routes, particularly along YellowheadTrail and Anthony Henday Drive. Also, some drivers felt that a public awareness effort wasrequired regarding safety, courtesy and awareness in sharing the roadway with trucks.“Rush hour traffic is bad especially on Yellowhead Trail west end. Money wasted and thetime wasted to get into Cloverbar Landfill”“Terrible traffic especially on Yellowhead Trail”“Yellowhead morning rush hour - motorists need to be educated about big trucks”“More advertisements for courtesy to truck drivers, don’t cut <strong>of</strong>f – let them in when thelane ends”23
5.2 Key Goods Movement CorridorsA more detailed analysis <strong>of</strong> the survey data found the facilities most used by trucks in the cityand region were Yellowhead Trail, Anthony Henday and Whitemud Drive (Figure 17) pointing tothe importance <strong>of</strong> these corridors for the movement <strong>of</strong> goods in <strong>Edmonton</strong> and the region.40,00035,000<strong>Truck</strong>s Reported Using (Scaled)30,00025,00020,00015,00010,0005,0000YellowheadTrailAnthonyHendayDriveWhitemudDriveHWY 16 170 Street HWY2 75 Street HWY 16A HWY 14 HWY 28Stated Facility UsedFigure 17 - Most Used Roadway Facilities by <strong>Truck</strong>s5.2.1 Importance <strong>of</strong> Yellowhead Trail & Anthony Henday DriveInformation obtained from the truck survey has confirmed the importance <strong>of</strong> Yellowhead Trailand Anthony Henday Drive to the <strong>Edmonton</strong> goods movement network. Approximately 60% <strong>of</strong>trucks using Yellowhead Trail and Anthony Henday Drive had as part <strong>of</strong> their trip an origin or adestination in the <strong>City</strong> <strong>of</strong> <strong>Edmonton</strong>. As such, the degree <strong>of</strong> efficiency <strong>of</strong>fered by these tw<strong>of</strong>acilities has a direct impact on the quality <strong>of</strong> daily goods movement within the city.The region is also highly impacted by the efficiency <strong>of</strong> goods movement on these facilities asnearly a quarter <strong>of</strong> all trucks using <strong>of</strong> Yellowhead Trail and Anthony Henday Drive had an originor destination in the region.24
6.0 ConclusionsThe <strong>Edmonton</strong> <strong>Roadside</strong> <strong>Truck</strong> <strong>Survey</strong> conducted in the fall <strong>of</strong> 2012 was successful in validatingpatterns in truck and goods movements identified in previous studies and revealing some newtrends as well. In total, information was collected on 2,294 trucks and was expanded torepresent a typical weekday in <strong>Edmonton</strong>.6.1 Key FindingsLand Use and Economic TrendsOver the past decade the <strong>Edmonton</strong> CMA has experienced a large growth in both its grossdomestic product and the transportation and warehousing sector. These growth trends areexpected to continue with forecasted GDP growth <strong>of</strong> 32% over the next 10 years in theTransportation and Warehousing sector 15 .The southeast and northwest zones <strong>of</strong> the city continue to be characterized by their highindustrial land use, a trend likely to continue based on planned industrial developments.<strong>Truck</strong> and Goods Movement PatternsWithin the city, the survey showed that the dominant movement <strong>of</strong> trucks is between theNorthwest and Southeast quadrants, consistent with results <strong>of</strong> the 1996 <strong>Truck</strong> Study and the2001 Commodity Flow <strong>Survey</strong>. Also, the majority <strong>of</strong> trucks began and ended day at the samelocation or their ‘home-base’.Between the region and the city, the largest truck movements occurred between the West andSouth and East Regions and the city. Previous studies also showed the largest city-region truckmovement to be between the South Region and the city however the West and East Regions areemerging as significant generators <strong>of</strong> truck movement to and from the city.A look at the commodities being carried by the trucks indicates that <strong>Edmonton</strong>’s roads areimportant to the oil, gas and construction industries with 54% <strong>of</strong> trucks carrying materials suchas chemicals, fuel petroleum and construction materials. This represents a continued growth inthis sector as compared to previous studies.Yellowhead Trail and Anthony Henday DriveYellowhead Trail and Anthony Henday Drive are key facilities for truck movements for the cityand the region. Yellowhead Trail is the most used facility as indicated by 67% <strong>of</strong> truck drivers,followed by Anthony Henday Drive at 60%. Directness was identified by an overwhelmingnumber <strong>of</strong> drivers (81%) as the primary determinant <strong>of</strong> route choice.15 Calculated from data provided by John Rose, Chief Economist, <strong>City</strong> <strong>of</strong> <strong>Edmonton</strong>, 201225
Approximately 60% <strong>of</strong> trucks using Yellowhead Trail and Anthony Henday Drive had as part <strong>of</strong>their trip an origin or a destination in the <strong>City</strong> <strong>of</strong> <strong>Edmonton</strong>. As such, the degree <strong>of</strong> efficiency<strong>of</strong>fered by these two facilities has a direct impact on the quality <strong>of</strong> daily goods movement withinthe city. The region is also highly impacted by the efficiency <strong>of</strong> goods movement on thesefacilities as nearly a quarter <strong>of</strong> all trucks using <strong>of</strong> Yellowhead Trail and Anthony Henday Drivehad an origin or destination in the region.These findings point to the importance <strong>of</strong> improvements to Yellowhead Trail and the completion<strong>of</strong> Anthony Henday Drive as they are key facilities in providing the direct access to <strong>Edmonton</strong>’sindustrial zones and well as the South, West and East Regions.Driver Satisfaction and FeedbackOverall, truck drivers reported a high level <strong>of</strong> satisfaction (62%) with <strong>Edmonton</strong>’s truck routesand roadways - much higher than other in Canada and the United States. Top suggestions fromtruck drivers about the roadway network included improvements to pavement condition,opening 75 Street to truck traffic and improvements to signage and truck route information.6.2 Next StepsSeveral stakeholders were informed and/or consulted in the development <strong>of</strong> the <strong>Edmonton</strong><strong>Roadside</strong> <strong>Truck</strong> <strong>Survey</strong> and many have expressed interest in the results. This report will beshared with <strong>City</strong> departments, government agencies, industry and industry representatives.The survey results will also be an important input in the development <strong>of</strong> the <strong>Edmonton</strong> GoodsMovement Strategy, to be presented to <strong>Edmonton</strong> <strong>City</strong> Council in the fall <strong>of</strong> <strong>2013</strong>.26
ReferencesAlberta Enterprise and Advanced Education, Alberta Economic Quick Facts, October 2012,Government <strong>of</strong> Alberta.Alberta Enterprise and Advanced Education, Transportation and international logistics - IndustrySector Pr<strong>of</strong>ile, Government <strong>of</strong> Alberta.http://albertacanada.com/business/industries/transportation-and-logistics.aspxInternational Results Group. <strong>Edmonton</strong> Region Commodity Flow Study 2001/2002 TechnicalReport, 2002.Morrison Hershfield. <strong>Truck</strong> Route Study: Project Report, Transportation Master Plan <strong>Truck</strong> RouteStudy: Final Report. Morrison Hershfield in Association with Reid Crowther & Partners Limited,and Cochrane Engineering, May 1996.Stantec Consulting Ltd (for Alberta Transportation and the <strong>City</strong> <strong>of</strong> <strong>Edmonton</strong>), <strong>Edmonton</strong> RegionCommodity Flow Study Project Report, November 2003.27
AcknowledgementsWe would like to acknowledge the help <strong>of</strong> the <strong>Edmonton</strong> Police Service and the <strong>City</strong> <strong>of</strong><strong>Edmonton</strong> Transportation Operations branch for helping us to conduct the survey in a mannerthat was safe both to staff and motorists. We would like to express our thanks to the surveycollection field staff for their pr<strong>of</strong>essional and courteous manner while surveying the truckdrivers.We would also like thank David Kriger <strong>of</strong> David Kriger Consultants Inc. for his advice andguidance <strong>of</strong>fered throughout the development and analysis <strong>of</strong> the survey.Thank you to the University <strong>of</strong> Alberta’s Academic Information and CommunicationTechnologies unit for providing the Optical Mark Recognition technology in processing thesurveys.Thank you to all <strong>of</strong> the truck drivers who took the time to participate in our survey and toprovide us with the information to help us improve truck facilities.28
Appendix A. <strong>Edmonton</strong> <strong>Roadside</strong> <strong>Truck</strong> <strong>Survey</strong>Locations29
Appendix B. Sample <strong>Survey</strong>30
Appendix C. Map <strong>of</strong> Anthony Henday Drive32
<strong>City</strong> <strong>of</strong> <strong>Edmonton</strong>, Transportation Planning13th Floor, Century Place9803 - 102A Avenue<strong>Edmonton</strong>, Alberta, Canada T5J 3A3780-496-1795www.edmonton.ca