Blue Quill Profile - City of Edmonton
Blue Quill Profile - City of Edmonton
Blue Quill Profile - City of Edmonton

Create successful ePaper yourself
Turn your PDF publications into a flip-book with our unique Google optimized e-Paper software.
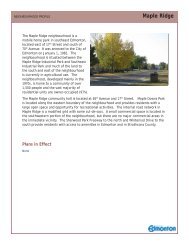
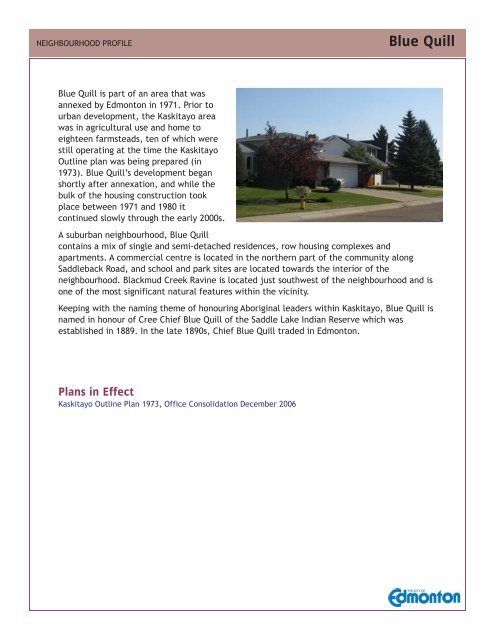
NEIGHBOURHOOD PROFILE<strong>Blue</strong> <strong>Quill</strong><strong>Blue</strong> <strong>Quill</strong> is part <strong>of</strong> an area that wasannexed by <strong>Edmonton</strong> in 1971. Prior tourban development, the Kaskitayo areawas in agricultural use and home toeighteen farmsteads, ten <strong>of</strong> which werestill operating at the time the KaskitayoOutline plan was being prepared (in1973). <strong>Blue</strong> <strong>Quill</strong>’s development beganshortly after annexation, and while thebulk <strong>of</strong> the housing construction tookplace between 1971 and 1980 itcontinued slowly through the early 2000s.A suburban neighbourhood, <strong>Blue</strong> <strong>Quill</strong>contains a mix <strong>of</strong> single and semi-detached residences, row housing complexes andapartments. A commercial centre is located in the northern part <strong>of</strong> the community alongSaddleback Road, and school and park sites are located towards the interior <strong>of</strong> theneighbourhood. Blackmud Creek Ravine is located just southwest <strong>of</strong> the neighbourhood and isone <strong>of</strong> the most significant natural features within the vicinity.Keeping with the naming theme <strong>of</strong> honouring Aboriginal leaders within Kaskitayo, <strong>Blue</strong> <strong>Quill</strong> isnamed in honour <strong>of</strong> Cree Chief <strong>Blue</strong> <strong>Quill</strong> <strong>of</strong> the Saddle Lake Indian Reserve which wasestablished in 1889. In the late 1890s, Chief <strong>Blue</strong> <strong>Quill</strong> traded in <strong>Edmonton</strong>.Plans in EffectKaskitayo Outline Plan 1973, Office Consolidation December 2006
NEIGHBOURHOOD PROFILE<strong>Blue</strong> <strong>Quill</strong>Period <strong>of</strong> ConstructionOccupied Units % <strong>of</strong> Total <strong>City</strong>%Before 1946 20 1 41946 to 1960 50 3 171961 to 1970 95 5 161971 to 1980 900 47 241981 to 1985 455 24 101986 to 1990 155 8 61991 to 1995 120 6 61996 to 2000 55 3 62001 to 2006 80 4 12Occupied Private Dwellings 1,925 100 100Source: 2006 Census <strong>of</strong> Canada, Statistics CanadaOccupied Private Dwellings by TenureTenure Number % <strong>of</strong> Total <strong>City</strong>%Owner Occupied 705 37 63Renter Occupied 1,215 63 37Total 1,920 100 100Source: 2006 Census <strong>of</strong> Canada, Statistics CanadaResidential Units by Unit TypeType <strong>of</strong> Unit Number % <strong>of</strong> Total <strong>City</strong>%Single-detached house 530 28 50Semi-detached, triplex, fourplex 45 2 7Row house 225 12 10Apartment over 5 storeys - - 9Apartment under 5 storeys 1,120 58 23Movable dwelling - - 1Total 1,920 100 100Source: 2006 Census <strong>of</strong> Canada, Statistics CanadaNote: totals may not sum due to random rounding
NEIGHBOURHOOD PROFILE<strong>Blue</strong> <strong>Quill</strong>Population by Age and GenderMale Female Total Nbhd <strong>City</strong>2006% 2006%0 - 9 270 255 525 11 1110 - 19 325 300 625 14 1320 - 29 565 580 1,145 25 1830 - 39 380 315 695 15 1440 - 49 330 275 605 13 1650 - 59 170 305 475 10 1360 - 69 150 155 305 7 770+ 90 120 210 5 8Total 2,280 2,305 4,585 100 100Source: 2006 Census <strong>of</strong> Canada, Statistics CanadaHousehold by Household sizePpl per Household Households Nbhd <strong>City</strong> Nbhd2006% 2006% 1986%1 person 590 31 30 222 people 665 35 33 353 people 275 14 15 194-5 people 335 18 19 216 or more 40 2 3 3Total 1,925 100 100 100Source: 2006 Census <strong>of</strong> Canada, Statistics CanadaPopulation by Mobility Status (based on address five years previous)# <strong>of</strong> People % Total <strong>City</strong>%Non-Movers 1,745 40 50Moved from Elsewhere in <strong>Edmonton</strong> 1,395 32 32Moved from Elsewhere in Alberta 340 8 7Moved from Elsewhere in Canada 455 11 7Moved from outside Canada 380 9 5Source: 2006 Census <strong>of</strong> Canada, Statistics CanadaNote: totals may not sum due to random rounding
NEIGHBOURHOOD PROFILE<strong>Blue</strong> <strong>Quill</strong>Family HouseholdsFamily Type Households % <strong>of</strong> Total <strong>City</strong>%Married couples 745Without children at home 285 24 29With children at home 465 39 40Common-law couples 195Without children at home 135 11 9With children at home 60 5 4Total lone-parent families 265Female parent 225 19 15Male parent 30 2 4Total 1,205 100 100Source: 2006 Census <strong>of</strong> Canada, Statistics CanadaHousehold Income 2005Income Households % <strong>of</strong> Total <strong>City</strong>%Household income in 2005 1,925Under $10,000 80 4 4$10,000 to $19,999 160 8 10$20,000 to $29,999 225 12 9$30,000 to $39,999 210 11 11$40,000 to $49,999 265 14 10$50,000 to $59,999 175 9 9$60,000 to $69,999 195 10 8$70,000 to $79,999 95 5 7$80,000 to $89,999 90 5 6$90,000 to $99,999 85 4 5$100,000 and over 350 18 21Median household income $ 51,292 57,085Average household income $ 65,584 72,950Source: 2006 Census <strong>of</strong> Canada, Statistics CanadaNote: totals may not sum due to random rounding
NEIGHBOURHOOD PROFILE<strong>Blue</strong> <strong>Quill</strong>Population by Ethnic OriginPeople % <strong>of</strong> Total <strong>City</strong>%European origins 1,965 29 32British Isles origins 1,675 25 26Other North American origins (includes Canadian) 775 12 12East and Southeast Asian origins 650 10 8French origins 585 9 8Aboriginal origins 290 4 5South Asian origins 355 5 4African origins 260 4 2Arab origins 50 1 1Latin, Central and South American origins - 0 1Caribbean origins 50 1 1West Asian origins 30 0 0Oceania origins 10 0 0Total 6,695 100 100The sum <strong>of</strong> the ethnic groups in this table is greater than the total population countbecause a person may report more than one ethnic origin in the census.Source: 2006 Census <strong>of</strong> Canada, Statistics CanadaJourney to Work (employed labour force)Transportation Method People % <strong>of</strong> Total <strong>City</strong>%Car, truck, van as driver 1,935 72 71Car, truck, van as passenger 240 9 8Public transit 385 14 13Walked 120 4 6Bicycle 10 - 1Motorcycle - - -Taxicab - - -Other method - - 1Total 2,690 100 100Source: 2006 Census <strong>of</strong> Canada, Statistics CanadaNote: totals may not sum due to random rounding
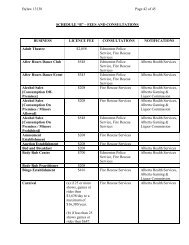
122 ST75 ST50 ST17 STNEIGHBOURHOOD PROFILE<strong>Blue</strong> <strong>Quill</strong>2008 Neighbourhood Photo and Current ZoningSweet Grass<strong>Blue</strong> <strong>Quill</strong>EstatesErmineskinSkyrattler170 STSTONY PLAIN ROAD118 AVE142 STWHITEMUD DRIVE137 AVE97 STYELLOWHEAD TRAIL82 AVE167 AVE118 AVE227 AVE34 STMERIDIAN STMANNING DRIVEZoning CategoriesRF1 - single detached residential zoneRF5 - row housing zoneRA7 - low rise apartment zoneRA8 - medium rise apartment zoneCNC - neighbourhood convenience commercialCS1 - community services zone 1: provides for public facilities and low to medium densityhousing on surplus school sitesCS2 - community services zone 2: provides for recreation uses and loe to medium densityhousing on surplus school sites199 STTERWILLEGAR DRIVECALGARY TRAILNo reproduction <strong>of</strong> this map, in whole or in part, is permitted without the express writtenconsent <strong>of</strong> the <strong>City</strong> <strong>of</strong> <strong>Edmonton</strong> Planning and Development Department.ELLERSLIE RD (9 AVE SW)The <strong>City</strong> <strong>of</strong> <strong>Edmonton</strong> disclaims any liability for the use <strong>of</strong> this map.