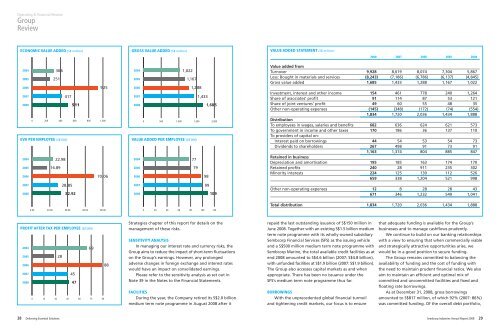
Operating & Financial ReviewGroupReviewNet cash inflow from operating activities for thefinancial year <strong>2008</strong> was S$2.3 billion as comparedto a net cash inflow of S$614.0 million for 2007.The strong operating cash flow was mainly contributedby our Marine business and our Utilities operations inSingapore and the UK.Net cash outflow from investing activities in<strong>2008</strong> was S$115.8 million. The cash outflow ofS$361.7 million on expansion and operational capitalexpenditure was partially offset by proceeds from thesale of property, plant and equipment, subsidiaries,associates and other investments of S$133.1 millionand dividends and interest received of S$120.7 million.Net cash outflow from financing activities for <strong>2008</strong>of S$1.0 billion relates mainly to dividends and interestpaid as well as net repayment of borrowings.Free cash flow, defined as operating cash flowplus investing cash flow adjusted for expansion capitalexpenditure, was S$2.3 billion as at December 31, <strong>2008</strong>.FINANCIAL POSITIONGroup shareholders’ funds decreased fromS$3.0 billion at December 31, 2007 to S$2.6 billion atDecember 31, <strong>2008</strong>. ‘Other reserves’ decreased dueto a lower fair value reserve as a result of fair valueadjustments for Cosco Corporation (Cosco) shares heldby <strong>Sembcorp</strong> Marine as well as hedging instruments.Translation losses arising from the translation ofour foreign operations’ contributions resulted in alower foreign currency translation reserve due to theweakening of the US dollar and pound sterling duringthe year. Treasury shares purchased by the Companyand a listed subsidiary in <strong>2008</strong> also contributed tolower ‘Other reserves’ as at December 31, <strong>2008</strong>.The decrease in ‘Other financial assets’ wasmainly due to fair value adjustments for Cosco sharesheld by <strong>Sembcorp</strong> Marine. The increase in the longtermreceivables pertained to the Changi NEWaterplant which is being constructed under a serviceconcession arrangement. The Group has recognisedthe consideration receivable as long-term receivablesin accordance with Interpretations to the SingaporeFinancial <strong>Report</strong>ing Standards (INT FRS) 112.‘Trade and other payables’ increased due to higheroperating activities by our Marine business. ‘Otherpayables’ increased due to a reclassification from noncurrentliabilities to current liabilities of our 40% shareof the equity bridging loan taken up by an associate,Emirates <strong>Sembcorp</strong> Water & Power Company, whichwas repaid in February 2009. Our Utilities businessalso recorded lower receivables due to a drop in HSFOrates. Our Marine business recorded lower ‘Inventoriesand work-in-progress’ while ‘Excess of progress billingsover work-in-progress’ and ‘Bank balances, fixeddeposits and cash’ increased mainly due to receiptsfrom customers for both rig building projects inprogress and completed projects.SHAREHOLDER RETURNSThe Group’s return on equity stood at 18% andearnings per share was 28.5 cents in <strong>2008</strong>.Subject to approval by shareholders at thenext annual general meeting, a final tax exemptone-tier dividend of 11.0 cents per ordinary sharehas been proposed for the financial year endedDecember 31, <strong>2008</strong>.ECONOMIC VALUE ADDEDIn <strong>2008</strong>, the Group generated positive economicvalue added (EVA) of S$510.7 million due to anincrease in operating profits coupled with a lowercapital charge.Our net operating profit after tax for <strong>2008</strong>amounted to S$823.9 million whilst our capital chargedecreased to S$313.2 million mainly due to a lowerweighted average cost of capital of 5.8%.VALUE ADDED AND PRODUCTIVITY DATAIn <strong>2008</strong>, the total value added by the Group wasS$1.8 billion. This was absorbed by employees inwages, salaries and benefits of S$682.2 million;by the government in income and other taxes ofS$169.5 million and by providers of capital in interestand dividends of S$311.3 million, leaving the balanceof S$670.7 million reinvested in business.CRITICAL ACCOUNTING POLICIES<strong>Sembcorp</strong>’s financial statements are preparedin accordance with the Singapore Financial <strong>Report</strong>ingStandards (FRS).ECONOMIC VALUE ADDED (S$ million)With effect from January 1, <strong>2008</strong>, the Groupadopted the following new or amended FRS and INTFRS which are relevant to our operations:Note <strong>2008</strong> 2007Net operating profit before taxation 736 634Adjust forShare of associates’ and joint ventures’ profits 140 174Interest expense 1 47 58Others 2 5 2Adjusted profit before interest and tax 928 868Cash operating taxes 3 (104) (138)Net operating profit after tax (NOPAT) 824 730Average capital employed 4 5,419 5,159Weighted average cost of capital (%) 5 5.8 6.1Capital charge 313 313Economic value added (EVA) 511 417Minority share of EVA (175) (77)EVA attributable to shareholders 336 340Less: Unusual items (UI) gains 6 10 208EVA attributable to shareholders (excluding UI) 326 132Notes:1. Interest expense includes imputed interest on present value of operating leases and capitalised interest charged to income statement upon disposal of the assets.2. Other adjustments include recovery of investment costs, timing difference of allowances made for / (write-back) of doubtful debts, inventory obsolescenceand goodwill written off / impaired and construction-in-progress.3. The reported current tax is adjusted for the statutory tax impact of interest expense.4. Monthly average total assets less non interest-bearing liabilities plus timing provision, goodwill written off / impaired and present value of operating leases.5. The Weighted Average Cost of Capital is calculated in accordance with the <strong>Sembcorp</strong> Group EVA Policy as follows:i. Cost of Equity using Capital Asset Pricing Model with market risk premium at 6.0% (2007: 6.0%);ii. Risk-free rate of 2.74% (2007: 3.05%) based on yield-to-maturity of Singapore Government 10-year Bonds;iii. Ungeared beta ranging from 0.5 to 1.0 (2007: 0.5 to 1.0) based on <strong>Sembcorp</strong> Industries’ risk categorisation; andiv. Cost of Debt rate at 3.53% (2007: 4.12%) using 5-year Singapore Dollar Swap Offer Rate plus 55 basis points (2007: 5-year Singapore Dollar Swap OfferRate plus 75 basis points).6. Unusual items (UI) refer to divestment of subsidiaries, associates, joint ventures, long-term investments and disposal of major fixed assets.INT FRS 111INT FRS 114FRS 102 – Group and Treasury ShareTransactionsFRS 19 – The Limit on a DefinedBenefit Asset, Minimum FundingRequirements and their InteractionThe effects of the adoption of the above INT FRSdid not result in substantial changes to the Group’saccounting policies.FINANCIAL RISK MANAGEMENTThe Group’s activities expose it to a variety offinancial risks, including changes in interest rates,foreign exchange rates and commodity prices as wellas credit risk.Please refer to the Risk Management & Mitigation26 Delivering Essential Solutions <strong>Sembcorp</strong> Industries <strong>Annual</strong> <strong>Report</strong> <strong>2008</strong> 27
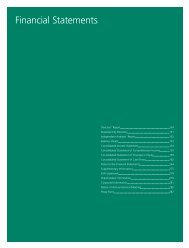
Operating & Financial ReviewGroupReviewECONOMIC VALUE ADDED (S$ million)GROSS VALUE ADDED (S$ million)VALUE ADDED STATEMENT (S$ million)<strong>2008</strong> 2007 2006 2005 200420042005306251200420051,0221,1672006925 20061,2882007417 20071,433<strong>2008</strong>511 <strong>2008</strong>1,6850 200 400 600 800 1,0000 500 1,000 1,500 2,000EVA PER EMPLOYEE (S$’000)VALUE ADDED PER EMPLOYEE (S$’000)2004200522.9816.89200420057779200670.06200698200728.85200799<strong>2008</strong>32.92<strong>2008</strong>109Value added fromTurnover 9,928 8,619 8,074 7,304 5,867Less: Bought in materials and services (8,243) (7,186) (6,786) (6,137) (4,845)Gross value added 1,685 1,433 1,288 1,167 1,022Investment, interest and other income 154 461 778 240 1,264Share of associates’ profit 91 114 87 53 121Share of joint ventures’ profit 49 60 55 48 35Other non-operating expenses (145) (348) (172) (74) (554)1,834 1,720 2,036 1,434 1,888DistributionTo employees in wages, salaries and benefits 682 636 624 621 573To government in income and other taxes 170 186 36 137 110To providers of capital on:Interest paid on borrowings 44 54 53 54 73Dividends to shareholders 267 498 91 73 911,163 1,374 804 885 847Retained in businessDepreciation and amortisation 195 185 163 174 170Retained profits 240 28 911 235 302Minority interests 224 125 130 112 526659 338 1,204 521 998Other non-operating expenses 12 8 28 28 43671 346 1,232 549 1,0410.00 20.00 40.00 60.00 80.000 20 40 60 80 100 120Total distribution 1,834 1,720 2,036 1,434 1,888PROFIT AFTER TAX PER EMPLOYEE (S$’000)2004692005282006882007<strong>2008</strong>45470 15 30 45 60 75 90Strategies chapter of this report for details on themanagement of these risks.SENSITIVITY ANALYSISIn managing our interest rate and currency risks, theGroup aims to reduce the impact of short-term fluctuationson the Group’s earnings. However, any prolongedadverse changes in foreign exchange and interest rateswould have an impact on consolidated earnings.Please refer to the sensitivity analysis as set out inNote 39 in the Notes to the Financial Statements.FACILITIESDuring the year, the Company retired its S$2.0 billionmedium term note programme in August <strong>2008</strong> after itrepaid the last outstanding issuance of S$150 million inJune <strong>2008</strong>. Together with an existing S$1.5 billion mediumterm note programme with its wholly-owned subsidiary<strong>Sembcorp</strong> Financial Services (SFS) as the issuing vehicleand a S$500 million medium term note programme with<strong>Sembcorp</strong> Marine, the total available credit facilities as atend <strong>2008</strong> amounted to S$4.6 billion (2007: S$4.8 billion),with unfunded facilities at S$1.9 billion (2007: S$1.9 billion).The Group also accesses capital markets as and whenappropriate. There has been no issuance under theSFS’s medium term note programme thus far.BORROWINGSWith the unprecedented global financial turmoiland tightening credit markets, our focus is to ensurethat adequate funding is available for the Group’sbusinesses and to manage cashflows prudently.We continue to build on our banking relationshipswith a view to ensuring that when commercially viableand strategically attractive opportunities arise, wewould be in a good position to secure funding.The Group remains committed to balancing theavailability of funding and the cost of funding withthe need to maintain prudent financial ratios. We alsoaim to maintain an efficient and optimal mix ofcommitted and uncommitted facilities and fixed andfloating rate borrowings.As at December 31, <strong>2008</strong>, gross borrowingsamounted to S$817 million, of which 92% (2007: 86%)was committed funding. Of the overall debt portfolio,28 Delivering Essential Solutions <strong>Sembcorp</strong> Industries <strong>Annual</strong> <strong>Report</strong> <strong>2008</strong> 29