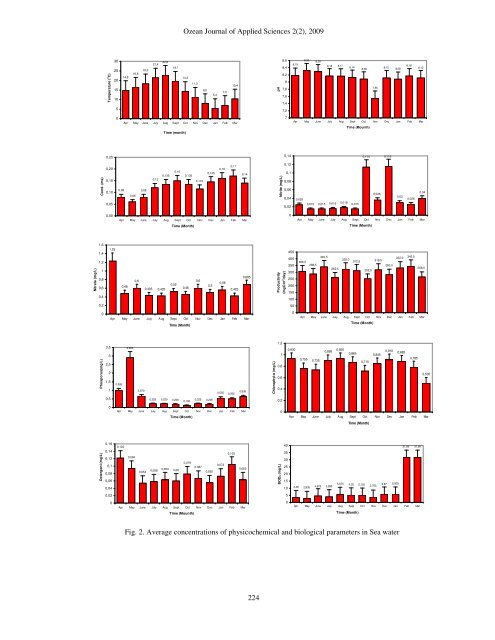
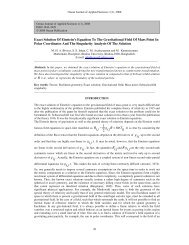
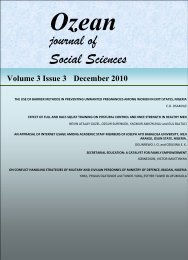
<strong>Ozean</strong> Journal of Applied Sciences 2(2), 2009Temperature ( o C)3025201510514,816,618,321,422,819,714,311,38,05,47,010,4pH8,68,48,287,87,67,47,28,198,328,298,188,178,148,097,558,128,088,188,120Apr May June July Aug Sept Oct Nov Dec Jan Feb MarTime (month)7Apr May June July Aug Sept Oct Nov Dec Jan Feb MarTime (Mounth)0,250,140,114 0,115Cond. (ms)0,200,150,100,050,080,060,080,120,1350,150,1350,1150,1450,160,170,14Nitrite (mg/L)0,120,10,080,060,040,020,0250,015 0,015 0,016 0,0180,0150,0360,030,0260,040,00Apr May June July Aug Sept Oct Nov Dec Jan Feb Mar0Apr May June July Aug Sept Oct Nov Dec Jan Feb MarTime (Month)Time (Month)Nitrate (mg/L)1,61,41,210,80,60,41,230,480,60,435 0,4250,520,460,60,50,560,4250,685Productivity(mgC/m 2 /day)450400350300250200150100306,5288,5340,5262,5325,0312,5318,5252,5332,0283,0343,5266,00,2500Apr May June July Aug Sept Oct Nov Dec Jan Feb MarTime (Month)0Apr May June July Aug Sept Oct Nov Dec Jan Feb MarTime (Month)Phosporus(mg/L)3,532,521,510,9952,9050,670 0,6350,555 0,505Chlorophyl-a (mg/L)1,210,80,60,40,9300,755 0,7350,8950,9300,8650,7150,8450,9100,8850,7850,5050,50,225 0,220 0,2000,1300,225 0,2050,20Apr May June July Aug Sept Oct Nov Dec Jan Feb MarTime (Month)0Apr May June July Aug Sept Oct Nov Dec Jan Feb MarTime (Month)Detergent (mg/L)0,160,140,120,10,080,060,040,1220,0940,0540,0580,063 0,060,0790,0670,0550,0730,1050,063BOD5 (mg/L)403530252015103,482,8354,6753,9955,6755,255,1553,7655,875,92531,8531,850,0250Apr May June July Aug Sept Oct Nov Dec Jan Feb MarTime (Mounth)0Apr May June July Aug Sept Oct Nov Dec Jan Feb MarTime (Month)Fig. 2. Average concentrations of physicochemical and biological parameters in Sea water224
<strong>Ozean</strong> Journal of Applied Sciences 2(2), 2009The difference of concentration of these two isomers in mussel tissues was related to a preferentialbiotransformation of benzo(a)pyrene, while benzo(e)pyrene was preferentially accumulated in the lipids.Several studies have described the induction of enzymatic systems involved in the depuration processes inmollusks such as mussels Mytilus sp. exposed to organic pollutants. In many studies, benzo(a)pyrene hasbeen shown to be carcinogenic in contrast to benzo(e)pyrene (Osborne and Crosby, 1987). Therefore, thegreater carcinogenicity of benzo(a)pyrene can be related to a preferential biotransformation of thiscompound and could explain the greater accumulation of benzo(e)pyrene relative to its structural isomer inmussel tissues.Neutral Red analysis in musselsThe capacity of cells to take up and retain neutral red after the exposure to a contaminant is used as ameasure of toxicant effect (Lowe, 1994). The reduced neutral red retention time is positively correlated withlevels of xenobiotics in tissue of mussels, proving its usefulness as an indirect indicator of environmentalquality (Castro 2004). The minimum and maximum lysosomal retention time in mussels was determined inJanuary and March 2002 and was found as 28.5 and 82.5 min, respectively (Figure 3). The lowest obtainedneutral red retention times (December - February) were comparable to those obtained in the mussels fromthe urban and industrial areas in Portugal (Castro 2004). The seasonal variability in the mussel neutral redretention time showed significant difference between summer and winter measurements. These differenceswere rather influenced by decrease in the levels of contaminants than seasonal variability.COD (mg/L)605040302017,85 18,7514,9511,95 11,05 10,6513,9017,3513,60 13,0047,1530,05FC ( MPN/100ml )3,532,521,511,6652,0142,422,174 2,2011,7691,6981,912 1,9121,7632,419100,50Apr May June July Aug Sept Oct Nov Dec Jan Feb MarTime (Month)0June July Aug Sept Oct Nov Dec Jan Feb Mar AprTime (Month)FS(MPN/100 mL)32,521,511,6251,5111,3421,722,3161,6351,4911,9422,2782,0631,498TC (MPN/100 mL)3,532,521,511,9912,4922,3511,9772,5212,0642,2782,6092,1482,5222,1740,50,50June July Aug Sept Oct Nov Dec Jan Feb Mar Apr0June July Aug Sept Oct Nov Dec Jan Feb Mar AprTime (Month)Time (Month)Fig.3. Average concentrations of physicochemical and biological parameters in Sea waterLinear regression and correlation of EOM and PAH concentrationsInterior standards as n-octadacene were used to determine the recovery during experiments. To determinethe quantity of chrysene, naphthalene, anthresene and benzo(a)pyrene, extraction results was injected to gaschromatography. From these results, the residence time and peak area was defined. The PAH standardconcentration, residence time, peak area and injected volume were shown in Table 6. The recoverypercentage in water and mussels samples was calculated. The efficiency of recovery from water and musselsamples during PAH analysis was changed found between 38.15 and 76.20% for water samples and 66.50and 88.12% for mussel samples. The efficiency of recovery from water and mussel samples during PAHanalysis was changed found between 38.15 and 76.20% for water samples and 66.50 and 88.12% for musselsamples.225