DC arc smelting of silicon: Is it technically feasible? - saimm
DC arc smelting of silicon: Is it technically feasible? - saimm
DC arc smelting of silicon: Is it technically feasible? - saimm

Create successful ePaper yourself
Turn your PDF publications into a flip-book with our unique Google optimized e-Paper software.
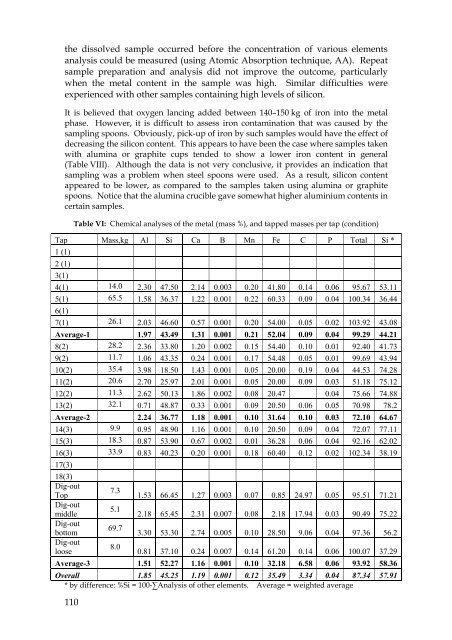
the dissolved sample occurred before the concentration <strong>of</strong> various elementsanalysis could be measured (using Atomic Absorption technique, AA). Repeatsample preparation and analysis did not improve the outcome, particularlywhen the metal content in the sample was high. Similar difficulties wereexperienced w<strong>it</strong>h other samples containing high levels <strong>of</strong> <strong>silicon</strong>.It is believed that oxygen lancing added between 140–150 kg <strong>of</strong> iron into the metalphase. However, <strong>it</strong> is difficult to assess iron contamination that was caused by thesampling spoons. Obviously, pick-up <strong>of</strong> iron by such samples would have the effect <strong>of</strong>decreasing the <strong>silicon</strong> content. This appears to have been the case where samples takenw<strong>it</strong>h alumina or graph<strong>it</strong>e cups tended to show a lower iron content in general(Table VIII). Although the data is not very conclusive, <strong>it</strong> provides an indication thatsampling was a problem when steel spoons were used. As a result, <strong>silicon</strong> contentappeared to be lower, as compared to the samples taken using alumina or graph<strong>it</strong>espoons. Notice that the alumina crucible gave somewhat higher aluminium contents incertain samples.110Table VI: Chemical analyses <strong>of</strong> the metal (mass %), and tapped masses per tap (cond<strong>it</strong>ion)Tap Mass,kg Al Si Ca B Mn Fe C P Total Si *1 (1)2 (1)3(1)4(1) 14.0 2.30 47.50 2.14 0.003 0.20 41.80 0.14 0.06 95.67 53.115(1) 65.5 1.58 36.37 1.22 0.001 0.22 60.33 0.09 0.04 100.34 36.446(1)7(1) 26.1 2.03 46.60 0.57 0.001 0.20 54.00 0.05 0.02 103.92 43.08Average-1 1.97 43.49 1.31 0.001 0.21 52.04 0.09 0.04 99.29 44.218(2) 28.2 2.36 33.80 1.20 0.002 0.15 54.40 0.10 0.01 92.40 41.739(2) 11.7 1.06 43.35 0.24 0.001 0.17 54.48 0.05 0.01 99.69 43.9410(2) 35.4 3.98 18.50 1.43 0.001 0.05 20.00 0.19 0.04 44.53 74.2811(2) 20.6 2.70 25.97 2.01 0.001 0.05 20.00 0.09 0.03 51.18 75.1212(2) 11.3 2.62 50.13 1.86 0.002 0.08 20.47 0.04 75.66 74.8813(2) 32.1 0.71 48.87 0.33 0.001 0.09 20.50 0.06 0.05 70.98 78.2Average-2 2.24 36.77 1.18 0.001 0.10 31.64 0.10 0.03 72.10 64.6714(3) 9.9 0.95 48.90 1.16 0.001 0.10 20.50 0.09 0.04 72.07 77.1115(3) 18.3 0.87 53.90 0.67 0.002 0.01 36.28 0.06 0.04 92.16 62.0216(3) 33.9 0.83 40.23 0.20 0.001 0.18 60.40 0.12 0.02 102.34 38.1917(3)18(3)Dig-outTopDig-outmiddleDig-outbottomDig-outloose7.35.169.78.01.53 66.45 1.27 0.003 0.07 0.85 24.97 0.05 95.51 71.212.18 65.45 2.31 0.007 0.08 2.18 17.94 0.03 90.49 75.223.30 53.30 2.74 0.005 0.10 28.50 9.06 0.04 97.36 56.20.81 37.10 0.24 0.007 0.14 61.20 0.14 0.06 100.07 37.29Average-3 1.51 52.27 1.16 0.001 0.10 32.18 6.58 0.06 93.92 58.36Overall 1.85 45.25 1.19 0.001 0.12 35.49 3.34 0.04 87.34 57.91* by difference: %Si = 100-∑Analysis <strong>of</strong> other elements. Average = weighted average