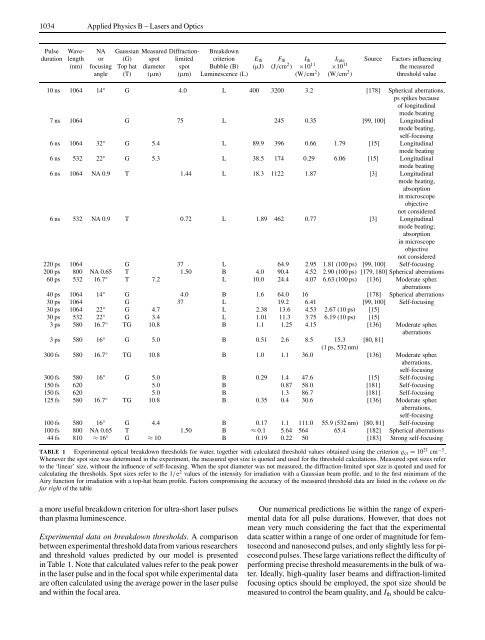
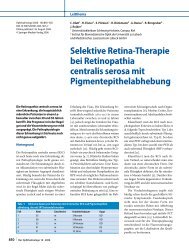
1034 Applied Physics B – Lasers and OpticsPulse Wave- NA Gaussian Measured Diffraction- Breakdownduration length or (G) spot limited criterion E th F th I th I rate Source Factors influencing(nm) focusing Top hat diameter spot Bubble (B) (µJ) (J/cm 2 ) ×10 11 ×10 11 the measuredangle (T) (µm) (µm) Luminescence (L) (W/cm 2 ) (W/cm 2 ) threshold value10 ns 1064 14 ◦ G 4.0 L 400 3200 3.2 [178] Spherical aberrations,ps spikes because<strong>of</strong> longitudinalmode beating7 ns 1064 G 75 L 245 0.35 [99, 100] Longitudinalmode beating,self-focusing6 ns 1064 32 ◦ G 5.4 L 89.9 396 0.66 1.79 [15] Longitudinalmode beating6 ns 532 22 ◦ G 5.3 L 38.5 174 0.29 6.06 [15] Longitudinalmode beating6 ns 1064 NA 0.9 T 1.44 L 18.3 1122 1.87 [3] Longitudinalmode beating,absorptionin microscopeobjectivenot considered6 ns 532 NA 0.9 T 0.72 L 1.89 462 0.77 [3] Longitudinalmode beating;absorptionin microscopeobjectivenot considered220 ps 1064 G 37 L 64.9 2.95 1.81 (100 ps) [99, 100] Self-focusing200 ps 800 NA 0.65 T 1.50 B 4.0 90.4 4.52 2.90 (100 ps) [179, 180] Spherical aberrations60 ps 532 16.7 ◦ T 7.2 L 10.0 24.4 4.07 6.63 (100 ps) [136] Moderate spher.aberrations40 ps 1064 14 ◦ G 4.0 B 1.6 64.0 16 [178] Spherical aberrations30 ps 1064 G 37 L 19.2 6.41 [99, 100] Self-focusing30 ps 1064 22 ◦ G 4.7 L 2.38 13.6 4.53 2.67 (10 ps) [15]30 ps 532 22 ◦ G 3.4 L 1.01 11.3 3.75 6.19 (10 ps) [15]3 ps 580 16.7 ◦ TG 10.8 B 1.1 1.25 4.15 [136] Moderate spher.aberrations3 ps 580 16 ◦ G 5.0 B 0.51 2.6 8.5 15.3 [80, 81](1 ps, 532 nm)300 fs 580 16.7 ◦ TG 10.8 B 1.0 1.1 36.0 [136] Moderate spher.aberrations,self-focusing300 fs 580 16 ◦ G 5.0 B 0.29 1.4 47.6 [15] Self-focusing150 fs 620 5.0 B 0.87 58.0 [181] Self-focusing150 fs 620 5.0 B 1.3 86.7 [181] Self-focusing125 fs 580 16.7 ◦ TG 10.8 B 0.35 0.4 30.6 [136] Moderate spher.aberrations,self-focusing100 fs 580 16 ◦ G 4.4 B 0.17 1.1 111.0 55.9 (532 nm) [80, 81] Self-focusing100 fs 800 NA 0.65 T 1.50 B ≈ 0.1 5.64 564 65.4 [182] Spherical aberrations44 fs 810 ≈ 16 ◦ G ≈ 10 B 0.19 0.22 50 [183] Strong self-focusingTABLE 1 Experimental optical breakdown thresholds for water, together with calculated threshold values obtained using the criterion ϱ cr = 10 21 cm −3 .Whenever the spot size was determined in the experiment, the measured spot size is quoted and used for the threshold calculations. Measured spot sizes referto the ‘linear’ size, without the influence <strong>of</strong> self-focusing. When the spot diameter was not measured, the diffraction-limited spot size is quoted and used forcalculating the thresholds. Spot sizes refer to the 1/e 2 values <strong>of</strong> the intensity for irradiation with a Gaussian beam pr<strong>of</strong>ile, and to the first minimum <strong>of</strong> theAiry function for irradiation with a top-hat beam pr<strong>of</strong>ile. Factors compromising the accuracy <strong>of</strong> the measured threshold data are listed in the column on thefar right <strong>of</strong> the tablea more useful breakdown criterion for ultra-short <strong>laser</strong> pulsesthan plasma luminescence.Experimental data on breakdown thresholds. A comparisonbetween experimental threshold data from various researchersand threshold values predicted by our model is presentedin Table 1. Note that calculated values refer to the peak powerin the <strong>laser</strong> pulse and in the focal spot while experimental dataare <strong>of</strong>ten calculated using the average power in the <strong>laser</strong> pulseand within the focal area.Our numerical predictions lie within the range <strong>of</strong> experimentaldata for all pulse durations. However, that does notmean very much considering the fact that the experimentaldata scatter within a range <strong>of</strong> one order <strong>of</strong> magnitude for <strong>femtosecond</strong>and nanosecond pulses, and only slightly less for picosecondpulses. These large variations reflect the difficulty <strong>of</strong>performing precise threshold measurements in the bulk <strong>of</strong> water.Ideally, high-quality <strong>laser</strong> beams and diffraction-limitedfocusing optics should be employed, the spot size should bemeasured to control the beam quality, and I th should be calcu-
VOGEL et al. <strong>Mechanisms</strong> <strong>of</strong> <strong>femtosecond</strong> <strong>laser</strong> <strong>nanosurgery</strong> <strong>of</strong> cells and tissues 1035lated using the measured spot size. However, in various studies,the quality <strong>of</strong> the <strong>laser</strong> beam and focusing optics were farfrom optimal and, nevertheless, the diffraction-limited spotsize has been used for the calculation <strong>of</strong> I th . In the presence <strong>of</strong>aberrations, this leads to erroneously large threshold values.Even when the spot size is measured, aberrations will lead t<strong>of</strong>alse results because breakdown occurs in hot spots within thefocal region that are smaller than the measured spot size. Thethreshold values determined in this way are, therefore, smallerthan the actual values [184]. Many breakdown experimentswere performed by focusing a <strong>laser</strong> beam into a glass cellby means <strong>of</strong> external focusing optics. Even when this opticsis <strong>of</strong> high quality, the glass cell itself will introduce sphericalaberrations. This source <strong>of</strong> error can be avoided by usingwater-immersion microscope objectives built into the wall <strong>of</strong>the cell [3].For nanosecond pulses, longitudinal mode beating in the<strong>laser</strong> resonator will usually produce intensity spikes <strong>of</strong> picosecondduration with amplitudes up to 4–5 times as large asthe averaged intensity. Such statistical fluctuations <strong>of</strong> the peakirradiance are a major cause <strong>of</strong> the wide statistical distribution<strong>of</strong> optical breakdown thresholds and substantially reducetheir absolute values [185, 186]. Therefore, single-frequency<strong>laser</strong>s providing a temporally Gaussian pulse shape shouldbe used for threshold measurements. However, to date allmeasurements <strong>of</strong> nanosecond optical breakdown thresholdsin water have been performed with longitudinally multimode<strong>laser</strong> beams.To avoid a change <strong>of</strong> the focal spot size by nonlinearbeam propagation, sufficiently large focusing angles must beused [5, 15, 187]. While this is easy to achieve for nanosecondpulses, a numerical <strong>aper</strong>ture NA ≥ 0.9 is required fora pulse duration <strong>of</strong> 100 fs to be sure to exclude a diminution<strong>of</strong> the spot size by self-focusing and the corresponding apparentreduction <strong>of</strong> the breakdown threshold [5]. To date, nothreshold data obtained with such large NAs are available forultra-short <strong>laser</strong>-induced breakdown in water. We must concludethat the present experimental data basis is not reliableenough to perform a thorough comparison with theoreticalpredictions. Future measurements with aberration-free temporallyGaussian <strong>laser</strong> pulses focused at large NA will have t<strong>of</strong>ill this gap.In addition, a better adjustment <strong>of</strong> the numerical breakdowncriterion to the experimental criterion <strong>of</strong> bubble formationis needed to enable a meaningful comparison <strong>of</strong> experimentaldata with model predictions. While bubble formationrequires an approximately constant energy density within thefocal volume for all <strong>laser</strong> pulse durations and wavelengths,the energy density associated with a fixed value <strong>of</strong> the freeelectrondensity, such as ϱ cr = 10 21 cm −3 , varies considerablywith pulse duration. Thus, the assumption <strong>of</strong> a constant freeelectrondensity as breakdown criterion is quite arbitrary, especiallyfor cases where the threshold is smooth, i.e. whereϱ max increases continuously with irradiance. In these casesit seems more reasonable to relate the critical free-electrondensity to the energy density within the medium that leadsto bubble formation. Equation (17) provides the required linkbetween electron and energy densities, and an analysis <strong>of</strong>ϱ max (I/I rate ) curves (Figs. 3 and 5) then yields the correspondingthreshold irradiance.The new threshold definition for the numerical model willyield a better match between the experimentally observedand numerically predicted wavelength dependence <strong>of</strong> breakdownthresholds than the values in Table 1. Experimentally,the thresholds for ns and ps pulses decrease with decreasingwavelength [3, 15], but values calculated with a constant ϱ crshow the opposite trend. Previous calculations revealed a relativelysmooth threshold for ns and ps breakdown with visibleand UV wavelengths, in contrast to the sharp threshold forIR wavelengths shown in Fig. 3c [91]. Calculated thresholdvalues based on the new definition will for IR wavelengthsthus be the same as those obtained with ϱ cr = 10 21 cm −3 ,butthey will be lower for visible and UV wavelengths, in accordwith experimental observations.6.4 Cavitation bubble dynamicsFigure 18 shows a two-dimensional representation<strong>of</strong> the evolution <strong>of</strong> the thermoelastic stress wave and <strong>of</strong> theregion in which the kinetic spinodal is surpassed (bubble nucleus)for a peak temperature <strong>of</strong> 200 ◦ C, slightly above thethreshold for bubble formation. The subsequent bubble dynamicscalculated for cases 1 and 2 described in Sect. 6.1 ispresented in Fig. 19. It turned out that for a vapor pressurethat changes adiabatically with bubble size (case 2 in Fig. 19b)the bubble motion is very similar to the case where the vaporpressure is not taken into account at all and only the negativepressurepulse drives the bubble expansion (not shown). Figure20 shows the maximum bubble radii for case 1 and case2 as a function <strong>of</strong> the maximum temperature achieved in thecenter <strong>of</strong> the focal volume, together with the radius <strong>of</strong> the nucleus,R 0 . Close to threshold, the actual bubble radius willprobably resemble case 1 in which the bubble nucleus is assumedto be much smaller than the focal region. For energieswell above threshold, the predictions obtained for case 2 becomemore realistic.The most prominent feature <strong>of</strong> the transient bubbles producedclose to the threshold <strong>of</strong> <strong>femtosecond</strong> optical breakdownis their small size and short lifetime. The bubble radiusamounts to only about 200 nm in water, and will be evensmaller in a visco-elastic medium such as the cytoplasm. Thismakes a dissection mechanism associated with bubble formationcompatible with intracellular <strong>nanosurgery</strong>, in contrastto nanosecond optical breakdown (τ L = 6ns,λ= 1064 nm)where the smallest bubble radius in water observed for NA =0.9 was R max = 45 µm [3]. The small bubble size correspondsto a small energy,E B = 4π 3 (p ∞ − p v )R 3 max , (21)<strong>of</strong> the expanded bubble. For the case presented in Fig. 19a, itamounts to 5.3 × 10 −15 J (5.3 femtojoules). The smallness <strong>of</strong>the bubble energy is largely due to the small energy content <strong>of</strong>the stress transient creating the bubble. This energy is equal tothe energy stored in thermoelastic compression <strong>of</strong> the heatedfluid volume [156],E TE = 12ϱ 0 c 2 0∫p 2 0 dV , (22)