Invited p aper Mechanisms of femtosecond laser nanosurgery of ...
Invited p aper Mechanisms of femtosecond laser nanosurgery of ...
Invited p aper Mechanisms of femtosecond laser nanosurgery of ...

You also want an ePaper? Increase the reach of your titles
YUMPU automatically turns print PDFs into web optimized ePapers that Google loves.
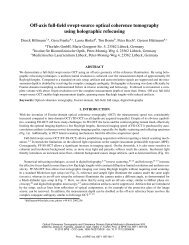
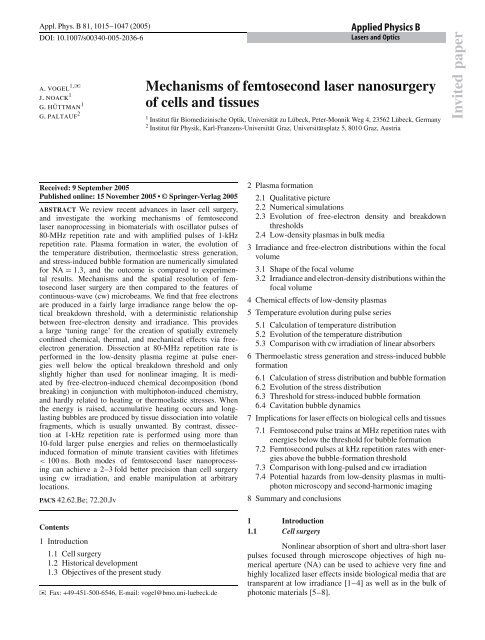
1018 Applied Physics B – Lasers and Optics<strong>laser</strong> (λ = 800 nm). Whenever possible, the findings <strong>of</strong> the numericalsimulations are compared to experimental results.The numerical calculations yield threshold values <strong>of</strong> the irradianceabove which chemical changes in the focal region,a considerable temperature rise, and bubble formation are expectedto occur. We found two different mechanisms <strong>of</strong> bubbleformation: at repetition rates in the MHz range, fairly largelong-lasting bubbles containing non-condensable gas can beformed by plasma-mediated accumulative heating and chemicaldisintegration <strong>of</strong> biomolecules. At lower repetition rates,transient bubbles with lifetimes below 100 ns are created bythermoelastic stresses. Due to the thermoelastic origin <strong>of</strong> bubbleformation, the conversion efficiency from absorbed <strong>laser</strong>light energy into bubble energy is low, enabling the creation <strong>of</strong>spatially extremely confined disruptive effects.A comparison between experimental parameters used forcell surgery and our numerical results revealed two differentmodes <strong>of</strong> <strong>femtosecond</strong> <strong>laser</strong> <strong>nanosurgery</strong>: dissection usinglong pulse trains at MHz repetition rates is mediated byfree-electron-induced chemical decomposition (bond breaking)and not related to heating or thermoelastic stresses. Withthis dissection mode, bubble formation needs to be avoidedbecause the relatively large and long-lasting bubbles causedislocations far beyond the <strong>laser</strong> focus. By contrast, intracellulardissection at moderate (kHz) repetition rates relies onthe thermoelastically induced formation <strong>of</strong> minute transientcavities. Both modes <strong>of</strong> <strong>femtosecond</strong> <strong>laser</strong> nanoprocessing <strong>of</strong>biomaterials achieve a better precision than cell surgery usingcw irradiation.Femtosecond-<strong>laser</strong>-produced low-density plasmas arethus a versatile tool for the manipulation <strong>of</strong> transparent biologicalmedia and other transparent materials such as glass.However, they may also be a potential source <strong>of</strong> damage inmultiphoton microscopy and higher-harmonic imaging.2 Plasma formation2.1 Qualitative pictureter. Whereas the optical breakdown in gases leads to thegeneration <strong>of</strong> free electrons and ions, it must be noted thatin condensed matter electrons are either bound to a particularmolecule or they are ‘quasi-free’ if they have sufficientkinetic energy to be able to move without being capturedby local potential energy barriers. Transitions betweenbound and quasi-free states are the equivalent <strong>of</strong> ionization<strong>of</strong> molecules in gases. To describe the breakdown processin water, Sacchi [100] has proposed that water should betreated as an amorphous semiconductor and the excitation energy∆ regarded as the energy required for a transition fromthe molecular 1b 1 orbital into an excitation band (band gap6.5eV) [101–103]. We follow this approach. For simplicity,we will use the terms ‘free electrons’ and ‘ionization’ as abbreviationsfor ‘quasi-free electrons’ and ‘excitation into theconduction band’. Nonlinear absorption <strong>of</strong> liquid water actuallynot only involves ionization but also dissociation <strong>of</strong> thewater molecules [103], but in our model dissociation is neglectedto reduce the complexity <strong>of</strong> the numerical code.The photon energies at the wavelengths <strong>of</strong> 1064 nm,800 nm, 532 nm, and355 nm investigated in this study are1.17 eV, 1.56 eV, 2.34 eV, and 3.51 eV, respectively. Thismeans that the energy <strong>of</strong> six, five, three, and two photons,respectively, is required to overcome the band-gap energy∆ = 6.5eV. The excitation energy into the conductionband can be provided either by photoionization (multiphotonionization or tunneling [104, 105]) or by impact ionization[106–109]. In previous breakdown models, it was <strong>of</strong>tenassumed that a free electron could be produced as soon as∆ was exceeded either by the sum <strong>of</strong> the simultaneously absorbedphotons or by the kinetic energy <strong>of</strong> an impacting freeelectron [81, 110–112]. However, for very short <strong>laser</strong> pulseswhere breakdown occurs at large irradiance values, the bandgapenergy has to be replaced by the effective ionizationpotential to account for the oscillation energy <strong>of</strong> the electrondue to the electrical <strong>laser</strong> field. The ionization potential <strong>of</strong>individual atoms is [104]The process <strong>of</strong> plasma formation through <strong>laser</strong>inducedbreakdown in transparent biological media is schematicallydepicted in Fig. 1. It essentially consists <strong>of</strong> the formation<strong>of</strong> quasi-free electrons by an interplay <strong>of</strong> photoionizationand avalanche ionization.It has been shown experimentally that the optical breakdownthreshold in water is very similar to that in ocularand other biological media [99]. For convenience, we shalltherefore focus attention on plasma formation in pure wa-˜∆ = ∆ + e2 F 24mω 2 , (1)where ω and F denote the circular frequency and amplitude<strong>of</strong> the electrical <strong>laser</strong> field, e is the electron charge, and1/m = 1/m c + 1/m v is the exciton reduced mass that is givenbytheeffectivemassesm c <strong>of</strong> the quasi-free electron in theconduction band and m v <strong>of</strong> the hole in the valence band. Thesecond term in (1) can be neglected in nanosecond opticalFIGURE 1 Interplay <strong>of</strong> photoionization, inverse Bremsstrahlungabsorption, and impact ionization in the process<strong>of</strong> plasma formation. Recurring sequences <strong>of</strong> inverseBremsstrahlung absorption events and impact ionization leadto an avalanche growth in the number <strong>of</strong> free electrons. Therequirements to satisfy the conservation laws for energy andmomentum in impact ionization, and their consequences forplasma formation, are discussed in the text
VOGEL et al. <strong>Mechanisms</strong> <strong>of</strong> <strong>femtosecond</strong> <strong>laser</strong> <strong>nanosurgery</strong> <strong>of</strong> cells and tissues 1019breakdown, but must be considered in <strong>femtosecond</strong> opticalbreakdown where F is orders <strong>of</strong> magnitude larger.Multiphoton ionization (MPI) and tunneling are the mechanismsgoverning photoionization for different field strengthsand frequencies <strong>of</strong> the electromagnetic field. In his classicalp<strong>aper</strong> [104], Keldysh introduced a parameter γ = ω/ω tto distinguish tunneling and MPI regimes. Here 1/ω t standsfor the tunneling time through the atomic potential barrier,which is inversely proportional to the strength <strong>of</strong> the electromagneticfield. For values γ ≪ 1 as obtained with lowfrequencies and large field strengths tunneling is responsiblefor ionization, while for values γ ≫ 1 typical for optical frequenciesand moderate field strengths the probability <strong>of</strong> MPIis much higher than that <strong>of</strong> tunneling. However, <strong>femtosecond</strong>optical breakdown requires very high field strengths forwhich the tunneling time through the atomic potential barrieris extremely short, leading to values γ
1020 Applied Physics B – Lasers and Opticscombined the Keldysh theory with Thornber’s model <strong>of</strong>avalanche ionization [107]. Since the numerical model usedby Kaiser et al. [113] and Rethfeld [115] is very complex, weconsider the time constraints in cascade ionization by simplyintroducing a retarded time for the calculation <strong>of</strong> the cascadeionization rates, as described in Sect. 2.2.To obtain a better understanding <strong>of</strong> the mechanisms <strong>of</strong>cell surgery using <strong>femtosecond</strong> pulses, we are interested inthe plasmas below and slightly above the optical breakdownthreshold. It is evident that a precise delineation <strong>of</strong> the correspondingirradiance range requires a clear definition <strong>of</strong> thebreakdown threshold. When nano- and picosecond pulsesare employed, optical breakdown is accompanied by the formation<strong>of</strong> a luminous plasma and followed by shock-waveemission and cavitation [15, 96]. At these pulse durations,the plasma luminescence usually serves as an experimentalbreakdown criterion [3, 15]. With shorter <strong>laser</strong> pulses, thereis no plasma luminescence in the visible region <strong>of</strong> the spectrum,and breakdown in aqueous media is usually detected byobserving the formation <strong>of</strong> a cavitation bubble [81, 122]. Bycontrast, in theoretical investigations the breakdown thresholdis defined by the irradiance (or energy) required to producea certain critical free-electron density ϱ cr at the <strong>laser</strong> focus.Mostly, the electron densityϱ ′ cr = ω2 m cε 0e 2 , (3)above which the plasma becomes both strongly reflective andabsorbing, is used as breakdown criterion [18, 112, 113, 116,123]. Here ε 0 denotes the vacuum dielectric permittivity. Thecritical electron density ϱ ′ cr amounts to 0.984 × 10 21 cm −3for λ = 1064 nm, to3.94 × 10 21 cm −3 for λ = 532 nm, andto 8.86 × 10 21 cm −3 for 355 nm, respectively. We use a freeelectrondensity <strong>of</strong> ϱ cr = 10 21 cm −3 as breakdown criterionin our numerical simulations <strong>of</strong> plasma formation. A constantvalue was chosen because the experimental thresholdcriterion (bubble formation) relates to a fixed value <strong>of</strong> theplasma energy density. In Sect. 6.3, threshold values obtainedon this basis will be compared with experimentaldata and calculated values for the onset <strong>of</strong> stress-inducedbubble formation.Since all calculations are performed for a numerical <strong>aper</strong>ture<strong>of</strong> NA = 1.3, nonlinear propagation effects in the biologicalmedium can be neglected in the simulations <strong>of</strong> plasmaformation, even for pulse durations as short as 100 fs, becauseSchaffer et al. showed that these nonlinear effects influencethe breakdown threshold only for NA < 0.9 [5]. For NA > 0.9,self-focusing and filamentation may play a role well above thebreakdown threshold, but are not relevant for the pulse energiesused in <strong>nanosurgery</strong> on cells.In this study, we restrict the modeling to optical breakdownin pure water. In real biological media, the band structure<strong>of</strong> water is modified by the presence <strong>of</strong> biomoleculesin physiological solution with additional energy levels thatmay enhance both linear and nonlinear absorption processes.These modifications may lead to a lower threshold for plasmamediated<strong>laser</strong> ablation and dissection, especially when exogeneouslinearly absorbing dyes are used [37, 49, 54, 76, 77].The consideration <strong>of</strong> these modifications will be the topic<strong>of</strong> future work.2.2 Numerical simulationsThe time evolution <strong>of</strong> the electron density ϱ c in theconduction band under the influence <strong>of</strong> the <strong>laser</strong> light was calculatedusing a rate equation <strong>of</strong> the generic form [81]dϱdt = η photo + η casc ϱ c − η diff ϱ c − η rec ϱ 2 c . (4)The first term represents the production <strong>of</strong> free electrons mediatedby the strong electric field in the <strong>laser</strong> focus (photoionizationvia multiphoton and tunneling ionization), the secondterm represents the contribution <strong>of</strong> cascade ionization, and thelast two terms describe the losses through diffusion <strong>of</strong> electronsout <strong>of</strong> the focal volume and recombination. The cascadeionization rate η casc and the diffusion loss rate η diff are proportionalto the number <strong>of</strong> already produced free electrons, whilethe recombination rate η rec is proportional to ϱ 2 c ,asitinvolvesan interaction between two charged particles (an electron–hole pair). Even though diffusion and recombination do notplay a significant role during <strong>femtosecond</strong> <strong>laser</strong> pulses, theywere included to enable a comparison with plasma formationby nanosecond pulses.The temporal evolution <strong>of</strong> the electron density, ϱ(t), wascalculated for <strong>laser</strong> pulses with a Gaussian time variation [81],focused into pure water at a numerical <strong>aper</strong>ture <strong>of</strong> NA =1.3. At room temperature the initial steady-state free-electrondensity in the conduction band resulting from the Boltzmanndistribution is negligible. Thus, the steady-state electron densityin the ground state corresponds to the total electron densityϱ v = 6.68 × 10 23 cm −3 [110]. For photon energies below theionization potential, free electrons have to be generated bymultiphoton or tunnel ionization. The time-averaged ionizationrate for a field with angular frequency ω and intensity Iacting on an electron density ϱ v − ϱ c in the ground state wasderived by Keldysh [104] to be( ) dϱc= 2ωdt photo 9π( )˜∆× Q γ,hω[ ( )γ× K √1 + γ2(√ ) 3/21 + γ2mωγ h{ 〈 〉 ˜∆× (ϱ v − ϱ c ) exp −πhω + 1 ( )] / (γ− E √ E1 + γ21√1 + γ2)}where( )Q(γ, x) = √ 1π/2K √1 + γ 2{ [ ( ) ( )]∞∑γγ× exp −πl K √ −E √l=01 + γ2 1 + γ2/ ( )} ⎧ [1⎨E √ × Φ π (2 〈x + 1〉− 2x +l)1 + γ2 ⎩/ ( ) ( )] ⎫ 1/211 ⎬2K √ E √1 + γ2 1 + γ2 ⎭ . (5),
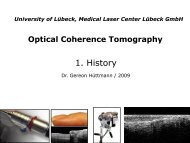
VOGEL et al. <strong>Mechanisms</strong> <strong>of</strong> <strong>femtosecond</strong> <strong>laser</strong> <strong>nanosurgery</strong> <strong>of</strong> cells and tissues 1021Here 〈x〉 represents the integer part <strong>of</strong> the number x, K() andE() denote elliptic integrals <strong>of</strong> the first and second kinds, andΦ() denotes the Dawson probability integral∫ zΦ(z) =0exp ( y 2 − x 2) dy . (6)The Keldysh parameter γ and the effective ionization potential˜∆ for creating an electron–hole pair in condensed matterexhibiting a band structure are given byγ = ω √cε0 m∆and ˜∆ = 2 √ ( )1 + γe 4Iπ ∆ 21E √ . (7)γ 1 + γ2Some authors [110, 113, 115, 120] used the expression in (1)for the ionization potential <strong>of</strong> individual atoms to describephotoionization in condensed matter instead <strong>of</strong> the more adequateequation (7), which Keldysh derived for solids. Forγ ≫ 1, (5) reduces to the expression for multiphoton ionizationused in [81, 110], and the ionization potential can beapproximated by the band-gap energy ∆. Under these circumstancesthe photoionization rate shows an intensity dependenceproportional to I k , k representing the number <strong>of</strong>photons required to cross the band gap.Figure 2 shows the calculated ionization rate for 780 nmas a function <strong>of</strong> the Keldysh parameter calculated with thecomplete model in (5) and with various approximations. Forvalues γ ≪ 1, the Keldysh multiphoton approximation predictsphotoionization rates that are too low by several orders <strong>of</strong>magnitude, while the predictions <strong>of</strong> Kennedy’s multiphotonapproximation [81, 110] are by several orders <strong>of</strong> magnitudetoo large.As soon as free electrons exist in the interaction volume,they gain kinetic energy through inverse Bremsstrahlung absorption<strong>of</strong> photons and can generate further free electronsthrough impact ionization once their energy exceeds the criticalenergy described by (2). As explained above, we assumethat the average gain <strong>of</strong> kinetic energy by each electron requiredto cause an impact ionization event is E = (3/2) ˜∆.Theionization rate per electron participating in the cascade is thenFIGURE 2 Nonlinear photoionization rate for water at λ = 780 nm calculatedwith the complete Keldysh model (pink), with Keldysh’s approximationsin the tunnel limit (green) and the multiphoton limit (violet), and withKennedy’s approximation in the multiphoton limit (blue) [81, 110]given by [110][1 e 2 τη =ω 2 τ 2 + 1 cn 0 ε 0 m c (3/2) ˜∆ I − m cω 2 ]τ, (8)Mwhere τ is the time between collisions, c the vacuum speed <strong>of</strong>light, and n 0 the refractive index <strong>of</strong> the medium at frequencyω. The masses <strong>of</strong> the electron and the water molecule are mand M, respectively. For large irradiances, the cascade ionizationrate is proportional to I.Two aspects must still be considered to accurately determinethe cascade contribution to the free-electron density.First, at least one free ‘seed’ electron produced by photoionizationis required for the start <strong>of</strong> the cascade. Therefore,cascade ionization is only considered if there is at leasta 50% probability <strong>of</strong> having this start electron in the focalvolume. Second, it must be taken into account that inverseBremsstrahlung absorption requires a finite time τ ion = τn,which is determined by the mean free time τ (1.7fs[118]) betweenelectron/molecule collisions and the number n <strong>of</strong> photonsthat must be absorbed to gain sufficient energy. Therefore,the contribution <strong>of</strong> cascade ionization at time t must beevaluated using the electron density created at time t ret = t −t ion . A first-order approximation <strong>of</strong> this retardation <strong>of</strong> the cascadeleads to the expression( ) { ηdϱc=1+ηt retϱ c for ϱ c V ≥ 0.5 ,(9)dt 0 forϱcascc V < 0.5 .Free electrons are lost in the interaction volume by diffusionout <strong>of</strong> the volume V and through recombination. The focalvolume was assumed to be ellipsoidal, which corresponds toillumination <strong>of</strong> the rear <strong>aper</strong>ture <strong>of</strong> the microscope objectivewith a plane wave, as will be discussed in Sect. 3.1. Thus,V = (4/3)πa 2 b,wherea and b are the short and long half-axes<strong>of</strong> the ellipsoidal free-electron distribution described by (16),below. The resulting (negative) ionization rate due to diffusionis [110, 124]( ) dϱc=− τE avdt diff 3mΛ 2 × ϱ c =− τ5 [˜∆ 66m c a 2 + 2 ]b 2 × ϱ c , (10)where E av is the average kinetic energy <strong>of</strong> the free electronsand Λ is the characteristic diffusion length. Free electronsproduced by impact ionization possess, on average, a startenergy <strong>of</strong> (1/2) ˜∆ and produce another free electron throughcollisional ionization when they reach a kinetic energy <strong>of</strong>2 ˜∆. Thus, their mean kinetic energy is (5/4) ˜∆, leading tothe expression on the right-hand side <strong>of</strong> (10). For the recombinationrate, we used an empirical value that was determinedby Docchio through inspection <strong>of</strong> the decay <strong>of</strong> theplasma luminescence [125]:( ) dϱc=−2 × 10 −9 cm 3 /s × ϱ 2 cdt. (11)recIn reality, recombination <strong>of</strong> free electrons in water is not a onestepprocess but consists in hydration <strong>of</strong> the electron withinabout 300 fs and subsequent decay <strong>of</strong> the hydrated state thathas an average lifetime <strong>of</strong> ≈ 300 ns [103].
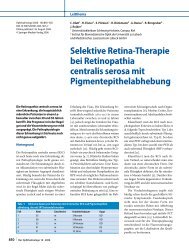
1022 Applied Physics B – Lasers and OpticsTo obtain the evolution <strong>of</strong> the free-electron density duringa Gaussian <strong>laser</strong> pulse[ ( ) ]t2I(t) = I 0 exp −4ln2 , (12)τ Lthe total rate equation( )dϱ c dϱc=+dt dtphoto( ) dϱc+dt casc( ) dϱc+dt diff( ) dϱcdt rec(13)was solved numerically for various <strong>laser</strong> pulse peak intensitiesI using a Runge–Kutta method with adaptive step-sizecontrol. Separate book-keeping was used for the contribution<strong>of</strong> (5) to evaluate the influence <strong>of</strong> multiphoton and cascadeionization. The breakdown threshold is defined as the irradianceI rate required to produce a maximum electron densityϱ max during the <strong>laser</strong> pulse that equals the critical densityϱ cr = 10 21 cm −3 . Besides the time evolution <strong>of</strong> the electrondensity, we also assessed the dependence <strong>of</strong> the maximumelectron density on irradiance, by calculating ϱ max asa function <strong>of</strong> I/I rate .2.3 Evolution <strong>of</strong> free-electron densityand breakdown thresholdsThe top row <strong>of</strong> Fig. 3 presents the evolution <strong>of</strong> thefree-electron density ϱ c during the <strong>laser</strong> pulse at the opticalbreakdown threshold for 6-ns, 1064-nm pulses, and for100-fs, 800-nm pulses. To facilitate a comparison betweenthe different pulse durations, the time t is normalized withthe respective <strong>laser</strong> pulse duration τ L . The contribution <strong>of</strong>photoionization to the total free-electron density is plotted asa dotted line. The bottom row <strong>of</strong> Fig. 3 shows how the maximumfree-electron density achieved during the <strong>laser</strong> pulsedepends on irradiance.It is obvious that the dynamics <strong>of</strong> plasma formation isextremely different for nanosecond and <strong>femtosecond</strong> pulses.With nanosecond pulses, no free electrons are formed forirradiance values below the optical breakdown threshold becausethe irradiance is too low to provide seed electrons bymeans <strong>of</strong> multiphoton ionization (Fig. 3c). Once the irradianceis high enough to provide a seed electron, the ionizationcascade can start. It proceeds very rapidly owing to the highirradiance (Fig. 3a). The electron density shoots up by nineorders <strong>of</strong> magnitude within a small fraction <strong>of</strong> the <strong>laser</strong> pulseduration until its rise is stopped by recombination, which isproportional to ϱ 2 c . The breakdown threshold is, hence, extremelysharp – either a highly ionized plasma is produced,or no plasma at all. These numerical predictions are supportedby the experimental observation that at the threshold<strong>of</strong> nanosecond optical breakdown with IR <strong>laser</strong> pulsesthe transmission <strong>of</strong> the focal volume drops abruptly to lessthan 50% <strong>of</strong> the value without plasma formation [126, 127].The transmission loss for shorter pulse durations is muchless abrupt [80, 126–128].With <strong>femtosecond</strong> pulses, a much higher irradiance is necessaryfor optical breakdown to be completed during the<strong>laser</strong> pulse duration than with nanosecond pulses. This favorsthe generation <strong>of</strong> free electrons through multiphoton ionizationbecause <strong>of</strong> its stronger irradiance dependence – ∝ I k asopposed to ∝ I for the cascade ionization rate (see Sect. 2.2).While with nanosecond pulses the total number <strong>of</strong> free electronsgenerated through avalanche ionization is 10 9 timeslarger than the number generated through multiphoton ionization(Fig. 3a), it is only 12 times larger with 100-fs pulses at800 nm (Fig. 3b). As a consequence <strong>of</strong> the increasing importance<strong>of</strong> multiphoton ionization with shorter pulse durations,there is never a lack <strong>of</strong> seed electrons for avalanche ionization.An avalanche is initiated at irradiance values considerablylower than the breakdown threshold. The free-electron densityreached at the end <strong>of</strong> the avalanche depends on irradianceFIGURE 3 Top row: evolution <strong>of</strong> the free-electrondensity during the <strong>laser</strong> pulse at the optical breakdownthreshold for 6-ns, 1064-nm pulses and for 100-fs,800-nm pulses. The time t is normalized with respectto the <strong>laser</strong> pulse duration τ L . The contribution <strong>of</strong> multiphotonionization to the total free-electron density isplotted as a dotted line. Bottom row: maximum freeelectrondensity ϱ max achieved during the <strong>laser</strong> pulseas a function <strong>of</strong> irradiance, for the same <strong>laser</strong> parameters.The irradiance I is normalized with respect tothe threshold irradiance I rate . The threshold I rate andthe corresponding value <strong>of</strong> ϱ max are marked by dashedlines
VOGEL et al. <strong>Mechanisms</strong> <strong>of</strong> <strong>femtosecond</strong> <strong>laser</strong> <strong>nanosurgery</strong> <strong>of</strong> cells and tissues 1023in a much smoother way (Fig. 3d) than for ns pulses (Fig. 3c).Therefore, one can generate any desired free-electron densityby selecting an appropriate irradiance value.Figure 4 presents threshold values for irradiance, I rate ,andradiant exposure, F rate = I rate × τ L , required to reach a criticalfree-electron density <strong>of</strong> ϱ cr = 10 21 cm −3 . The thresholds werecalculated for various wavelengths and pulse durations rangingfrom 10 fs to 10 ns. Two regimes can be distinguished: forτ L < 10 ps, the threshold radiant exposure F rate exhibits onlya weak dependence on pulse duration. This reflects the factthat recombination plays only a minor role during ultra-short<strong>laser</strong> pulses. Therefore, only one set <strong>of</strong> free electrons is producedthat corresponds to an approximately constant energydensity within the focal volume. This is in accordance with theexperimental threshold criterion <strong>of</strong> bubble formation that requiresa specific energy density, which varies little with <strong>laser</strong>parameters. By contrast, for longer pulses more than one set<strong>of</strong> free electrons is produced and they recombine during the<strong>laser</strong> pulse. Here it is the threshold irradiance I rate that remainsapproximately constant, because a minimum irradiance is requiredto provide the seed electrons for the ionization cascadeby multiphoton ionization and to drive the cascade sufficientlyfast to reach the critical free-electron density within the <strong>laser</strong>pulse duration. As a consequence <strong>of</strong> the constant threshold irradiance,the radiant exposure threshold and plasma energydensity increase steeply with increasing pulse duration.The predicted form <strong>of</strong> the F rate (τ L ) dependence qualitativelymatches experimental observations <strong>of</strong> the pulsedurationdependence <strong>of</strong> single-shot damage thresholds at surfaces<strong>of</strong> transparent large-band-gap dielectrics [112, 129] andablation thresholds <strong>of</strong> corneal tissue [13, 130]. However, studiesin which single-shot thresholds at longer pulse durationsare mixed with multiple-shot thresholds at ultra-short durationsshow a steeper F rate (τ L ) dependence for τ L < 10 ps bothin corneal tissue [131, 132] and dielectrics [116, 123]. Thelower thresholds with multiple exposures are due to accumulativeeffects, the possibility <strong>of</strong> which is explained by thesmooth ϱ max (I/I rate ) dependence shown in Fig. 3d.The predicted wavelength dependence in the picosecondand nanosecond regimes (increasing threshold with decreasingwavelength) seems to be a little surprising at first sight,because multiphoton processes occur more easily at shorterwavelengths. However, one needs to keep in mind that the cascadeionization rate increases approximately proportionally tothe square <strong>of</strong> the <strong>laser</strong> wavelength, as evident from (8).2.4 Low-density plasmas in bulk mediaFIGURE 4 Calculated optical breakdown thresholds (ϱ cr = 10 21 cm −3 )asa function <strong>of</strong> <strong>laser</strong> pulse duration for various <strong>laser</strong> wavelengths. (a) Irradiancethresholds, (b) radiant exposure thesholdsOur numerical calculations for <strong>femtosecond</strong> breakdownin bulk transparent media indicate that it is possible tocreate low-density plasmas in which the energy density remainsbelow the level that leads to cavity formation in themedium. Experimental evidence for the existence <strong>of</strong> lowdensityplasmas was recently provided by Mao et al. [18]through measurements <strong>of</strong> the free-electron density in MgOand SiO 2 . Free electrons are produced in a fairly large irradiancerange below the optical breakdown threshold, witha deterministic relationship between free-electron density andirradiance. Low-density plasmas thus <strong>of</strong>fer the possibility todeliberately produce chemical changes, heating, and thermomechanicaleffects by varying the irradiance. These effects arevery well localized because <strong>of</strong> the nonlinearity <strong>of</strong> the plasmaformationprocess, which, for sufficiently small irradiances,allows us to produce a plasma in a volume that is smaller thanthe diffraction-limited focus.For larger irradiances, plasmas in bulk media grow beyondthe region <strong>of</strong> the beam waist, which is not possible forplasma formation at surfaces [116, 120, 121]. At surfaces, theenergy deposition becomes confined to a thin layer <strong>of</strong> less than100-nm thickness once the free-electron density reaches thecritical density, because the superficial plasma layer is highlyabsorbing and reflecting [116, 121, 133–135]. By contrast, inbulk media there is no restriction for the region <strong>of</strong> opticalbreakdown to spread towards the incoming <strong>laser</strong> beam withincreasing irradiance. At large irradiances, breakdown startsto occur before the <strong>femtosecond</strong> pulse reaches the beam waist,and both irradiance and beam propagation are influenced bythe plasma generation [21, 136]. These effects shield the focalregion, enlarge the size <strong>of</strong> the breakdown region, and limitthe free-electron density and energy density reached in the entirebreakdown volume [21, 80, 137–139]. Low-density plasmascan, therefore, easily be produced in bulk media whileat surfaces the self-induced confinement <strong>of</strong> plasma formationto a thin layer leads to a rapid rise <strong>of</strong> free-electron densitywith irradiance, and the irradiance range in which low-densityplasmas can be formed is very small [116, 120].The desired chemical or physical effects <strong>of</strong> low-densityplasmas can be precisely selected if the slope <strong>of</strong> theϱ max (I/I rate ) curve is small because that <strong>of</strong>fers a large
1024 Applied Physics B – Lasers and OpticsFIGURE 5 Maximum free-electron density as a function <strong>of</strong> irradiance,ϱ max (I/I rate ), for 100-fs pulses at 1064-nm, 532-nm, and 355-nm wavelengths.The normalized threshold (I/I rate = 1) and the corresponding value<strong>of</strong> ϱ max are marked by dotted lines‘tuning range’ <strong>of</strong> the irradiance for each effect. Figure 5 showsthat the tuning range increases for shorter <strong>laser</strong> wavelengths.3 Irradiance and free-electron distributionswithin the focal volume3.1 Shape <strong>of</strong> the focal volumeThe temperature and stress distribution in the focalregion depend on the distribution <strong>of</strong> quasi-free electronsproduced during <strong>femtosecond</strong> optical breakdown. Therefore,we must first explore the shape <strong>of</strong> the irradiance and freeelectrondensity distributions within the focal volume beforewe can investigate the resulting temperature and stress effects.Because <strong>of</strong> the nonlinearity <strong>of</strong> the breakdown process, thefree-electron distribution is narrower than the irradiance distributionin the focal volume. A description <strong>of</strong> their relationwill thus also allow us to estimate the possible increase <strong>of</strong> thespatial precision <strong>of</strong> the <strong>laser</strong> effects beyond the level achievablewith techniques that are based on linear absorption.The irradiance distribution in the focal volume <strong>of</strong> a diffraction-limitedoptical system for a focusing angle <strong>of</strong> α = 45 ◦ isreproduced in Fig. 6 from the textbook <strong>of</strong> Born and Wolf [140](α is the half-angle <strong>of</strong> the light cone such as used in thedefinition <strong>of</strong> the numerical <strong>aper</strong>ture NA = n 0 sin α). Theisophotes (contour lines for equal irradiance) reveal that thefocal volume in the center <strong>of</strong> the focal region has an approximatelyellipsoidal shape. A similar structure was obtainedexperimentally when the irradiance distribution ina confocal <strong>laser</strong> scanning microscope (CLSM) was measuredby scanning the tip <strong>of</strong> a scanning near field opticalmicroscope (SNOM) through the focal region (Fig. 7), andby a surface-plasmon-based beam-pr<strong>of</strong>iling technique [141].For our numerical simulations, the focal volume will thereforebe approximated by an ellipsoid with short axis d and longaxis l.The short axis d <strong>of</strong> the ellipsoid is identified with the diameter<strong>of</strong> the central maximum <strong>of</strong> the Airy pattern in the focalplane that is given byd = 1.22 λNA . (14)The symbol λ refers to the vacuum wavelength <strong>of</strong> light. Therefractive index <strong>of</strong> the medium is contained in the value <strong>of</strong>the numerical <strong>aper</strong>ture (NA) <strong>of</strong> the microscope objective. Theratio l/d <strong>of</strong> the long and short axes can be obtained from theFIGURE 6 Isophotes (contour lines for equal irradiance) in the focal region <strong>of</strong> a diffraction-limited microscope objective used to focus a plane wave. Thedashed lines represent the boundary <strong>of</strong> the geometrical focus. The focusing angle <strong>of</strong> α = 45 ◦ corresponds to a numerical <strong>aper</strong>ture <strong>of</strong> NA = 0.94 in water.When the figure is rotated around the u axis, the minima on the v axis generate the Airy dark rings. The figure is taken from Ref. [140], p. 440
VOGEL et al. <strong>Mechanisms</strong> <strong>of</strong> <strong>femtosecond</strong> <strong>laser</strong> <strong>nanosurgery</strong> <strong>of</strong> cells and tissues 1025<strong>laser</strong> pulse is approximately proportional to I k ,wherek is thenumber <strong>of</strong> photons required for multiphoton ionization. Thissimplifying assumption corresponds to the low-intensity approximation<strong>of</strong> the Keldysh theory and neglects the weakerirradiance dependence <strong>of</strong> avalanche ionization that usuallydominates plasma formation during the second half <strong>of</strong> a <strong>laser</strong>pulse (Fig. 3b). For ϱ max ≤ 5 × 10 20 cm −3 , the proportionalityϱ max ∝ I k has been confirmed by the experimental results<strong>of</strong> Mao et al. [18]. The spatial distribution <strong>of</strong> the free-electrondensity can thus be expressed as[ ( r2)]ϱ max (r, z) = ϱ max [I(0, 0)] exp −2ka 2 + z2b 2 . (17)FIGURE 7 Irradiance distribution in a confocal <strong>laser</strong> scanning microscopemeasured by scanning the tip <strong>of</strong> a scanning near field optical microscopethrough the focal region <strong>of</strong> a Zeiss axiovert 100/C-Apo ×40 NA = 1.2water-immersion microscope objective. The measurement was performed fora <strong>laser</strong> wavelength <strong>of</strong> λ = 488 nm; the isocontour lines refer to 46% <strong>of</strong> themaximum irradiance (courtesy <strong>of</strong> Volker Jüngel and Tilo Jankowski, CarlZeiss Jena)relationdl=1 − cos α, (15)(3 − 2cosα − cos 2α)1/2which was derived by Grill and Stelzer for optical setups withvery large solid angles [142]. For NA = 1.3, whichinwatercorresponds to an angle <strong>of</strong> α = 77.8 ◦ ,wefindl/d = 2.4.A similar value is also obtained from the experimental datain Fig. 7. For λ = 800 nm, the above considerations yield focaldimensions <strong>of</strong> d = 750 nm and l = 1800 nm.3.2 Irradiance and electron-density distributionswithin the focal volumeThe mathematical form <strong>of</strong> the diffraction-limitedirradiance distribution in the Fraunh<strong>of</strong>er diffraction pattern <strong>of</strong>a microscope objective (Fig. 6) is too complex for convenientcomputation <strong>of</strong> the temperature and stress evolution inducedby optical breakdown. We approximate the ellipsoidal region<strong>of</strong> high irradiance in the focus by a Gaussian function( r2I(r, z) = I(0, 0) exp[−2a 2 + z2b 2 )], (16)where r and z are the coordinates in radial and axial directions,respectively, and a = d/2 and b = l/2 denote the shortand long axes <strong>of</strong> the ellipsoid. The boundaries <strong>of</strong> the ellipsoidcorrespond to the 1/e 2 values <strong>of</strong> the Gaussian irradiancedistribution.To derive the free-electron distribution ϱ max (r, z) fromthe irradiance distribution I(r, z), we assume that for <strong>femtosecond</strong>pulses the free-electron density at the end <strong>of</strong> theFigure 8 shows the irradiance and electron-density distributionsin the focal region according to (16) and (17) forNA = 1.3 and λ = 800 nm, forwhichk = 5. Due to the nonlinearabsorption process underlying optical breakdown, thefree-electron distribution is much narrower than the irradiancedistribution. For λ = 800 nm and breakdown in water, itis narrower by a factor <strong>of</strong> √ 5 = 2.24, which corresponds toa reduction <strong>of</strong> the affected volume by a factor <strong>of</strong> 11.2. Thediameter <strong>of</strong> the free-electron distribution at the 1/e 2 valuesamounts to 336 nm and the length to 806 nm.It is interesting to note that the influence <strong>of</strong> the nonlinearity<strong>of</strong> the absorption process in plasma-mediated surgeryconsiderably reduces the gain in spatial resolution that can beachieved by using a shorter wavelength. For example, whena wavelength <strong>of</strong> 355 nm is used instead <strong>of</strong> 800 nm, the width<strong>of</strong> the diffraction-limited irradiance distribution decreases bya factor <strong>of</strong> 2.25 but the plasma diameter decreases by a factor<strong>of</strong> only 1.42 because the order <strong>of</strong> the multiphoton processis reduced from 5 to 2 and the irradiance distributionis less strongly narrowed in the process <strong>of</strong> plasma formation.However, the irradiance range leading to low-densityplasma formation is much broader for the shorter wavelengths(Fig. 5) thus making it easier to “tune” chemical and physicaleffects.When the <strong>laser</strong> pulse energy is raised above the opticalbreakdown threshold, the spatial distribution <strong>of</strong> the freeelectrondensity broadens because nonlinear absorption <strong>of</strong><strong>laser</strong> light occurs upstream <strong>of</strong> the <strong>laser</strong> focus and limits theFIGURE 8 Normalized irradiance distribution (a) and electron-density distribution(b) in the focal region for NA = 1.3 andλ = 800 nm that areassumed for the numerical calculations <strong>of</strong> the temperature and stress evolutioninduced by <strong>femtosecond</strong> optical breakdown
1026 Applied Physics B – Lasers and Opticspossible energy density in the vicinity <strong>of</strong> the beam waist(‘plasma shielding’) [80, 126, 136–139]. Moreover, the ϱ(I )dependence will strongly deviate from the proportionality toI k when the critical electron density ϱ ′ cr (3) is reached abovewhich the plasma becomes highly reflective. Since the reflectedlight contributes to the plasma formation in the vicinity<strong>of</strong> the focus center, the electron-density distribution isflattened. The critical electron density ϱ ′ cr for the change <strong>of</strong>the optical plasma properties amounts to 0.984 × 10 21 cm −3for λ = 1064 nm, to3.94 × 10 21 cm −3 for λ = 532 nm, andto 8.86 × 10 21 cm −3 for 355 nm, respectively. We will seein Sect. 6.3 that the threshold for bubble formation is closeto but still below these values. Therefore, the free-electrondistribution depicted in Fig. 8 seems to be a reasonable approximationfor the low-density plasma regime and suitablefor the calculation <strong>of</strong> thermoelastic transients leading to bubbleformation.4 Chemical effects <strong>of</strong> low-density plasmasPlasma-mediated chemical effects in biologicalmedia can be classified into two groups: 1. Changes <strong>of</strong> thewater molecules by which reactive oxygen species (ROS) arecreated that affect organic molecules. 2. Direct changes <strong>of</strong> theorganic molecules in resonant electron–molecule scattering.1. The creation <strong>of</strong> ROS such as OH ∗ and H 2 O 2 throughvarious pathways following ionization and dissociation <strong>of</strong> watermolecules has been investigated by Nikogosyan et al. [103]and recently reviewed by Garret et al. [143]. Both oxygenspecies are known to cause cell damage [144]. Heisterkampet al. [16] confirmed the dissociation <strong>of</strong> water molecules during<strong>femtosecond</strong>-<strong>laser</strong>-induced plasma formation by chemicalanalysis <strong>of</strong> the gas content <strong>of</strong> the bubbles.2. Capture <strong>of</strong> electrons into an antibonding molecular orbitalcan initiate fragmentation <strong>of</strong> biomolecules [143, 145–148], as shown in Fig. 9. Capture can occur when the electronpossesses a ‘resonant’ energy for which there is sufficientoverlap between the nuclear wave functions <strong>of</strong> the initialground state and the final anion state. For a molecule XY thisprocess corresponds to e − + XY → XY ∗− ,wheretheXY ∗−has a repulsive potential along the X−Y bond coordinate.After a time <strong>of</strong> 10 −15 to 10 −11 s, the transient molecular anionstate decays either by electron autodetachment leaving a vibrationallyexcited molecule (VE), or by dissociation alongone or several specific bonds such as XY ∗− → X • + Y − (DA).FIGURE 9 Dynamics <strong>of</strong> vibrational excitation and dissociative electron attachmentin resonant electron–molecule scattering (see text). Reprinted withpermission from Ref. [146]Various authors describe resonant formation <strong>of</strong> DNA strandbreaking induced by low-energy electrons (3–20 eV) [145,147, 148]. Boudaiffa et al. [145] found that the maximumsingle-strand break (SSB) and double-strand break (DSB)yields per incident electron are roughly one or two orders<strong>of</strong> magnitude larger than those for 10–25-eV photons. It isconceivable that accumulative effects <strong>of</strong> this kind can lead toa dissociation/dissection <strong>of</strong> biological structures that are exposedto <strong>femtosecond</strong>-<strong>laser</strong>-generated low-density plasmas.We will now assess the irradiance threshold for chemicalchanges by low-density plasmas using the plot <strong>of</strong>free-electron density vs irradiance presented in Fig. 3d. AtNA = 1.3 and 800-nm wavelength, one free electron per focalvolume corresponds to a density <strong>of</strong> ϱ = 2.1 × 10 13 cm −3 .Our calculations yield the result that this value is reachedat an irradiance <strong>of</strong> I = 0.26 × 10 12 Wcm −2 , which is 0.04times the irradiance threshold for breakdown defined asϱ c = ϱ cr = 10 21 cm −3 . Tirlapur et al. [144] experimentally observedmembrane dysfunction and DNA strand breaks leadingto apoptosis-like cell death after scanning irradiation <strong>of</strong> PtK2cells with a peak irradiance <strong>of</strong> I ≈ 0.44 × 10 12 Wcm −2 in thefocal region, or 0.067 times the calculated breakdown threshold.The observed damage pattern <strong>of</strong> membrane dysfunctionand DNA strand breaks matches the effects expected fromROS and free electrons. The damage resembles the type <strong>of</strong>injury otherwise associated with single-photon absorption <strong>of</strong>UV radiation [144]. However, in Tirlapur’s experiments itarose through nonlinear absorption <strong>of</strong> near-IR irradiation andthe exposure <strong>of</strong> cells to low-density plasmas. The relativeimportance <strong>of</strong> effects from ROS and free electrons at largeirradiances still needs to be investigated.In some cases, the breaking <strong>of</strong> a single bond in polymericbiological structures induces a cascade <strong>of</strong> bond-breakingevents that may be associated with a dramatic lowering <strong>of</strong> theapparent <strong>laser</strong> ablation threshold. For example, microtubulestagged with enhanced yellow fluorescent protein (EYFP)exhibit an exceptionally low threshold for <strong>laser</strong>-induced dissectionwith 76-MHz series <strong>of</strong> 532-nm, 80-ps pulses (0.01 nJper pulse) [76], and an exceptionally low threshold was alsoobserved for GFP-labeled microtubules irradiated by 80-MHzseries <strong>of</strong> 880-nm, 100-fs pulses (0.025 nJ per pulse) [77]. Thelow dissection threshold seems to be related to the dynamic instabilitybetween growth and depolymerization that involvesa rapid and self-propagating depolymerization <strong>of</strong> the ‘openends’ after local breakage <strong>of</strong> the microtubules [149, 150]. Initiation<strong>of</strong> depolymerization requires breaking <strong>of</strong> just a singlelateral bond, which could be induced either by the impact<strong>of</strong> free electrons in a low-density plasma or by multiphotonchemistry, enhanced by the EYFP or GFP labeling, respectively.Since they can be triggered by a single broken bond,these reactions differ from the usual fs <strong>laser</strong> ablation in thelow-density plasma regime that arises as a cumulative effect<strong>of</strong> many bond-breaking events.The irradiance producing lethal changes when <strong>laser</strong> pulseseries are scanned over entire cells (0.067 × I rate ) is slightlyhigher than the model prediction for the irradiance producingone free electron per pulse in the focal volume (0.04 ×I rate ), and about 10 free electrons in the focal volume will beproduced by each <strong>laser</strong> pulse. Considering that the cell is exposedto thousands <strong>of</strong> pulses during the scanning irradiation,
VOGEL et al. <strong>Mechanisms</strong> <strong>of</strong> <strong>femtosecond</strong> <strong>laser</strong> <strong>nanosurgery</strong> <strong>of</strong> cells and tissues 1027cumulative chemical damage may arise from the free electrons.By contrast, when locally confined irradiation is used toachieve knockout <strong>of</strong> individual cell organelles or intracellulardissection, the irradiance threshold for cell death is considerablyhigher. The role <strong>of</strong> plasma-mediated chemical effects forthese procedures will be discussed in Sect. 7.1, in comparisonto the possible role <strong>of</strong> thermal and thermomechanical effects.Recently, non-resonant ultra-fast processes <strong>of</strong> bond breakinginduced by the large field strength in <strong>femtosecond</strong> <strong>laser</strong>pulses have been discussed in the context <strong>of</strong> <strong>laser</strong> ablation[151, 152]. However, these processes occur at surfaceswhere hot electrons can be emitted from the target, thus creatinga large field among the remaining ions that can causea Coulomb explosion, and where material decomposed bya strong <strong>laser</strong> field can freely expand. They are not likelyto play a role in the bulk <strong>of</strong> transparent media, especiallyin the low-density plasma regime, i.e. at comparatively lowfield strengths. Here, chemical changes are rather generatedthrough resonant interactions between quasi-free electronsand molecules.5 Temperature evolution during pulse series5.1 Calculation <strong>of</strong> temperature distributionThe deposition <strong>of</strong> <strong>laser</strong> energy into the mediumis mediated by the generation and subsequent acceleration<strong>of</strong> free electrons. The energy carried by the free electronsis transferred to the heavy particles in the interaction volumethrough collisions and non-radiative recombination processesresulting in a heating <strong>of</strong> the atomic, molecular, andionic plasma constituents. To assess the time needed to establishan equilibrium temperature, we need to look at thecharacteristic time for electron cooling (the transfer <strong>of</strong> kineticelectron energy during collisions) and at the time scale forrecombination, which in water progresses through hydration<strong>of</strong> the free electrons. The time constant for electron coolingis <strong>of</strong> the order <strong>of</strong> only a few picoseconds [143, 153], and thetime constant for hydration <strong>of</strong> free electrons in water is evenshorter, about 300 fs [103]. However, the hydrated states possessa relatively long lifetime <strong>of</strong> up to 300 ns [103]. In theframework <strong>of</strong> our model, the different steps are treated as onerecombination process according to (11). As the frequency<strong>of</strong> recombination events is proportional to ϱ 2 c , the recombinationtime depends on the free-electron density. It takes about40 ps until the free-electron density decreases by one order <strong>of</strong>magnitude from a peak value <strong>of</strong> ϱ c = 10 20 cm −3 , and about20 ps for a peak value <strong>of</strong> ϱ c = 10 21 cm −3 [81, 91]. For lowdensityplasmas it will thus take between a few picosecondsand tens <strong>of</strong> picoseconds until a ‘thermodynamic’ temperatureis established [143].The temperature rise can be determined by calculating thevolumetric energy density gained by the plasma during the<strong>laser</strong> pulse. This calculation is particularly easy for <strong>femtosecond</strong>pulses because the pulse duration is considerably shorterthan the electron cooling and recombination times. Therefore,hardly any energy is transferred during the <strong>laser</strong> pulse, and theenergy density deposited into the interaction volume is simplygiven by the total number density ϱ max <strong>of</strong> the free electronsproduced during the pulse multiplied by the mean energy gain<strong>of</strong> each electron. The mean energy gain <strong>of</strong> an electron is givenby the sum <strong>of</strong> ionization potential ˜∆ and average kinetic energy,the latter being (5/4) ˜∆ for free electrons produced bycascade ionization (Sect. 2.2). This yields the following simplerelation for the plasma energy density ε at the end <strong>of</strong> the<strong>laser</strong> pulse:ε = ϱ max (9/4) ˜∆. (18)Note that this simple equation neglects the collisional energytransfer before impact ionization that is included in (8) andconsidered in more detail by more advanced models basedon the use <strong>of</strong> complete collision integrals [21, 113]. This maylead to an underestimation <strong>of</strong> the rise in energy density correspondingto one free electron. On the other hand, (18) treatsfree electrons produced by multiphoton ionization in the sameway as those produced by impact ionization even though theystart with zero kinetic energy <strong>of</strong> electron and hole, which willrather overestimate the energy density increase. From (18),the temperature rise in the interaction volume after a single<strong>laser</strong> pulse can then be calculated by ∆T = ε/(ϱ 0 C p ),where C p is the heat capacity and ϱ 0 the mass density <strong>of</strong> themedium.The evolution <strong>of</strong> the temperature distribution within andaround the interaction volume after a single 100-fs pulse(λ = 800 nm), during application <strong>of</strong> series <strong>of</strong> 100-fs pulsesemitted at various repetition rates, and during cw <strong>laser</strong> irradiation(λ = 514 nm), was calculated by solving the differentialequation for heat diffusion with the appropriate Green’sfunctionT(x, y, z, t) =∑N−1n=0∫min(t−n/ f,τ L )0∫A∫∞−∞∫{ ( x ′2 + y ′2 ) }exp −2a 2 − 2 z′2b 21×8πϱ 0 C p κ(t − n/ f − t ′ ){ (x − x ′ ) 2 + (y − y ′ ) 2 + (z − z ′ ) 2 }× exp4κ(t − t ′ dx ′ dy ′ dz ′ dt ′ .)(19)Here A is the peak density <strong>of</strong> absorbed power in the irradiatedvolume, f is the puls repetition rate, κ is the thermaldiffusivity, a and b are the short and long half-axes <strong>of</strong> the freeelectron-densitydistribution described by (17) (1/e 2 values<strong>of</strong> electron density), N = Int(tf) + 1 is the number <strong>of</strong> pulseswhich were absorbed until time t, andτ L is the <strong>laser</strong> pulsewidth. The integrals over x ′ , y ′ ,andz ′ were solved analyticallyusing Mathematica s<strong>of</strong>tware, whereas the integrationover t ′ was done numerically. We assumed the temporal shape<strong>of</strong> the <strong>laser</strong> pulses to be rectangular. We used the valuesϱ = 1000 kg m −3 for the density, C p = 4187 J K −1 kg −1 forthe heat capacity, and κ = 1.38 × 10 −7 m 2 s −1 for the heat diffusivity<strong>of</strong> water [154].5.2 Evolution <strong>of</strong> the temperature distributionThe spatial temperature distribution at the end <strong>of</strong>a single fs <strong>laser</strong> pulse, before heat diffusion sets in, reproducesthe shape <strong>of</strong> the free-electron distribution <strong>of</strong> Fig. 8. Hence, the
1028 Applied Physics B – Lasers and OpticsFIGURE 10 Temperature evolution at the center <strong>of</strong> the <strong>laser</strong> focus producedby a series <strong>of</strong> 800-nm, 100-fs pulses focused into water. (a) 80-MHz repetitionrate, NA = 1.3; (b) 80-MHz repetition rate, NA = 0.6; (c) 1-MHzrepetition rate, NA = 0.6. The volumetric energy density deposited per pulseis always 1 J cm −3 at the focus center. The dashed lines represent thetemperature decay after a single pulse. For comparison, the temperature evolutionduring cw irradiation with the same average power as for the pulsedirradiation is also showndiameter <strong>of</strong> the initial temperature distribution (1/e 2 values)amounts to 336 nm and the length to 806 nm (Sect. 3.2). Figure10 shows the calculated temperature evolution at the center<strong>of</strong> the <strong>laser</strong> focus when series <strong>of</strong> 800-nm, 100-fs pulses arefocused into water at different repetition rates (80 MHz and1MHz) and numerical <strong>aper</strong>tures (NA = 1.3 and NA = 0.6).It was assumed that with each pulse an energy density <strong>of</strong>1Jcm −3 at the center <strong>of</strong> the initial temperature distribution isdeposited. For other values <strong>of</strong> the volumetric energy density,the shape <strong>of</strong> the temperature vs time curve will be the samebut the absolute value <strong>of</strong> the temperature varies proportionallyto the peak density <strong>of</strong> absorbed power, A. For comparison,we also calculated the temperature evolution during cw irradiationwith the same average power as for the pulsed irradiation(dotted lines in Fig. 10a–c). For 80-MHz repetition rate,pulsed and continuous energy deposition differ significantlyonly during the first 100 ns.The calculations in Fig. 10a for tightly focused irradiationwith 80-MHz repetition rate reveal that the temperature is only6.8 times larger after a few microseconds than the temperatureincrease caused by a single pulse. This implies that onlya moderate heat accumulation occurs during plasma-mediatedcell surgery. However, when the numerical <strong>aper</strong>ture is reducedfrom NA = 1.3 to NA = 0.6, such as in Fig. 10b, a 45-foldtemperature increase is predicted. Temperature accumulationcan almost entirely be avoided if, at the same NA, the repetitionrate is lowered to 1MHz(Fig. 10c). In this case, thepeak temperature in a long pulse series is only 1.36 timeslarger than after a single pulse. For 1-MHz repetition rate andNA = 1.3, this factor reduces to 1.024.When <strong>laser</strong> surgery is performed with 80-MHz pulse seriesfocused at NA = 1.3, the boiling temperature <strong>of</strong> 100 ◦ Cwill, due to the 6.8-fold temperature accumulation, be reachedwhen each individual pulse produces a temperature rise <strong>of</strong>11.8 ◦ C (starting from 20 ◦ C room temperature). For 800-nm,100-fs pulses this temperature rise requires a free-electrondensity <strong>of</strong> ϱ c = 2.1 × 10 19 cm −3 , which is reached at an irradiance<strong>of</strong> 0.51 times the value required for optical breakdown(ϱ cr = 10 21 cm −3 ).The temperature distribution in the vicinity <strong>of</strong> the <strong>laser</strong> focusduring application <strong>of</strong> 80-MHz pulse series is presentedin Fig. 11 for different numerical <strong>aper</strong>tures. The distributionarising from the ellipsoidal focus volume is plotted both inradial and axial directions. For NA = 1.3, the temperaturedistribution remains fairly narrow (FWHM ≈ 600 nm) evenafter a few milliseconds when a dynamic equilibrium betweenenergy deposition and heat diffusion has been established.The rapid decrease <strong>of</strong> the temperature with increasing distancefrom the <strong>laser</strong> focus is related to the small size <strong>of</strong> thefocal volume, which allows for rapid heat diffusion in all directions.By contrast, for NA = 0.6 the steady-state temperaturedistribution is more broadened compared to the singlepulsedistribution, in addition to the stronger increase <strong>of</strong> thepeak temperature. Both temperature accumulation and broadening<strong>of</strong> the temperature distribution can be avoided withrepetition rates ≤ 1MHz.At first sight, the results <strong>of</strong> our temperature calculationsmight suggest that an irradiance range below the opticalbreakdown threshold exists where predominantly thermal effectsin biological media can be produced. However, oneneeds to consider that about 10 6 free electrons per pulse aregenerated in the focal volume at the irradiance that createsa temperature difference <strong>of</strong> 11.8 ◦ C per pulse and a peak temperature<strong>of</strong> 100 ◦ C after a pulse series <strong>of</strong> several microseconds(for NA = 1.3). Any thermal denaturation <strong>of</strong> biomoleculeswill thus always be mixed with free-electron-induced chemicaleffects, and the latter will probably dominate.5.3 Comparison with cw irradiation <strong>of</strong> linear absorbersSince various researchers have produced cellularmicroeffects using long-pulsed or continuous-wave irradiation[47, 52, 56, 69–71], it is <strong>of</strong> interest to compare thewidths <strong>of</strong> the temperature distributions produced by series <strong>of</strong>ultra-short <strong>laser</strong> pulses and cw irradiation.Figure 12 shows the evolution <strong>of</strong> the temperature distributionwhen cw irradiation <strong>of</strong> 514-nm wavelength is fo-
VOGEL et al. <strong>Mechanisms</strong> <strong>of</strong> <strong>femtosecond</strong> <strong>laser</strong> <strong>nanosurgery</strong> <strong>of</strong> cells and tissues 1029FIGURE 11 Temperature distribution in radial direction (a, c) and axial direction (b, d) produced by series <strong>of</strong> 800-nm, 100-fs pulses focused into water atnumerical <strong>aper</strong>tures <strong>of</strong> NA = 1.3(a, b)andNA= 0.6(c, d). The pulse-repetition rate was 80 MHz in both cases, and the volumetric energy density depositedat the focus center was 1 J cm −3 for each pulsecused into a linearly absorbing aqueous medium at NA =1.3. The temperature distribution is slightly broader (FWHM850 nm) than that in Fig. 11a arising from nonlinear absorption<strong>of</strong> 80-MHz IR <strong>femtosecond</strong> pulse trains (FWHM600 nm). The temperature distribution produced by <strong>femtosecond</strong>pulse trains is narrower because it originates from thefree-electron distribution (18) rather than from the irradiancedistribution (17) that is relevant for linear energy deposition.However, the spatial resolution <strong>of</strong> <strong>femtosecond</strong> <strong>laser</strong>surgery is not determined by the steady-state temperature distributionbut by the width <strong>of</strong> the free-electron distributionitself, as we shall see in Sect. 7.1. Therefore, the spatial resolution<strong>of</strong> fs <strong>laser</strong> surgery is considerably better than that <strong>of</strong>a cw microbeam.FIGURE 12 Evolution <strong>of</strong> the temperature distribution in radial directionproduced by continuous energy deposition in a linearly absorbing aqueousmedium at a <strong>laser</strong> wavelength <strong>of</strong> 514 nm. The calculations were performedfor the same absorbed average power as in the case <strong>of</strong> pulsed, nonlinearenergy deposition presented in Fig. 116 Thermoelastic stress generationand stress-induced bubble formation6.1 Calculation <strong>of</strong> stress distributionand bubble formationThe temperature rise in the focal volume occursduring thermalization <strong>of</strong> the energy carried by the free electrons,i.e. within a few picoseconds to tens <strong>of</strong> picoseconds(see Sect. 5.1). This time interval is much shorter than theacoustic transit time from the center <strong>of</strong> the focus to its periphery.Therefore, no acoustic relaxation is possible during thethermalization time, and the thermoelastic stresses caused bythe temperature rise stay confined in the focal volume, leadingto a maximum pressure rise [2, 155, 156]. Conservation <strong>of</strong>momentum requires that the stress wave emitted from a finitevolume within an extended medium must contain both compressiveand tensile components such that the integral <strong>of</strong> thestress over time vanishes [155, 157]. The tensile stress wavemay induce fracture <strong>of</strong> the material even after a temperaturerise too small to produce thermal damage [158]. In water, itwill cause the formation <strong>of</strong> a cavitation bubble when the tensilestrength <strong>of</strong> the liquid is exceeded. For cell surgery, thethreshold for bubble formation defines the onset <strong>of</strong> disruptivemechanisms contributing to dissection.To determine the evolution <strong>of</strong> the thermoelastic stress distributionin the vicinity <strong>of</strong> the <strong>laser</strong> focus, we solved the threedimensionalthermoelastic wave equation. A starting point for
1030 Applied Physics B – Lasers and Opticsthe calculation <strong>of</strong> the thermoelastic stress wave propagation isthe temperature distribution at the end <strong>of</strong> a single <strong>femtosecond</strong><strong>laser</strong> pulse that reproduces the free-electron distribution describedby (17). In the following calculations, this temperaturedistribution is characterized by T max , the temperature in ◦ C inthe center <strong>of</strong> the focal volume. From this temperature distributionthe initial thermoelastic pressure (right after the <strong>laser</strong>pulse, before the acoustic wave has started to propagate) wascalculated usingp(r) =T∫2 (r)β(T )K(T )T 1dT , (20)where T 1 = 20 ◦ C is the temperature before the <strong>laser</strong> pulse,and T 2 (r) the temperature <strong>of</strong> the plasma after the <strong>laser</strong>pulse, which depends on the location within the focal volume.The temperature dependence <strong>of</strong> the thermal expansioncoefficient β and the compressibility K was takeninto account, using values for metastable water from [159].The time- and space-dependent pressure distribution p(r, t)due to the relaxation <strong>of</strong> the initial thermoelastic pressurewas calculated using a k-space (spatial frequency) domainpropagation model [160, 161].Because the heated volume is very small (≈ 0.07 µm 3 )and the region subjected to large tensile stress amplitudesis even smaller (see Fig. 14, below), the presence <strong>of</strong> inhomogeneousnuclei that could facilitate bubble formation isunlikely. Therefore, we have to consider the tensile strength<strong>of</strong> pure water to estimate the bubble-formation threshold in<strong>femtosecond</strong> optical breakdown. Traditionally, the rupture <strong>of</strong>a liquid achieved by tensile stress under isothermal conditionsis called ‘cavitation’ while bubble formation due toheating under isobaric conditions is called ‘boiling’ [162].Such a distinction becomes obscure when targets are bothheated and stretched under conditions <strong>of</strong> stress confinement.We use the crossing <strong>of</strong> the ‘kinetic spinodal’ as defined byKiselev [163, 164] as threshold criterion for bubble formation.In the thermodynamic theory <strong>of</strong> phase transitions, thelocus <strong>of</strong> states <strong>of</strong> infinite compressibility (∂p/∂V) T = 0, thespinodal, is considered as a boundary <strong>of</strong> fluid metastable (superheated)states. Physically, however, the metastable statebecomes short-lived due to statistical fluctuations well beforethe spinodal is reached [159, 165]. The kinetic spinodal is thelocus in the phase diagram where the lifetime <strong>of</strong> metastablestates becomes shorter than a relaxation time to local equilibrium.If the surface tension is known, the physical boundary<strong>of</strong> metastable states in this approach is completely determinedby the equation <strong>of</strong> state only, i.e. by the equilibrium properties<strong>of</strong> the system [163, 164]. This feature distinguishes the kineticspinodal from the homogeneous nucleation limit derived earlierby Fisher, which depends on the size <strong>of</strong> the volume underconsideration and the duration <strong>of</strong> the applied stress [166].Unlike Fisher’s equation, the kinetic spinodal reproduces theshape <strong>of</strong> the spinodal and is applicable in the entire temperaturerange from room temperature to the critical point. Thenucleation thresholds in cells will probably resemble those inpure water because the biomolecules are too small to serve asboundaries for heterogeneous nucleation.FIGURE 13 (a) Binodal, spinodal, and kinetic spinodal <strong>of</strong> water as a function<strong>of</strong> temperature, calculated with the analytic equation <strong>of</strong> state <strong>of</strong> Sauland Wagner [240]. The dotted curve corresponds to the homogeneous nucleationlimit in Fisher’s theory [166], the circles indicate experimental data<strong>of</strong> Skripov et al. [159], and the triangles indicate the experimental data <strong>of</strong>Zheng et al. [167] recalculated in p–T coordinates. Figure reproduced withpermission from Ref. [163]. Copyright 1999 Elsevier Science B.V. (b) Peakcompressive and tensile thermoelastic stresses in the focus center producedby a 800-nm, 100-fs pulse focused into water at NA = 1.3, plotted togetherwith the binodal and the kinetic spinodalFigure 13a presents the saturated liquid/vapor curve (binodal),the spinodal, the kinetic spinodal, and the homogeneousnucleation limit derived by Fisher in a p vs T projection <strong>of</strong> thethermodynamic phase diagram for water. For comparison, experimentaldata by Skripov et al. on the empirical limit <strong>of</strong> themetastable region and by Zheng et al. on the tensile strength<strong>of</strong> water are also shown [159, 167]. In Fig. 13b, the kineticspinodal is plotted together with the peak compressive andtensile thermoelastic stresses in the focus center that are producedwhen an 800-nm, 100-fs pulse is focused into water atNA = 1.3. The temperature at which the tensile stress curvereaches the kinetic spinodal is defined as the bubble-formationthreshold. For larger <strong>laser</strong> pulse energies, the kinetic spinodalwill be reached in an increasingly large part <strong>of</strong> the focalregion.To calculate the dynamics <strong>of</strong> the cavitation bubble producedafter crossing the kinetic spinodal, first the size <strong>of</strong>the bubble nucleus was determined. It was identified withthe extent <strong>of</strong> the region in which the negative pressure exceedsthe kinetic spinodal limit p(r, t)
VOGEL et al. <strong>Mechanisms</strong> <strong>of</strong> <strong>femtosecond</strong> <strong>laser</strong> <strong>nanosurgery</strong> <strong>of</strong> cells and tissues 1031as the starting nucleus for the cavitation bubble. The heatedand stretched material within the nucleus commences to expandinstantaneously (within less than 1ps) once the kineticspinodal is reached [168]. As driving force for the expansiononly the negative part <strong>of</strong> the time-dependent stress in thecenter <strong>of</strong> the focal volume was considered, because the nucleusdoes not exist before the tensile stress arrives. This isin contrast to simulations <strong>of</strong> heterogeneous cavitation wherepre-existing gas bubbles interact with a time-varying pressurewave [158]. Only cases were simulated in which the temperaturein the center <strong>of</strong> the focal volume slightly exceeds thephase-transition threshold and the size <strong>of</strong> the resulting nucleusis small compared with the focal volume. This justifies usingthe tensile stress amplitude in the center <strong>of</strong> the undisturbedfocal volume as driving force for the bubble expansion. Forlarger <strong>laser</strong> pulse energies one would need to consider that thetensile stress is diminished by the rupture <strong>of</strong> the liquid.After the passage <strong>of</strong> the tensile stress transient, the vaporpressure p v inside the bubble continues to drive the bubble expansion.The initial vapor pressure is calculated for a temperatureaveraged over all volume elements within the nucleus.During bubble growth, it will drop due to the cooling <strong>of</strong> the expandingbubble content. This cooling is counteracted by heatdiffusion from the liquid surrounding the bubble. The temperature<strong>of</strong> this liquid, on the other hand, drops because <strong>of</strong> heatdiffusion out <strong>of</strong> the focal volume as depicted by the dashedlines in Fig. 10. To quantify the temporal evolution <strong>of</strong> the drivingpressure, we consider two limiting cases:Case 1: Bubble size ≪ focal volume. We assume that thebubble initially expands adiabatically until the average temperature<strong>of</strong> the bubble content has fallen to the temperature<strong>of</strong> the liquid at the nucleus wall. Afterwards, heat flow fromthe surrounding liquid maintains the temperature <strong>of</strong> the bubblecontent at the same level as that <strong>of</strong> the surrounding liquid.The bubble pressure p v (t) thus equals the equilibrium vaporpressure corresponding to the temperature at the nucleus wall,which, for NA = 1.3, decays within about 20 ns to 1/e <strong>of</strong> itsinitial value (Fig. 10a). Justifications for this hypothesis arethe small bubble size and the fact that the bubble nucleus is notempty but contains material that is initially at liquid densityand has a relatively large heat capacity.Case 2: Bubble size comparable to or larger than the focalvolume. When the size <strong>of</strong> the nucleus becomes comparable tothe size <strong>of</strong> the focal volume, the bubble expands more rapidly.In this case, the heated liquid shell surrounding the bubble israpidly thinned, which leads to an accelerated heat dissipationinto adjacent liquid. The heat flow into the bubble is probablysmall compared with the amount <strong>of</strong> heat contained in the materialwithin the bubble nucleus. Therefore, the entire bubbledynamics is modeled as an adiabatic expansion. As a consequence,the vapor pressure drops much faster than in case 1.In both cases, the ongoing phase transition in the bubble wasneglected to obtain tractable expressions for p v (t).Thissimplificationenabled us to use the Gilmore model to describe thebubble dynamics [158, 169, 170]. The pressure drop is in case1 slower and in case 2 faster than the pressure decay correspondingto the actual phase transitions <strong>of</strong> the bubble content.Therefore, these cases represent upper and lower limits for theevolution <strong>of</strong> the actual bubble size after <strong>femtosecond</strong> opticalbreakdown.6.2 Evolution <strong>of</strong> the stress distributionThe thermalization time <strong>of</strong> the energy carried bythe free electrons was assumed to be 10 ps. ForNA = 1.3,λ = 800 nm, and a sound velocity in water <strong>of</strong> c 0 = 1500 m/s,the acoustic transit time to the periphery <strong>of</strong> the heated regionwith 168-nm radius is 112 ps. Thus, the dimensionlessthermalization time (thermalization time divided byacoustic relaxation time) is tp ∗ = 0.09, which correspondsto a very high degree <strong>of</strong> stress confinement. The ‘thermalizationpulse’ was assumed to have a Gaussian temporalshape, with the peak at t = 0. By comparison with anexponential thermalization pulse we found that, for shortdimensionless pulse durations tp ∗ , the pulse shape has littleinfluence on the shape and amplitude <strong>of</strong> the stresswave.Figure 14 shows the spatial stress distribution in radial andaxial directions for various points in time after the release <strong>of</strong>the <strong>laser</strong> pulse, and Fig. 15 presents the temporal evolution <strong>of</strong>the stress amplitude in the center <strong>of</strong> the focal volume. All pressureamplitudes are normalized to the peak compressive stresscreated in the focal volume.FIGURE 14 Stress distribution produced by a single <strong>femtosecond</strong> pulse <strong>of</strong>800-nm wavelength focused into water (NA = 1.3), for various times afterthe release <strong>of</strong> the <strong>laser</strong> pulse; (a) in radial direction, (b) in axial direction. Thethermalization time <strong>of</strong> the energy carried by the free electrons was assumedto be 10 ps. The dimensionless thermalization time (thermalization time dividedby acoustic relaxation time) was tp ∗ = 0.09. The ‘thermalization pulse’was assumed to have a Gaussian temporal shape, with the peak at t = 0. Thepressure amplitudes are normalized to the peak compressive stress created inthe focal volume
1032 Applied Physics B – Lasers and OpticsFIGURE 15 Temporal evolution <strong>of</strong> the stress amplitude in the center <strong>of</strong> thefocal volume for the same conditions as in Fig. 14The compressive stress generates a stress wave travelinginto the surrounding medium. When the thermal expansioncomes to a rest, inertial forces lead to the generation <strong>of</strong> a relaxationwave that propagates from the periphery <strong>of</strong> the focalvolume towards its center and is focused in the center <strong>of</strong>symmetry. Because <strong>of</strong> the geometrical focusing, it turns intoa tensile stress wave that achieves maximum amplitude at thecenter <strong>of</strong> symmetry.The peak tensile stress amplitude depends strongly onthe shape <strong>of</strong> the heated volume. It is largest for a sphericalshape [155] and much smaller in the present case <strong>of</strong>an elongated ellipsoid. The dependence <strong>of</strong> the compressivestress amplitude on the degree <strong>of</strong> stress confinement t ∗ p wasrelatively strong, but the amplitude <strong>of</strong> tensile stress wavesremained approximately constant when the duration <strong>of</strong> thethermalization pulse was varied between 5ps, 10 ps, and20 ps.A comparison <strong>of</strong> Fig. 14a and b shows that the stress-waveamplitudes outside the focal region are considerably larger inthe radial than in the axial direction. This is a consequence <strong>of</strong>the elongated shape <strong>of</strong> the focal volume. The stress transientsemitted in both directions have a bipolar shape as expectedfor thermoelastic waves. The amplitude <strong>of</strong> the stress transientwhen it leaves the heated region in the radial directionamounts to 25% <strong>of</strong> the peak compressive pressure. This differsfrom the previously analyzed case <strong>of</strong> a top-hat distribution,where the amplitude <strong>of</strong> the compressive wave just outsidethe heated volume amounts to 0.5 times the peak compressivepressure inside that volume [97].Experimental data on stress-wave emission. Measurements<strong>of</strong> the stress waves produced by <strong>femtosecond</strong> optical breakdownat large NA and close to the breakdown threshold arevery challenging because <strong>of</strong> the sub-micrometer size <strong>of</strong> thebreakdown volume and the sub-nanosecond duration <strong>of</strong> thestress transients (Figs. 14 and 15). Hydrophones with sufficientlysmall detector size to resolve the shape <strong>of</strong> the transientclose to their source are not available, and optical techniques[96, 171–173] also do not provide the necessary spatialresolution. Therefore, we performed measurements at smallernumerical <strong>aper</strong>ture (NA = 0.2) to assess the stress amplitudesarising during <strong>femtosecond</strong> optical breakdown.FIGURE 16 Measured pressure vs propagation-distance curve for a stresswave produced by a 100-fs pulse <strong>of</strong> 5-µJ energy(E/E th = 30) focused intodistilled water at NA = 0.2 (16 ◦ full focusing angle). The <strong>laser</strong> wavelengthwas 580 nm. The arrow represents the location <strong>of</strong> the plasma rim as determinedfrom plasma photographs in side view. The p(d) curve was determinedfrom the streak recording <strong>of</strong> the stress-wave emission shown in the insetInvestigations for irradiances well above the breakdownthreshold were done by means <strong>of</strong> streak photography and subsequentdigital image analysis <strong>of</strong> the streak recordings [127,128, 173]. Differentiation <strong>of</strong> the stress wave propagationcurves r(t) obtained from the streak recordings yielded thestress-wave velocity that is related to the pressure amplitudeby the known Rankine–Hugoniot relationship for water [174]if the stress wave has shock-wave properties. The analysisyielded the entire pressure vs distance curve in the immediatevicinity <strong>of</strong> the breakdown region perpendicular to the opticalaxis as shown in Fig. 16.The determination <strong>of</strong> the shock-wave pressure becomesinaccurate for pressure amplitudes below 100 MPa, wherethe deviation <strong>of</strong> the propagation velocity from the sonic velocitybecomes too small to be measured accurately with thestreak technique [173]. Therefore, the streak technique couldonly be applied for shock-wave measurements at energies15–150 times above the breakdown threshold. Stress-waveamplitudes closer to the optical breakdown threshold were determinedindirectly by hydrophone measurements at 6-mmdistance from the focus [127] and extrapolation <strong>of</strong> these datato the plasma rim. We used a PVDF hydrophone (Ceram) witha rise time <strong>of</strong> 12 ns,anactivearea<strong>of</strong>1mm 2 , and a sensitivity<strong>of</strong> 280 mV/MPa (calibrated by the manufacturer up to a frequency<strong>of</strong> 10 MHz). A distance <strong>of</strong> 6mmbetween detector and<strong>laser</strong> focus was required to avoid measurement errors arisingfrom the intersection <strong>of</strong> a spherical shock wave with a planedetector [96]. Measurement results for energies from close tothe breakdown threshold up to 80 times threshold are shownin Fig. 17.The results <strong>of</strong> far-field hydrophone measurements can beextrapolated to the boundary <strong>of</strong> the focal region if the decayconstant n <strong>of</strong> the pressure decay p ∝ r n with increasingpropagation distance r is known. The decay constant was estimatedby comparing pressure values at the plasma rim and inthe far field that were measured at larger <strong>laser</strong> pulse energies.For example, for E = 30 × E th , the pressure at the plasma rim(r = 2.2 µm)is900 MPa (Fig. 16), and the pressure measured
VOGEL et al. <strong>Mechanisms</strong> <strong>of</strong> <strong>femtosecond</strong> <strong>laser</strong> <strong>nanosurgery</strong> <strong>of</strong> cells and tissues 1033FIGURE 17 Stress-wave amplitude for 100-fs pulses and longer pulse durationsas a function <strong>of</strong> the dimensionless <strong>laser</strong> pulse energy E/E th .Thepressure amplitudes were measured by means <strong>of</strong> a hydrophone at 6-mmdistance from the <strong>laser</strong> focusat 6-mm distance is 0.12 MPa (Fig. 17). The resulting decayconstant is n = 1.13. Previous investigations <strong>of</strong> complete p(r)curves for spherical shock waves produced by 30-ps pulses <strong>of</strong>50-µJ energy yielded a very similar constant <strong>of</strong> n = 1.12 overa large range <strong>of</strong> propagation distances [96].An estimate <strong>of</strong> the pressure value at 6-mm distance producedby a 100-fs pulse with threshold energy was obtained byextrapolating the data for E/E th ≥ 1.5 in Fig. 17 to E = E th .It is about 0.008 MPa. The plasma radius at E th was identifiedwith the focal radius <strong>of</strong> 2.2 µm measured using a knife-edgetechnique [127]. A pressure <strong>of</strong> p = 0.008 MPa at 6-mm distancecorresponds to a pressure value <strong>of</strong> 61 MPa at the plasmarim when a decay constant n = 1.13 isassumed,andtoavalue<strong>of</strong> 56 MPa with a decay constant <strong>of</strong> n = 1.12, respectively.Our calculations <strong>of</strong> the thermoelastic stress generation predicta peak pressure <strong>of</strong> 168 MPa at the bubble-formation threshold(see Sect. 6.3, below). According to Fig. 14, the stress transientthat leaves the heated region in the radial direction hasa peak pressure <strong>of</strong> ≈ 25% <strong>of</strong> the maximum compressive amplitudewithin the focal volume. We thus obtain a theoreticalprediction <strong>of</strong> 42 MPa for the amplitude <strong>of</strong> the thermoelasticstress wave at the plasma rim. Considering the uncertainties inthe location <strong>of</strong> the plasma rim and the differences in numerical<strong>aper</strong>ture between experiment and calculation, the agreementbetween experimental results (56–61 MPa) and calculateddata (42 MPa) is very good.Both experiments and calculations reveal that stress confinementin <strong>femtosecond</strong> optical breakdown results in thegeneration <strong>of</strong> high pressure values even though the temperaturerise is only relatively small. In a purely thermal process,a temperature rise to, for example, 200 ◦ C starting fromroom temperature would produce a saturation vapor pressure<strong>of</strong> 1.6MPa. The compressive pressure transient produced bya temperature rise <strong>of</strong> 180 ◦ C under stress-confinement conditionshas an amplitude <strong>of</strong> 220 MPa, which is more than twoorders <strong>of</strong> magnitude larger than the vapor pressure.The situation is different for optical breakdown at longerpulse durations where the stress-confinement condition is notfulfilled. Here, high pressures are always associated with hightemperatures and plasma energy densities. For pulses whichare considerably longer than the thermalization time <strong>of</strong> thefree-electron energy, a dynamic equilibrium between generation<strong>of</strong> free electrons and thermalization <strong>of</strong> their energy is establishedduring the <strong>laser</strong> pulse [81]. This leads to a high value<strong>of</strong> the plasma energy density [80] and a temperature <strong>of</strong> severalthousand degrees Kelvin [175–177]. The duration <strong>of</strong> the resultingshock wave is determined by the time it takes for thehigh pressure within the plasma to decrease during the plasmaexpansion [96], which for NA = 0.9 was found to be about25–40 ns [3]. By contrast, the duration <strong>of</strong> the thermoelasticstress transients is determined by the geometric dimensions<strong>of</strong> the breakdown volume, which are in the sub-micrometerrange. This leads to a duration <strong>of</strong> the stress transients <strong>of</strong> theorder <strong>of</strong> or less than 300 ps (Fig. 15). The short duration <strong>of</strong>these stress waves is correlated with a small energy content(see also Sect. 6.4).6.3 Threshold for stress-induced bubble formationA specific feature <strong>of</strong> the stress transients generatedduring fs optical breakdown is their tensile componentthat is related to the high degree <strong>of</strong> stress confinement duringenergy deposition. The tensile stress makes it possiblethat a cavitation bubble can be generated by a relatively smalltemperature rise in the liquid. The threshold for bubble formationis defined by the temperature rise leading to a crossing<strong>of</strong> the kinetic spinodal, as shown in Fig. 13. For λ = 800 nm,NA = 1.3, and a room temperature <strong>of</strong> 20 ◦ C, the critical temperaturerise and the corresponding critical tensile stress are∆T = 131.5 ◦ C and p =−71.5MPa, respectively. The correspondingcompressive pressure is 168 MPa.The temperature rise <strong>of</strong> 131.5 ◦ C at the threshold for bubbleformation corresponds to an increase in energy density<strong>of</strong> 551 J cm −3 which, according to (18), is produced bya free-electron density <strong>of</strong> ϱ c = 0.236 × 10 21 cm −3 . This electrondensity is less than the breakdown criterion <strong>of</strong> ϱ cr =10 21 cm −3 assumed in our numerical calculations and in mostother theoretical studies <strong>of</strong> plasma formation. The discrepancybetween the threshold values relying on different breakdowncriteria needs to be kept in mind when comparing the results<strong>of</strong> experimental studies, where bubble formation servesas breakdown criterion, with those <strong>of</strong> numerical simulations.The fact that <strong>femtosecond</strong> optical breakdown is associatedwith only a relatively small temperature rise explainswhy plasma luminescence is no longer visible for pulse durationsshorter than about 10 ps [122, 128]. For pulse durationslonger than the thermalization time, large amounts <strong>of</strong> energyare transferred from the free electrons to the heavy particlesduring the <strong>laser</strong> pulse [81], resulting in a temperature <strong>of</strong> severalthousand degrees Kelvin, bubble formation, and a brightplasma luminescence [175–177]. By contrast, a peak temperature<strong>of</strong> 151.5 ◦ C reached at the threshold for bubble formationwith 100-fs pulses is too low to produce black-body radiationin the visible range <strong>of</strong> the optical spectrum. Moreover,the recombination radiation <strong>of</strong> <strong>femtosecond</strong>-<strong>laser</strong>-producedplasmas is weak because only one ‘set’ <strong>of</strong> free electrons is producedthat recombines after the end <strong>of</strong> the <strong>laser</strong> pulse. Theenergy density will remain small also at energies above thethreshold for bubble formation because <strong>of</strong> the shielding <strong>of</strong> thefocal region by plasma formation upstream <strong>of</strong> the focus [80,126, 136–139] (see Sect. 3.2). Therefore, bubble formation is
1034 Applied Physics B – Lasers and OpticsPulse Wave- NA Gaussian Measured Diffraction- Breakdownduration length or (G) spot limited criterion E th F th I th I rate Source Factors influencing(nm) focusing Top hat diameter spot Bubble (B) (µJ) (J/cm 2 ) ×10 11 ×10 11 the measuredangle (T) (µm) (µm) Luminescence (L) (W/cm 2 ) (W/cm 2 ) threshold value10 ns 1064 14 ◦ G 4.0 L 400 3200 3.2 [178] Spherical aberrations,ps spikes because<strong>of</strong> longitudinalmode beating7 ns 1064 G 75 L 245 0.35 [99, 100] Longitudinalmode beating,self-focusing6 ns 1064 32 ◦ G 5.4 L 89.9 396 0.66 1.79 [15] Longitudinalmode beating6 ns 532 22 ◦ G 5.3 L 38.5 174 0.29 6.06 [15] Longitudinalmode beating6 ns 1064 NA 0.9 T 1.44 L 18.3 1122 1.87 [3] Longitudinalmode beating,absorptionin microscopeobjectivenot considered6 ns 532 NA 0.9 T 0.72 L 1.89 462 0.77 [3] Longitudinalmode beating;absorptionin microscopeobjectivenot considered220 ps 1064 G 37 L 64.9 2.95 1.81 (100 ps) [99, 100] Self-focusing200 ps 800 NA 0.65 T 1.50 B 4.0 90.4 4.52 2.90 (100 ps) [179, 180] Spherical aberrations60 ps 532 16.7 ◦ T 7.2 L 10.0 24.4 4.07 6.63 (100 ps) [136] Moderate spher.aberrations40 ps 1064 14 ◦ G 4.0 B 1.6 64.0 16 [178] Spherical aberrations30 ps 1064 G 37 L 19.2 6.41 [99, 100] Self-focusing30 ps 1064 22 ◦ G 4.7 L 2.38 13.6 4.53 2.67 (10 ps) [15]30 ps 532 22 ◦ G 3.4 L 1.01 11.3 3.75 6.19 (10 ps) [15]3 ps 580 16.7 ◦ TG 10.8 B 1.1 1.25 4.15 [136] Moderate spher.aberrations3 ps 580 16 ◦ G 5.0 B 0.51 2.6 8.5 15.3 [80, 81](1 ps, 532 nm)300 fs 580 16.7 ◦ TG 10.8 B 1.0 1.1 36.0 [136] Moderate spher.aberrations,self-focusing300 fs 580 16 ◦ G 5.0 B 0.29 1.4 47.6 [15] Self-focusing150 fs 620 5.0 B 0.87 58.0 [181] Self-focusing150 fs 620 5.0 B 1.3 86.7 [181] Self-focusing125 fs 580 16.7 ◦ TG 10.8 B 0.35 0.4 30.6 [136] Moderate spher.aberrations,self-focusing100 fs 580 16 ◦ G 4.4 B 0.17 1.1 111.0 55.9 (532 nm) [80, 81] Self-focusing100 fs 800 NA 0.65 T 1.50 B ≈ 0.1 5.64 564 65.4 [182] Spherical aberrations44 fs 810 ≈ 16 ◦ G ≈ 10 B 0.19 0.22 50 [183] Strong self-focusingTABLE 1 Experimental optical breakdown thresholds for water, together with calculated threshold values obtained using the criterion ϱ cr = 10 21 cm −3 .Whenever the spot size was determined in the experiment, the measured spot size is quoted and used for the threshold calculations. Measured spot sizes referto the ‘linear’ size, without the influence <strong>of</strong> self-focusing. When the spot diameter was not measured, the diffraction-limited spot size is quoted and used forcalculating the thresholds. Spot sizes refer to the 1/e 2 values <strong>of</strong> the intensity for irradiation with a Gaussian beam pr<strong>of</strong>ile, and to the first minimum <strong>of</strong> theAiry function for irradiation with a top-hat beam pr<strong>of</strong>ile. Factors compromising the accuracy <strong>of</strong> the measured threshold data are listed in the column on thefar right <strong>of</strong> the tablea more useful breakdown criterion for ultra-short <strong>laser</strong> pulsesthan plasma luminescence.Experimental data on breakdown thresholds. A comparisonbetween experimental threshold data from various researchersand threshold values predicted by our model is presentedin Table 1. Note that calculated values refer to the peak powerin the <strong>laser</strong> pulse and in the focal spot while experimental dataare <strong>of</strong>ten calculated using the average power in the <strong>laser</strong> pulseand within the focal area.Our numerical predictions lie within the range <strong>of</strong> experimentaldata for all pulse durations. However, that does notmean very much considering the fact that the experimentaldata scatter within a range <strong>of</strong> one order <strong>of</strong> magnitude for <strong>femtosecond</strong>and nanosecond pulses, and only slightly less for picosecondpulses. These large variations reflect the difficulty <strong>of</strong>performing precise threshold measurements in the bulk <strong>of</strong> water.Ideally, high-quality <strong>laser</strong> beams and diffraction-limitedfocusing optics should be employed, the spot size should bemeasured to control the beam quality, and I th should be calcu-
VOGEL et al. <strong>Mechanisms</strong> <strong>of</strong> <strong>femtosecond</strong> <strong>laser</strong> <strong>nanosurgery</strong> <strong>of</strong> cells and tissues 1035lated using the measured spot size. However, in various studies,the quality <strong>of</strong> the <strong>laser</strong> beam and focusing optics were farfrom optimal and, nevertheless, the diffraction-limited spotsize has been used for the calculation <strong>of</strong> I th . In the presence <strong>of</strong>aberrations, this leads to erroneously large threshold values.Even when the spot size is measured, aberrations will lead t<strong>of</strong>alse results because breakdown occurs in hot spots within thefocal region that are smaller than the measured spot size. Thethreshold values determined in this way are, therefore, smallerthan the actual values [184]. Many breakdown experimentswere performed by focusing a <strong>laser</strong> beam into a glass cellby means <strong>of</strong> external focusing optics. Even when this opticsis <strong>of</strong> high quality, the glass cell itself will introduce sphericalaberrations. This source <strong>of</strong> error can be avoided by usingwater-immersion microscope objectives built into the wall <strong>of</strong>the cell [3].For nanosecond pulses, longitudinal mode beating in the<strong>laser</strong> resonator will usually produce intensity spikes <strong>of</strong> picosecondduration with amplitudes up to 4–5 times as large asthe averaged intensity. Such statistical fluctuations <strong>of</strong> the peakirradiance are a major cause <strong>of</strong> the wide statistical distribution<strong>of</strong> optical breakdown thresholds and substantially reducetheir absolute values [185, 186]. Therefore, single-frequency<strong>laser</strong>s providing a temporally Gaussian pulse shape shouldbe used for threshold measurements. However, to date allmeasurements <strong>of</strong> nanosecond optical breakdown thresholdsin water have been performed with longitudinally multimode<strong>laser</strong> beams.To avoid a change <strong>of</strong> the focal spot size by nonlinearbeam propagation, sufficiently large focusing angles must beused [5, 15, 187]. While this is easy to achieve for nanosecondpulses, a numerical <strong>aper</strong>ture NA ≥ 0.9 is required fora pulse duration <strong>of</strong> 100 fs to be sure to exclude a diminution<strong>of</strong> the spot size by self-focusing and the corresponding apparentreduction <strong>of</strong> the breakdown threshold [5]. To date, nothreshold data obtained with such large NAs are available forultra-short <strong>laser</strong>-induced breakdown in water. We must concludethat the present experimental data basis is not reliableenough to perform a thorough comparison with theoreticalpredictions. Future measurements with aberration-free temporallyGaussian <strong>laser</strong> pulses focused at large NA will have t<strong>of</strong>ill this gap.In addition, a better adjustment <strong>of</strong> the numerical breakdowncriterion to the experimental criterion <strong>of</strong> bubble formationis needed to enable a meaningful comparison <strong>of</strong> experimentaldata with model predictions. While bubble formationrequires an approximately constant energy density within thefocal volume for all <strong>laser</strong> pulse durations and wavelengths,the energy density associated with a fixed value <strong>of</strong> the freeelectrondensity, such as ϱ cr = 10 21 cm −3 , varies considerablywith pulse duration. Thus, the assumption <strong>of</strong> a constant freeelectrondensity as breakdown criterion is quite arbitrary, especiallyfor cases where the threshold is smooth, i.e. whereϱ max increases continuously with irradiance. In these casesit seems more reasonable to relate the critical free-electrondensity to the energy density within the medium that leadsto bubble formation. Equation (17) provides the required linkbetween electron and energy densities, and an analysis <strong>of</strong>ϱ max (I/I rate ) curves (Figs. 3 and 5) then yields the correspondingthreshold irradiance.The new threshold definition for the numerical model willyield a better match between the experimentally observedand numerically predicted wavelength dependence <strong>of</strong> breakdownthresholds than the values in Table 1. Experimentally,the thresholds for ns and ps pulses decrease with decreasingwavelength [3, 15], but values calculated with a constant ϱ crshow the opposite trend. Previous calculations revealed a relativelysmooth threshold for ns and ps breakdown with visibleand UV wavelengths, in contrast to the sharp threshold forIR wavelengths shown in Fig. 3c [91]. Calculated thresholdvalues based on the new definition will for IR wavelengthsthus be the same as those obtained with ϱ cr = 10 21 cm −3 ,butthey will be lower for visible and UV wavelengths, in accordwith experimental observations.6.4 Cavitation bubble dynamicsFigure 18 shows a two-dimensional representation<strong>of</strong> the evolution <strong>of</strong> the thermoelastic stress wave and <strong>of</strong> theregion in which the kinetic spinodal is surpassed (bubble nucleus)for a peak temperature <strong>of</strong> 200 ◦ C, slightly above thethreshold for bubble formation. The subsequent bubble dynamicscalculated for cases 1 and 2 described in Sect. 6.1 ispresented in Fig. 19. It turned out that for a vapor pressurethat changes adiabatically with bubble size (case 2 in Fig. 19b)the bubble motion is very similar to the case where the vaporpressure is not taken into account at all and only the negativepressurepulse drives the bubble expansion (not shown). Figure20 shows the maximum bubble radii for case 1 and case2 as a function <strong>of</strong> the maximum temperature achieved in thecenter <strong>of</strong> the focal volume, together with the radius <strong>of</strong> the nucleus,R 0 . Close to threshold, the actual bubble radius willprobably resemble case 1 in which the bubble nucleus is assumedto be much smaller than the focal region. For energieswell above threshold, the predictions obtained for case 2 becomemore realistic.The most prominent feature <strong>of</strong> the transient bubbles producedclose to the threshold <strong>of</strong> <strong>femtosecond</strong> optical breakdownis their small size and short lifetime. The bubble radiusamounts to only about 200 nm in water, and will be evensmaller in a visco-elastic medium such as the cytoplasm. Thismakes a dissection mechanism associated with bubble formationcompatible with intracellular <strong>nanosurgery</strong>, in contrastto nanosecond optical breakdown (τ L = 6ns,λ= 1064 nm)where the smallest bubble radius in water observed for NA =0.9 was R max = 45 µm [3]. The small bubble size correspondsto a small energy,E B = 4π 3 (p ∞ − p v )R 3 max , (21)<strong>of</strong> the expanded bubble. For the case presented in Fig. 19a, itamounts to 5.3 × 10 −15 J (5.3 femtojoules). The smallness <strong>of</strong>the bubble energy is largely due to the small energy content <strong>of</strong>the stress transient creating the bubble. This energy is equal tothe energy stored in thermoelastic compression <strong>of</strong> the heatedfluid volume [156],E TE = 12ϱ 0 c 2 0∫p 2 0 dV , (22)
1036 Applied Physics B – Lasers and Opticswhere p 0 is the initial thermoelastic pressure generated underconditions <strong>of</strong> stress confinement and the integration encompassesthe entire volume that is heated by the <strong>laser</strong> pulse. Fora temperature rise in the center <strong>of</strong> the focal volume <strong>of</strong> 180 ◦ Csuch as in Fig. 19 that leads to a maximum pressure p 0 <strong>of</strong>221 MPa, E TE amounts to 7.8 × 10 −14 J. For comparison, thetotal heat content <strong>of</strong> the plasma isE tot = ϱ 0 C p∫∆T dV , (23)giving E tot = 1.66 × 10 −11 J under the same conditions. Theenergetic conversion efficiency from heat into the thermoelasticwave is therefore E TE /E tot = 0.46%, and the conversionefficiency from thermoelastic energy into bubble energy is6.8%. This result <strong>of</strong> a low conversion efficiency from absorbed<strong>laser</strong> energy into mechanical energy for <strong>femtosecond</strong>pulses is in agreement with experimental results [80, 128]. Bycontrast, for nanosecond optical breakdown with NA = 0.9the conversion efficiency was experimentally found to be12.7% for λ = 1064 nm and 3.3% for λ = 532 nm at the breakdownthreshold, and it reached values <strong>of</strong> 53% and 33.5%,respectively, for energies 10-fold above threshold [3].FIGURE 18 Two-dimensional plots <strong>of</strong> the thermoelastic stress evolution(left) and <strong>of</strong> the region in which the kinetic spinodal limit is exceeded (right).This region demarcates the size <strong>of</strong> the bubble nucleus that is then expandedby the thermoelastic tensile stress wave. The calculations were performed fora peak temperature <strong>of</strong> 200 ◦ CExperimental data on cavitation bubble dynamics. Timeresolvedinvestigations <strong>of</strong> the effects <strong>of</strong> transient <strong>femtosecond</strong><strong>laser</strong>-inducedbubbles on cells are not yet available. However,Dayton et al. investigated the oscillations <strong>of</strong> 1.5-µm-radiusbubbles that were phagocytosed by leukocytes and stimulatedby a rarefaction-first one-cycle acoustic pulse with 440 ns duration[188]. By means <strong>of</strong> streak photography and high-speedphotography with 100 Mill. f/s they observed that phagocytosedbubbles expanded about 20%–45% less than freemicrobubbles in response to a single acoustic pulse <strong>of</strong> thesame intensity. The difference is due to the viscosity <strong>of</strong> thecytoplasm and the elastic modulus <strong>of</strong> the cytoskeleton. Bubblessubjected to a tensile-stress amplitude <strong>of</strong> 0.9MPawouldexpand to a radius <strong>of</strong> 6 µm without rupturing the cell membrane.Larger oscillations would cause immediate cell lysis.The viability <strong>of</strong> the non-lysed cells after insonation was nottested, but it is evident that the bubble oscillations strain thecell membrane and deform or even rupture the cytoskeleton.In the case <strong>of</strong> <strong>femtosecond</strong> optical breakdown, the radius <strong>of</strong>the bubble nucleus is much smaller (≈ 90 nm compared to1.5 µm), and the tensile-stress transient acting on the bubblesis much shorter than in the case investigated by Dayton(≈ 100 ps compared to 220 ns). Therefore, the resulting bubblescause little structural damage within a cell and do notaffect cell viability.Lin et al. investigated the thresholds for cell death producedby cavitation induced around absorbing microparticlesirradiated by nanosecond <strong>laser</strong> pulses [189, 190]. Theyobserved that an energy <strong>of</strong> 3nJ absorbed by a single particle<strong>of</strong> 1-µm diameter produced sufficiently strong cavitationto kill a trabecular meshwork cell after irradiation witha single <strong>laser</strong> pulse. Pulses with 1-nJ absorbed energy producedlethality after several exposures [189]. Viability waslost even when no morphological damage was apparent immediatelyafter the collapse <strong>of</strong> the transient bubble with lessthan 1-µs lifetime (according to the Rayleigh equation [96,191], 1-µs lifetime corresponds to R max = 5.5 µm). Nuclear
VOGEL et al. <strong>Mechanisms</strong> <strong>of</strong> <strong>femtosecond</strong> <strong>laser</strong> <strong>nanosurgery</strong> <strong>of</strong> cells and tissues 1037FIGURE 19 Radius–time curve <strong>of</strong> the cavitation bubble produced by a single <strong>femtosecond</strong> <strong>laser</strong> pulse focused at NA = 1.3 that leads to a peak temperature<strong>of</strong> T max = 200 ◦ C at the focus center. The radius <strong>of</strong> the bubble nucleus is R 0 = 91.1 nm. The temperature at the wall <strong>of</strong> the nucleus is T wall = 145 ◦ C, and themean temperature averaged over all volume elements within the bubble nucleus is T mean = 168 ◦ C. The R(t) curve in (a) was calculated under the assumptionthat the vapor pressure within the bubble is given by the mean temperature within the nucleus and decays due to heat diffusion (case 1, see text). The curve in(b) was calculated assuming that the vapor pressure drops adiabatically during bubble expansion (case 2)FIGURE 20 Maximum bubble radii for cases 1 and 2 as a function <strong>of</strong> themaximum temperature achieved in the center <strong>of</strong> the focal volume, togetherwith the radius <strong>of</strong> the nucleus, R 0staining <strong>of</strong> non-viable cells by ethidium bromide confirmedthat cell death was associated with membrane damage. Accordingto Neumann and Brinkmann [192], a bubble radius <strong>of</strong>3 µm within a cell <strong>of</strong> 7.5-µm radius is sufficient to cause anenlargement <strong>of</strong> the membrane by 4% that will result in membranerupture [193]. The results <strong>of</strong> our calculations in Fig. 20demonstrate that the radius <strong>of</strong> fs-<strong>laser</strong>-produced transient bubblesremains well below this damage threshold. This applieseven for <strong>laser</strong> pulse energies <strong>of</strong> a few nanojoules because forϱ cr = 10 21 cm −3 and 1-µm plasma length about 99% <strong>of</strong> theincident energy is transmitted through the focal region [81].The heated volume is much smaller than the volume <strong>of</strong> themicroparticles investigated by Lin et al. [189], and the depositedheat energy corresponding to a peak temperature <strong>of</strong>T max = 200 ◦ C or 300 ◦ C is only 16.6 or 25.8pJ, respectively,much less than in Lin’s case.Bubbles around gold nanoparticles are <strong>of</strong> interest in thecontext <strong>of</strong> nanoparticle cell surgery (Sect. 1.1). When particleswith 4.5-nm radius were irradiated by 400-nm, 50-fspulses, bubbles <strong>of</strong> up to 20-nm radius were observed by means<strong>of</strong> X-ray scattering techniques [194]. The small size <strong>of</strong> thesebubbles, which is one order <strong>of</strong> magnitude less than for thoseproduced by focused <strong>femtosecond</strong> <strong>laser</strong> pulses, is consistentwith the fact that the collective action <strong>of</strong> a large number<strong>of</strong> nanoparticles is required to produce the desired surgicaleffect.Membrane damage can also be induced by bubble oscillationsthat occur largely outside the cell [195], such as in<strong>laser</strong> optoporation [50]. Rupture (or at least poration) <strong>of</strong> thecell membrane requires strains larger than 2%–3% [193, 196].Again, no time-resolved investigations <strong>of</strong> the <strong>laser</strong>-based procedureare yet available, but cell poration and lysis induced bythe dynamics <strong>of</strong> pressure-wave-excited bubbles have alreadybeen studied [197]. These effects are <strong>of</strong> interest in the context<strong>of</strong> transient membrane permeabilization <strong>of</strong> cells for thetransfer <strong>of</strong> genes or other substances.So far, we have only discussed the transient bubbles producedby single <strong>laser</strong> pulses. These bubbles can only be detectedby very fast measurement schemes. However, duringhigh-repetition-rate pulse series accumulative thermal effectsand chemical dissociation <strong>of</strong> biomolecules come into play(Sects. 4 and 5.2) that can produce long-lasting bubbles thatare easily observable under the microscope [86, 88, 89]. Dissociation<strong>of</strong> biomolecules may provide inhomogeneous nucleithat lower the bubble-formation threshold below the superheatlimit defined by the kinetic spinodal. Even thoughthermoelastic forces may still support the bubble growth, itis mainly driven by boiling <strong>of</strong> cell water and by chemicalor thermal decomposition <strong>of</strong> biomolecules into small volatilefragments. After the end <strong>of</strong> the fs pulse train, the vapor willrapidly condense but the volatile decomposition products willdisappear only by dissolution into the surrounding liquid andthus form a longer-lasting bubble.Long-lasting ‘residual’ bubbles have also been observedafter pulse series <strong>of</strong> 3.8-kHz repetition rate where, accordingto our results Sect. 5.2, accumulative thermal effects canbe excluded, but they were seen only when fairly large pulseenergies <strong>of</strong> ≥ 180 nJ were applied [198]. The experimentswere performed using a numerical <strong>aper</strong>ture <strong>of</strong> NA = 0.6.Ourtemperature calculations revealed that, at this NA, the energyrequired to produce any specific temperature rise is 22.7 times
1038 Applied Physics B – Lasers and Opticslarger than for NA = 1.3. Therefore, the thermal and chemicaleffects <strong>of</strong> single pulses are sufficiently strong to producea certain amount <strong>of</strong> non-condensable gas by disintegration <strong>of</strong>the biomolecules. Rectified diffusion <strong>of</strong> dissolved air into theoscillating transient bubbles will further contribute to the formation<strong>of</strong> residual, long-lasting bubbles (see Refs. [199, 200]and Ref. [201], Chap. 6).7 Implications for <strong>laser</strong> effects on biological cellsand tissuesTwo parameter regimes have been established for<strong>femtosecond</strong> <strong>laser</strong> <strong>nanosurgery</strong>: one technique uses longpulse series from fs oscillators with repetition rates <strong>of</strong> theorder <strong>of</strong> 80 MHz and pulse energies well below the opticalbreakdown threshold [4, 37, 53, 55, 77, 86, 89, 95, 98]. From40 000 pulses [4] to several million pulses [53, 77] have beenapplied at one specific location to achieve the desired dissectionor membrane permeabilization. The other approachuses amplified pulse series at 1-kHz repetition rate with pulseenergies slightly above the threshold for transient bubble formation[79, 83, 84]. Here the number <strong>of</strong> pulses applied at onelocation varied between 30 [83] and several hundred [79, 84].Based on the discussion <strong>of</strong> the physical effects associatedwith <strong>femtosecond</strong>-<strong>laser</strong>-induced plasma formation in the previoussections, we now proceed to explain the working mechanisms<strong>of</strong> both modalities for cell surgery. For this purpose,the different low-density plasma effects and physical breakdownphenomena are summarized in Fig. 21, together withexperimental damage, transfection, and dissection thresholdson cells. The different effects are scaled by the correspondingvalues <strong>of</strong> free-electron density and irradiance.Chemical cell damage (2) refers to membrane dysfunctionand DNA strand breaks leading to apoptosis-like celldeath observed after scanning irradiation <strong>of</strong> PtK2 cells with800-nm pulses at 80-MHz repetition rate [144]. Chromosomedissection (3) relates to the intranuclear chromosome dissection[4], and (4) to cell transfection by transient membranepermeabilization [53], both performed using 80-MHz pulsetrains from a <strong>femtosecond</strong> oscillator. Mitochondrion ablation(8) refers to the ablation <strong>of</strong> a single mitochondrion ina living cell using 1-kHz pulse trains [85], and axon dissection(9) applies to axotomy in live C. elegans worms carriedout with sequences <strong>of</strong> pulses emitted at 1-kHz repetitionrate from a regenerative amplifier [79]. Points (1), (5), (6)and (7) stand for physical events or threshold criteria. Therespective <strong>laser</strong> parameters and the absolute values <strong>of</strong> irradianceand free-electron density for each point are listedin Table 2.7.1 Femtosecond pulse trains at MHz repetition rateswith energies below the thresholdfor bubble formationThe irradiance threshold (2) for cell death inducedby <strong>laser</strong> pulse series <strong>of</strong> 80-MHz repetition rate scanned overthe entire cell volume (0.067 × I rate ) is lower than the irradiancethreshold for intracellular dissection (3). However,this does not imply that intracellular dissection with 80-MHzpulse series must lead to severe cell damage, because locallyconfined irradiation does not affect cell viability in the sameway as scanning irradiation.The threshold for intranuclear chromosome dissectionwith 80-MHz pulse series (3) is almost four times as largeas the irradiance (1) producing one free electron per pulsein the focal volume (0.15 × I rate vs 0.04 × I rate ). In fact,about 1000 free electrons per pulse are produced with theparameters used for dissection. Therefore, it is very likelyFIGURE 21 Overall view <strong>of</strong> physicalbreakdown phenomena inducedby <strong>femtosecond</strong> <strong>laser</strong> pulses, togetherwith experimental damage,transfection, and dissection thresholdsfor cells. The different effectsare depicted together with the correspondingvalues <strong>of</strong> free-electrondensity and irradiance. The irradiancevalues are normalized to theoptical breakdown threshold I th definedby a critical electron density<strong>of</strong> ϱ cr = 10 21 cm −3 . All data referto plasma formation in water with<strong>femtosecond</strong> pulses <strong>of</strong> about 100-fsduration and 800-nm wavelength;the exact pulse durations are givenin Table 2
VOGEL et al. <strong>Mechanisms</strong> <strong>of</strong> <strong>femtosecond</strong> <strong>laser</strong> <strong>nanosurgery</strong> <strong>of</strong> cells and tissues 1039Pulse Energy Repetition Dwell time Number Electron Volum. Irradiance NormalizedEffect duration (nJ) rate (ms) <strong>of</strong> density energy (×10 12 irradiance(fs) Average pulses (cm −3 ) density W cm −2 ) I/I rateNA power per spot (J cm −3 )(1) One free 100 Single – 1 2.1 × 10 13 4.9 × 10 −5 0.26 0.04electronpulseper pulse 1.3(2) Chemical cell 0.6damage after 90 0.0875 80 MHz per cell 4.8 × 10 4 1.5 × 10 14 3.5 × 10 −4 0.44 0.067scanning irrad. per cell for one[144] 1.3 7 mW pulse(3) Intranuclear 170 0.38 80 Mhz 0.5 per 4 × 10 4 2.0 × 10 16 4.7 × 10 −2 1.0 0.15chromosome chromosome for onedissection 1.3 dissection pulseat 80 MHz [4]30 mW(4) Cell trans- 170 0.6–1.2 80 MHz 12 9.6 × 10 5 5–200 1.2–47 1.6–3.1 0.25–0.48fection ×10 17 for oneat 80 MHz [53] 1.3 50–100 mW pulse(5) ∆T <strong>of</strong> 100 ◦ C 100 80 MHz ≥ 0.1 ≥ 0.8× 2.1 × 10 19 50 3.3 0.51after many 10 4 for onepulses 1.3 pulse(6) Bubble 100 Single – 1 2.36 × 10 20 551 5.1 0.78formationpulsein pure water 1.3(7) Bd threshold 100 – 1 1.0 × 10 21 2.6 × 10 3 6.54 1in numericalmodels(8) EYFP-tagged 100 2 1 kHz > 100 Several ≥ 10 21 ≥ 2.6 × 10 3 10.5 1.6mitochondrionhundredablation 1.4at 1 kHz [85](9) Axon 200 10 1 kHz 400 400 ≥ 10 21 ≥ 2.6 × 10 3 52 8.0dissection inC. elegans 1.4at 1 kHz [79]TABLE 2 Numerical values <strong>of</strong> the data presented in Fig. 21. All data refer to a <strong>laser</strong> wavelength <strong>of</strong> λ = 800 nm, and water as breakdown medium. Theexperimental irradiance values assume diffraction-limited focusing conditions and a perfect <strong>laser</strong> beam. They refer to the peak irradiance in the <strong>laser</strong> focus(≈ 2× average irradiance within the spot diameter) to make them comparable with the calculated values. The actual irradiance in the experiments is probablysomewhat smaller than the values calculated under these assumptions. For superthreshold irradiance values, the plasma will grow in size, and plasma shieldingand reflection will limit the growth <strong>of</strong> the free-electron density. Therefore, no exact values <strong>of</strong> the electron density and energy density are giventhat the intracellular ablation produced by long trains <strong>of</strong><strong>femtosecond</strong> pulses in the low-density plasma regime relieson cumulative free-electron-mediated chemical effects.This hypothesis is supported by the facts that the individualpulses produce a thermoelastic tensile stress <strong>of</strong> only≈ 0.014 MPa, and a pulse series <strong>of</strong> 100-µs duration resultsin a temperature rise <strong>of</strong> only ≈ 0.076 ◦ C.Thesevaluesfor tensile stress and temperature rise are far too small tocause any cutting effect or other type <strong>of</strong> cell injury. Thebreaking <strong>of</strong> chemical bonds, as described in Sect. 4, mayfirst lead to a disintegration <strong>of</strong> the structural integrity <strong>of</strong>biomolecules and finally to a dissection <strong>of</strong> sub-cellular structures.Bond breaking may be initiated both by resonant interactionswith low-energy electrons, and by multiphotonprocesses <strong>of</strong> lower order that do not yet create free electrons[4, 202–204].Interestingly, transient membrane permeabilization forgene transfer (4) requires a considerably larger <strong>laser</strong> dosethan chromosome dissection. Not only is the irradiancelarger, but the number <strong>of</strong> applied pulses (≈ 10 6 )als<strong>of</strong>arexceeds the quantity necessary for chromosome dissection(≈ 4 × 10 4 ). Chromosome dissection may be facilitated by theDNA absorption around 260 nm enabling nonlinear absorptionthrough lower-order multiphoton processes. Moreover,while breakage <strong>of</strong> relatively few bonds is sufficient for chromosomedissection, the creation <strong>of</strong> a relatively large openingis required for diffusion <strong>of</strong> a DNA plasmid through thecell membrane. The corresponding <strong>laser</strong> parameters are stillwithin the regime <strong>of</strong> free-electron-mediated chemical effectsbut already quite close to the range where cumulative heateffects start to play a role (5).At larger <strong>laser</strong> powers, bubbles with a lifetime <strong>of</strong> the order<strong>of</strong> a few seconds were observed that probably arise fromdissociation <strong>of</strong> biomolecules into volatile, non-condensablefragments [86, 88, 89, 205]. This dissociation <strong>of</strong> relativelylarge amounts <strong>of</strong> biomaterials can be attributed both t<strong>of</strong>ree-electron chemical and photochemical bond breakingas well as to accumulative thermal effects. The appearance<strong>of</strong> the bubbles is an indication <strong>of</strong> severe cell damageor cell death within the targeted region and defines anupper limit for the <strong>laser</strong> power suitable for <strong>nanosurgery</strong>.A criterion for successful intratissue dissection at lower energylevels is the appearance <strong>of</strong> intense aut<strong>of</strong>luorescencein perinuclear cell regions [86, 88] that is likely due tothe destruction <strong>of</strong> mitochondria at the rim <strong>of</strong> the <strong>laser</strong>cut [98].
1040 Applied Physics B – Lasers and Optics7.2 Femtosecond pulses at kHz repetition rates withenergies above the bubble-formation thresholdWhen pulse trains <strong>of</strong> 1-kHz repetition rate are employedfor <strong>nanosurgery</strong>, pulse energies in the range 2–40 nJare used [79, 83–85]. Examples are the ablation <strong>of</strong> single mitochondria(8) by several hundred 2-nJ pulses [85] and thesevering <strong>of</strong> axons in a live C. elegans worm (9) with a similarnumber <strong>of</strong> 10-nJ pulses [79]. These energies are above thethreshold for thermoelastically induced formation <strong>of</strong> minutetransient cavitation bubbles (6), and are thus associated withmechanical disruption effects. The tensile thermoelastic stresswaves enable dissection <strong>of</strong> cellular structures at low volumetricenergy densities, and the small size <strong>of</strong> the heated volume(Fig. 8) correlates with a radius <strong>of</strong> the expanded bubble <strong>of</strong>the order <strong>of</strong> only 120–300 nm (Fig. 20). This explains whyfs-<strong>laser</strong>-induced bubble formation does not necessarily leadto cell damage whereas ns-<strong>laser</strong>-induced bubble generation isusually associated with cell death [61, 189, 190, 192, 206].Due to the contribution <strong>of</strong> mechanical effects to dissection,the total energy required for <strong>nanosurgery</strong> with kHz pulseseries is less than the total energy necessary with MHz pulsetrains. For example, ablation <strong>of</strong> a mitochondrion using 1-kHzpulses required a total energy <strong>of</strong> less than 1 µJ [85], while forintranuclear chromosome dissection with 80-MHz pulses anenergy <strong>of</strong> 15 µJ was needed [4].For sufficiently large pulse energies, bubble expansion andshock-wave pressure can cause effects far beyond the focalvolume, which lead to cell death [83, 198, 207]. To avoid unwantedside effects, irradiances should be used that are onlyslightly above the bubble-formation threshold. Useful techniquesfor an on-line monitoring <strong>of</strong> the ablation thresholdduring <strong>laser</strong> surgery are to detect the onset <strong>of</strong> photobleaching,or <strong>of</strong> light scattering by bubbles generated at the <strong>laser</strong>focus. Heisterkamp et al. found that the threshold for photobleachingis just below the ablation threshold [84]. Neumannand Brinkmann described a light-scattering technique for anon-line detection <strong>of</strong> micrometer-sized bubbles produced bypulsed <strong>laser</strong> irradiation [208].We conclude that, depending on the repetition rate <strong>of</strong> thefs <strong>laser</strong> pulses, <strong>nanosurgery</strong> relies on two very different mechanisms.With oscillator pulse trains at MHz repetition rates,dissection is due to accumulative chemical effects in lowdensityplasmas. In this regime, no transient bubbles withsub-microsecond lifetime are produced, and the formation <strong>of</strong>long-lived bubbles by accumulative chemical and thermal effectsmust be avoided. With pulse trains at kHz repetitionrates, the accumulative creation <strong>of</strong> chemical effects wouldtake too long to be practical. Therefore, the pulse energies areraised to a level where the thermoelastic generation <strong>of</strong> minutetransient bubbles enables us to achieve nanodissections. Dueto their short lifetime <strong>of</strong> less than 100 ns and the long time intervalsbetween the <strong>laser</strong> pulses, no cumulative bubble growthoccurs as long as pulse energies close to the bubble-formationthreshold are used.7.3 Comparison with long-pulsed and cw irradiationIn their pioneering work, Berns et al. [69, 70]used high-power argon-<strong>laser</strong> irradiation in multiline operation(with wavelengths <strong>of</strong> 488 nm and 514 nm) applied in 25–30-µs pulses. Other researchers employed longer exposure times<strong>of</strong> 0.25 s [47] and 1 to 2.5s[52] at smaller <strong>laser</strong> power. Bernset al. [34] related the spatial extent <strong>of</strong> their <strong>laser</strong> effects simplyto the irradiance distribution in the focal region. However,with the exposure times used, the energy deposition is broadenedby thermal diffusion. For large numerical <strong>aper</strong>tures thefocal volume has an almost spherical shape, and the characteristicthermal diffusion time t d is approximately given as [124]t d = d 2 /8κ, (24)where κ is the thermal diffusivity and d the focal diameter.Thermal confinement <strong>of</strong> the energy deposition requiresthat the <strong>laser</strong> exposure is shorter than the thermal diffusiontime [2]. For a focal spot diameter <strong>of</strong> 480 nm in aqueous media(λ = 514 nm, NA = 1.3), this is the case only for <strong>laser</strong>pulse durations < 210 ns; for longer <strong>laser</strong> exposures such asused by Berns et al. [34] the temperature distribution is broadened.We have seen in Sect. 5.3 (Fig. 12) that the distributionclose to the focus center becomes stationary after about 10 µs.This implies that the spatial extent <strong>of</strong> effects from <strong>laser</strong> pulseslonger than 10 µs is similar to that <strong>of</strong> lesions arising from cw<strong>laser</strong> irradiation. Nevertheless, the temperature distribution isvery narrow even for cw irradiation, because from a pointlikesource the heat can diffuse in all spatial directions and,therefore, the temperature drops very quickly with growingdistance from the source.Effects created by long-pulsed or cw irradiation usuallyrely on linear (one-photon) absorption. For argon-<strong>laser</strong> irradiationat wavelengths <strong>of</strong> 488 nm and 514 nm that can be welltransmitted into a cell, the <strong>laser</strong> power needed for surgeryin unstained cells exceeds 1W [70]. It is thus considerablyhigher than the average power <strong>of</strong> about 30 mW necessary with<strong>femtosecond</strong> <strong>laser</strong> pulse trains at 800 nm [4, 37], for whichplasma formation induced by the ultra-short <strong>laser</strong> pulses resultsin a dramatic local increase <strong>of</strong> the absorption coefficientat the focus, regardless <strong>of</strong> the linear absorption coefficient.Berns et al. speculated that high-power argon-<strong>laser</strong>cell surgery is most likely a multiphoton mechanism [34].However, even though two-photon-excited visible fluorescencewas observed in experiments with a 760-nm cw <strong>laser</strong>beam [209], multiphoton absorption is unlikely to be the dominantabsorption mechanism considering the fact that the focalirradiance for 1-W <strong>laser</strong> power (5.5 × 10 8 Wcm −2 is threeorders <strong>of</strong> magnitude less than the irradiance required for intracellulardissection with 800-nm, 170-fs pulses. The focal irradianceused for quasi-cw cell surgery is also much lower thanthe irradiances used for multiphoton microscopy [210, 211].Thus, there is little doubt that quasi-cw cell surgery is basedon the linear absorption in the target structures, whereas ultrashort-pulsedsurgery relies on nonlinear absorption.It was shown above that no purely thermal effects can beproduced using ultra-short <strong>laser</strong> pulses. All thermal effectsare accompanied by free-electron-mediated chemical effectsand thermoelastic mechanical effects. By contrast, quasi-cwcell surgery is mediated by local thermolysis and the formation<strong>of</strong> minute vapor bubbles. The temperatures required forthermolysis depend on the heat-exposure time [212], and arewell above 100 ◦ C for heat-exposure durations in the millisec-
VOGEL et al. <strong>Mechanisms</strong> <strong>of</strong> <strong>femtosecond</strong> <strong>laser</strong> <strong>nanosurgery</strong> <strong>of</strong> cells and tissues 1041ond or microsecond range [57, 213]. The bubble-nucleationthreshold by thermolysis <strong>of</strong> strongly absorbing biomoleculessuch as melanin was found to be about 150 ◦ C for pulse durationsbetween 12 ns and 1.8 µs [208]. This seems to be thelower temperature limit <strong>of</strong> cell surgery using microsecondpulses. The upper limit <strong>of</strong> a localized temperature rise withoutbubble formation is given by the threshold for explosive vaporizationin the entire focal volume that for non-pigmentedcells was found to be about 220 ◦ C [213]. This thresholdis lower than the superheat limit <strong>of</strong> water at ambient pressure(≈ 300 ◦ C) above which homogeneous nucleation andspinodal decomposition will result in a phase explosion [2,159, 163], probably because <strong>of</strong> the heterogeneous structure <strong>of</strong>the cells.The temperatures required for quasi-cw cell surgery areconsiderably higher than those involved in <strong>femtosecond</strong> <strong>laser</strong>dissection by high-repetition-rate fs pulse trains that relies onphotochemical and free-electron-mediated chemical effects(Sect. 7.1). They are in a similar range as the temperaturesneeded for <strong>femtosecond</strong> <strong>laser</strong> surgery at repetition rates below1MHzthat is based on bubble formation by tensile thermoelasticstress (Sect. 7.2).The spatial resolution <strong>of</strong> quasi-cw cell surgery is relatedto the temperature distribution arising from a continuous deposition<strong>of</strong> <strong>laser</strong> energy via linear absorption that was presentedin Fig. 11. Interestingly, it is not much broader than thetemperature distribution arising from nonlinear absorption <strong>of</strong><strong>femtosecond</strong> pulse trains shown in Fig. 10. However, as thespatial resolution <strong>of</strong> <strong>femtosecond</strong> <strong>laser</strong> surgery is given by thewidth <strong>of</strong> the free-electron distribution rather than by the temperaturedistribution, the precision <strong>of</strong> the energy depositionin fs <strong>laser</strong> surgery is considerably better than for cw or longpulsedirradiation. The half-width <strong>of</strong> the free-electron distributionshown in Fig. 8b for λ = 800 nm and NA = 1.3 is only190 nm in the radial direction, compared to the half-widths <strong>of</strong>590 nm and 730 nm <strong>of</strong> the temperature distributions in Fig. 11resulting from irradiation with pulse durations <strong>of</strong> 10 µs and10 ms, respectively. It should be mentioned, however, thatthermal damage is not directly proportional to the temperatureelevation but to the damage integral that is an exponentialfunction <strong>of</strong> temperature [212]. The thermally damaged regioncan therefore be narrower than the half-width <strong>of</strong> the temperaturedistribution [42, 214]. Because <strong>of</strong> this reason, the gain <strong>of</strong>spatial resolution achievable by use <strong>of</strong> ultra-short <strong>laser</strong> pulsesinstead <strong>of</strong> quasi-cw irradiation is less than <strong>of</strong>ten assumed.Using fs pulses, extracellular chromosomes could be completelydissected with an FWHM cut size <strong>of</strong> about 300 nm,which amounts to 40% <strong>of</strong> the diffraction-limited focal spotsize [37]. Berns et al. produced chromosomal lesions <strong>of</strong> lessthan 1-µm size using argon-<strong>laser</strong> irradiation [34]. Thus, thespatial resolution achieved by IR <strong>femtosecond</strong> <strong>laser</strong> surgeryis a factor <strong>of</strong> about three better than that <strong>of</strong> the classical techniqueintroduced more than 30 years ago [69].A major advantage <strong>of</strong> <strong>femtosecond</strong> <strong>laser</strong> surgery is thatit can be performed at arbitrary locations even in media thatare transparent at low irradiances, and with much less averagepower. The use <strong>of</strong> low-power argon <strong>laser</strong>s requires staining<strong>of</strong> the target structures [34, 47, 52, 69]. The need for stainingreduces the versatility <strong>of</strong> the technique compared to <strong>femtosecond</strong><strong>laser</strong> surgery that can be performed at any arbitrarylocation. Another important advantage <strong>of</strong> ultra-short <strong>laser</strong> irradiationis the option to combine material modification withhigh-resolution nonlinear imaging modalities.Recently, Paterson et al. reported that cell-wall permeabilizationis possible with a low-power blue diode <strong>laser</strong>(λ = 405 nm) using0.3-mW irradiation and 40-ms exposuretime [56]. Owing to the short <strong>laser</strong> wavelength, the energyused (13 µJ) was three orders <strong>of</strong> magnitude less than the energyrequired for membrane permeabilization with 488-nmirradiation [52]. It was more than one order <strong>of</strong> magnitudelarger than the energy <strong>of</strong> 0.5 µJ needed with ns pulses [48],but the transfection process with millisecond pulses avoidsmechanical disruptions extending beyond the region <strong>of</strong> the<strong>laser</strong> focus that are a problem with ns pulses [3]. Mechanicaldisruption was also avoided in the study by Tirlapur andKönig who used 80-MHz <strong>femtosecond</strong> pulse trains <strong>of</strong> 800 nmfor membrane permeabilization [53], but the total energy employedwas here about 50 times larger than with the blue diode<strong>laser</strong>. Considering the fact that a blue <strong>laser</strong> diode is less costlythan a <strong>femtosecond</strong> <strong>laser</strong>, the practical advantages <strong>of</strong> ultrashort<strong>laser</strong> pulses for membrane permeabilization still haveto be proven. However, ultra-short <strong>laser</strong> pulses are the tool<strong>of</strong> choice for intracellular and intratissue <strong>nanosurgery</strong> at arbitrarylocations and/or in conjunction with nonlinear imaging.7.4 Potential hazards from low-density plasmasin multiphoton microscopyand second-harmonic imagingA matter <strong>of</strong> concern is that low-density plasmascould be a potential hazard in multiphoton microscopy [203,210, 215–217] and higher-harmonic imaging [86, 218–221].Multiphoton imaging <strong>of</strong> cells is usually done using <strong>femtosecond</strong><strong>laser</strong> pulses <strong>of</strong> about 700–1100-nm wavelength emitted at≈ 80 MHz from an oscillator with mean powers <strong>of</strong> 100 µW upto several milliwatts [210, 211]. Similar mean powers are requiredfor second-harmonic imaging [220]. These <strong>laser</strong> powersare close to the threshold for cell damage reported to bebetween 2mW and 10 mW depending on the damage criterionused, the pulse duration, and the number <strong>of</strong> appliedpulses [4, 82, 98, 144, 202, 203]. They are also close to thevalues used for intracellular and intratissue dissection thatrange from 4 to 100 mW, depending on target structure [4,53, 55, 77, 86, 88]. This suggests that the mechanisms underlying<strong>laser</strong> cell surgery may also contribute to the side effectsin nonlinear imaging.Our results indicate that thermal damage can be ruledout as a cause <strong>of</strong> cell damage in multiphoton microscopy aseven dissection with oscillator pulses does not involve thermaleffects (Fig. 21), and previous studies confirm this finding[222, 223]. In the literature, photodamage produced byshort <strong>laser</strong> pulses is mostly ascribed to multiphoton-inducedphotochemistry [72, 82, 224]. However, a comparison <strong>of</strong> theirradiance thresholds for photodamage with the correspondingfree-electron densities in Fig. 21 shows that the formation<strong>of</strong> low-density plasmas may contribute considerably tothe observed damage or even dominate its creation, especiallyin non-stained targets. An exception is the work <strong>of</strong>Berns et al. [224], who achieved gene manipulation by exposingchromosomes that were sensitized with a dye absorbing
1042 Applied Physics B – Lasers and Opticsat 530-nm wavelength to 100-ps pulses <strong>of</strong> 1064-nm wavelength.The peak irradiance used in these experiments was≈ 10 7 W/cm 2 , far below the threshold for plasma formation,and it is quite clear that in this case the <strong>laser</strong> effects reliedon two-photon-induced photochemical changes withoutthe involvement <strong>of</strong> free electrons. By contrast, the irradiancerequired to induce localized DNA damage in non-stainedchromosomes or cell nuclei was ≈ 10 11 W/cm 2 for 5.7-nspulses <strong>of</strong> 532-nm wavelength [73] and 1.9 × 10 11 W/cm 2 for120-fs pulses <strong>of</strong> 750-nm wavelength [82]. The first irradiancevalue is larger than the optical breakdown threshold inwater at the same pulse duration that was measured to be0.77 × 10 11 W/cm 2 [3]. In the second case, a three-photoninteraction can provide the energy required for molecularexcitation at the DNA absorption peak around 260 nm, butthe irradiance required for photodamage will also generatea free-electron density <strong>of</strong> ≈ 10 13 cm −3 , which borders the regionin which chemical changes may be induced by pulseseries. Eggeling et al. [204] showed that the photobleachingkinetics with <strong>femtosecond</strong> <strong>laser</strong> pulses usually involvesexcitation into higher electronic states close to the ionizationthreshold followed by photolysis, unlike for longer pulsedurations where photobleaching occurs via the triplet state.Heisterkamp et al. [84] found that slightly larger irradiancevalues than those required for photobleaching lead to ablation,a process mediated by plasma formation. Together thesefindings indicate that low-density plasmas may be involvedin the generation <strong>of</strong> ultra-short-<strong>laser</strong>-induced effects that weretraditionally exclusively attributed to direct photochemicalreactions, and may also contribute to photodamage in nonlinearmicroscopy. With increasing irradiance, free-electronmediatedchemical effects become ever more important comparedto direct photochemical reactions because the rate <strong>of</strong>free-electron generation increases very fast with irradiancedue to its high-order nonlinearity.We saw that multiphoton fluorescence excitation bearsa trade-<strong>of</strong>f between low <strong>of</strong>f-focus and severe in-focus photobleaching[204]. This raises the question <strong>of</strong> which <strong>laser</strong>pulse duration, repetition rate, and wavelength are best suitedto minimize the detrimental effects. It was found that at thesame level <strong>of</strong> photodamage pulses with 3–4-ps duration providethe same signal or even an increase in signal comparedto <strong>femtosecond</strong> pulses [202, 203, 217]. The increase in signalis due to the fact that, at constant irradiance, longer pulsesproduce a larger fluorescence excitation yield. The smallerfluorescence yield associated with the use <strong>of</strong> shorter pulsescould be compensated for by an increase in peak power if theirradiance dependences <strong>of</strong> photodamage and multiphoton ionizationwere the same. However, the irradiance dependence <strong>of</strong>photodamage is usually steeper than that <strong>of</strong> multiphoton excitation[72, 202, 203], because photodamage <strong>of</strong>ten involveshigher-order photochemical effects or even ionization. Therefore,the use <strong>of</strong> very short high-intensity <strong>femtosecond</strong> pulsesfor nonlinear imaging involves a larger risk <strong>of</strong> photodamageand seems to be neither essential nor advantageous. A prolongation<strong>of</strong> the pulse duration is, on the other hand, associatedwith an increase <strong>of</strong> average power because the peak power <strong>of</strong>the individual pulses cannot be reduced without loss <strong>of</strong> multiphotonexcitation efficiency. The upper limit <strong>of</strong> useful pulsedurations is set by the average power level leading to cumulativethermal damage. In aqueous media with low absorptioncoefficient in the wavelength range around 800 nm cumulativethermal damage is not produced for power levels up to atleast 100 mW [70, 223].Similar considerations apply for the selection <strong>of</strong> optimumrepetition rates for nonlinear imaging. The limit for themaximum useful repetition rate is defined by the rate <strong>of</strong> energydeposition for which thermal damage starts to occur.This rate depends on the NA <strong>of</strong> the microscope objective(Figs. 10 and 11), and on the linear absorption coefficient<strong>of</strong> the cells or tissues investigated. The limit is especiallylow in pigmented tissues such as skin [205], but in nonpigmentedtissues and cells even GHz repetition rates maybe used. When for pulses <strong>of</strong> constant peak power <strong>of</strong> the individualpulses the <strong>laser</strong> repetition rate was increased from80 MHz to 2 GHz, a much better signal to noise ratio could beachieved within the same image-acquisition time [220]. GHzrepetition rates can also be employed to achieve the same signalstrength with considerably smaller pulse peak power thanwith 80 MHz. This increases the safety margin with respect tophotodamage [220] and is thus <strong>of</strong> special interest for in-vivononlinear microscopy.In second- and third-harmonic imaging, the use <strong>of</strong> longerIR wavelengths than 800 nm was found to be advantageousbecause with a longer wavelength more photons are requiredfor ionization and thus the safety margin increases [86, 220].Also with regard to multiphoton microscopy, it is advantageousto use fluorophores with long excitation wavelengthsthat enable the use <strong>of</strong> longer <strong>laser</strong> wavelengths. In this way,the order <strong>of</strong> the multiphoton process can remain the samefor imaging while the number <strong>of</strong> photons required for ionizationincreases. However, if a specific fluorophore with a givenexcitation wavelength must be employed, the orders <strong>of</strong> thenonlinearities involved in image formation and photodamageincrease in a similar fashion with increasing wavelength.Therefore, the optimum wavelength must in these cases be determinedfor each individual fluorophore [77].8 Summary and conclusionsFemtosecond <strong>laser</strong> pulses enable the creation <strong>of</strong>spatially extremely confined chemical, thermal, and mechanicaleffects in biological media and other transparent materialsvia free-electron generation through nonlinear absorption.Because <strong>of</strong> the nonlinear nature <strong>of</strong> plasma formation and thedeterministic relationship between free-electron density andirradiance, effect sizes well below the diffraction limit canbe achieved. Precision and versatility are better than with cwirradiation, for which the energy deposition relies on onephotonabsorption and vital stains are <strong>of</strong>ten required to createthe necessary absorption.Free electrons are produced in a fairly large irradiancerange below the optical breakdown threshold. This lowdensityplasma regime provides a ‘tuning range’ in whichthe nature <strong>of</strong> the <strong>laser</strong>-induced effects can be deliberatelychanged by gradually varying the irradiance. Chemical effectsinduced by the free electrons and direct multiphoton interactionsdominate at the lower end <strong>of</strong> this irradiance range,whereas at the upper end they are mixed with thermal effectsand modified by thermoelastic stresses. For a sufficiently
VOGEL et al. <strong>Mechanisms</strong> <strong>of</strong> <strong>femtosecond</strong> <strong>laser</strong> <strong>nanosurgery</strong> <strong>of</strong> cells and tissues 1043strong temperature rise, the thermoelastic tensile stress leadsto bubble formation, and the <strong>laser</strong>-induced effects becomemore disruptive. The threshold for bubble formation definesthe experimental breakdown criterion for aqueous media.In our investigations performed for a numerical <strong>aper</strong>ture <strong>of</strong>NA = 1.3, it corresponds to a temperature rise <strong>of</strong> 131.5 ◦ Cand an end temperature <strong>of</strong> 151.5 ◦ C, well below the superheatthreshold. It was reached with a free-electron density <strong>of</strong>ϱ c = 0.236 × 10 21 cm −3 , which is below the threshold criterion<strong>of</strong> ϱ cr = 10 21 cm −3 commonly used in the modeling <strong>of</strong>plasma formation.Although it is convenient to distinguish between chemical,thermal, and thermomechanical effects, a clear separation betweenthese regimes does not exist for <strong>femtosecond</strong> <strong>laser</strong> effects.Because free-electron generation precedes any thermalor thermomechanical effects, the latter are never independent<strong>of</strong> free-electron-induced chemistry or multiphoton-inducedphotochemical effects. Temperatures that would usually leadto thermal denaturation are associated with millions <strong>of</strong> freeelectrons in the focal volume that produce chemical changes.The stress confinement <strong>of</strong> the energy deposition in <strong>femtosecond</strong>-<strong>laser</strong>-inducedmaterial processing is responsible forthe generation <strong>of</strong> large compressive and tensile stress amplitudesat a moderate temperature rise. Therefore, a temperaturerise <strong>of</strong> as little as 131.5 ◦ C is sufficient for bubble generationin a liquid without any pre-existing nuclei. The lowvolumetric energy density required for thermoelastically inducedcavity formation (only about 1/5 <strong>of</strong> the vaporizationenthalpy) is a reason for the lack <strong>of</strong> thermal side effects in<strong>femtosecond</strong> <strong>laser</strong> dissection and the small conversion rate<strong>of</strong> <strong>laser</strong> energy into mechanical energy. Moreover, it explainswhy at the bubble-formation threshold the bubble size ismuch smaller than for ‘conventional’ phase transitions withoutstress confinement.Based on the analysis <strong>of</strong> the <strong>laser</strong>-induced chemical andphysical effects, we investigated the working mechanisms <strong>of</strong><strong>femtosecond</strong> <strong>laser</strong> nanoprocessing in biomaterials with oscillatorpulses <strong>of</strong> 80-MHz repetition rate and with amplifiedpulses <strong>of</strong> 1-kHz repetition rate and revealed that they belongto two different regimes. Dissection at 80-MHz repetitionrate is performed in the low-density plasma regime at subnanojouleenergies well below the optical breakdown thresholdand less than one order <strong>of</strong> magnitude higher than thoseused for nonlinear imaging. It is mediated by free-electroninducedchemical decomposition (bond breaking) in conjunctionwith multiphoton-induced chemistry, and hardly relatedto heating or thermoelastic stresses. Dissection with 1-kHzrepetition rate is performed using about 10-fold larger pulseenergies (a few nanojoules) and relies on thermoelasticallyinduced formation <strong>of</strong> minute transient cavities that is probablyfacilitated by the free-electron-induced decomposition <strong>of</strong>biomolecules and by direct photochemistry.Unwanted side effects in <strong>femtosecond</strong> <strong>laser</strong> surgery areusually related to the formation <strong>of</strong> long-lasting bubbles in thehigh-repetition-rate mode that are produced by accumulativeheating and tissue dissociation into volatile fragments, andto excessively large transient bubbles in the low-repetitionratemode. Future experiments must explore the specific hazards<strong>of</strong> each side effect and define the respective ‘therapeuticrange’ for each surgical modality.The use <strong>of</strong> oscillator pulse trains is technically simpler and<strong>of</strong>fers the possibility <strong>of</strong> combining nonlinear material modificationwith nonlinear imaging. Amplified pulses allow us notonly to perform <strong>nanosurgery</strong> but are also suited for tasks requiringlarger cutting rates and pulse energies, such as the precisedissection <strong>of</strong> individual cells from histological specimensand their subsequent separation by <strong>laser</strong> catapulting, or thenon-destructive isolation <strong>of</strong> single cultured cells [225–227].They are probably also more suitable for high-throughput celltransfection.Short wavelengths seem to be especially well suited forthe manipulation <strong>of</strong> cellular events because the dependence<strong>of</strong> the free-electron density on irradiance is weak and thetuning range between chemical, thermal, and mechanical effectsis thus broader than for longer wavelengths. Short wavelengthsin the visible or UVA portion <strong>of</strong> the optical spectrumprovide, furthermore, better spatial resolution than infraredwavelengths. However, if simultaneous nonlinear materialmodification and nonlinear imaging is desired, one needs touse IR wavelengths because they have a larger optical penetrationdepth and enable us to produce multiphoton-inducedfluorescence, second-harmonic generation, or third-harmonicgeneration within a well-detectable wavelength range. Thelargest safety margin for nonlinear imaging without deleteriousside effects for the specimen exists when the differencein the order <strong>of</strong> the multiphoton effects used for imaging andionization is as large as possible, which is the case for IRwavelengths > 1000 nm.The principal mechanisms <strong>of</strong> <strong>femtosecond</strong> <strong>laser</strong> interactionwith biomaterials described above are not only relevantfor <strong>nanosurgery</strong> with tightly focused <strong>laser</strong> pulses butalso for applications such as intrastromal corneal refractivesurgery [11–14] or presbyopia treatment [228], where the<strong>laser</strong> pulses are focused at smaller numerical <strong>aper</strong>tures. In thelatter cases, nonlinear beam propagation must be taken intoaccount, and one needs to bear in mind that the thermoelastictensile stress amplitude produced by energy deposition intocylindrical volumes differs from those arising from sphericalor ellipsoidal volumes [155]. Similar considerations also applyfor the analysis <strong>of</strong> intraocular lesions from ultra-short <strong>laser</strong>pulses in the context <strong>of</strong> <strong>laser</strong> safety [183, 229, 230].Besides nanoprocessing <strong>of</strong> biological materials, lowdensityplasmas can also be used to modify other transparentmaterials and enable, for example, the generation <strong>of</strong> opticalwaveguides, couplers, or even <strong>laser</strong>s in bulk glass and fusedsilica [5–8]. The process <strong>of</strong> plasma formation in the bulk <strong>of</strong>other dielectrics like fused silica and glass strongly resemblesthe process in water [5, 116, 123, 231]. Variations aremainly due to differences in the band-gap energy, which is6.5eVfor water but ≈ 4eVfor barium aluminum borosilicate(BBS) and 9.0eVfor fused silica [123, 232]. The material responseto plasma formation will, <strong>of</strong> course, be modified bythe different threshold values for chemically and thermomechanicallyinduced changes. However, the methods employedin this p<strong>aper</strong> for the analysis <strong>of</strong> <strong>femtosecond</strong> <strong>laser</strong> effects inwater can also be used to study the effects created in soliddielectrics. When pulse series with high repetition rate areused, low-density plasmas may lead to the formation <strong>of</strong> defectsor color centers that are associated with a change <strong>of</strong>the refractive index [233, 234]. Thermal effects produced
1044 Applied Physics B – Lasers and Opticsthrough heat accumulation during application <strong>of</strong> series <strong>of</strong><strong>femtosecond</strong> pulses may also play a role [231, 235], butcannot be separated from and are probably dominated bythe chemical effects <strong>of</strong> the free electrons. Thermal effects,and especially the resulting thermoelastic stresses, will playa prominent role for low repetition rates and larger pulse energies[236–238], where they can even lead to the formation <strong>of</strong>voids [179, 235, 239]. Void formation in solid dielectrics requiresa larger plasma energy density than bubble formationin aqueous media but, due to the strongly nonlinear energy deposition,only a slight increase in irradiance. This explains thesimilarity <strong>of</strong> the optical breakdown thresholds for both groups<strong>of</strong> materials.We conclude that with the advent <strong>of</strong> compact and reliable<strong>femtosecond</strong> <strong>laser</strong> technology, nanoprocessing <strong>of</strong> biologicalcells and tissues has gained new exciting perspectives.A deeper understanding <strong>of</strong> the working mechanisms will helpto further optimize this technique, to open new avenues formicro- and nanomanipulation, and to find new applicationsfor functional studies on cells and small organisms.An important challenge for future research is the timeresolvedinvestigation <strong>of</strong> the <strong>laser</strong>-induced events, especiallyfor those cases where bubble formation is involved in dissection,and the assessment <strong>of</strong> the consequences <strong>of</strong> the bubbles’oscillations for the integrity, metabolism, and viability<strong>of</strong> the affected cells. To achieve optimum precision and predictability<strong>of</strong> effects produced at 1kHzand allow for on-linedosimetry, techniques for real-time feedback on the formation<strong>of</strong> transient bubbles with lifetimes <strong>of</strong> 1 µs or smaller mustbe established. A measurement <strong>of</strong> the bubble oscillation amplitudewill also allow us to determine their size and thus toassess the potential damage range <strong>of</strong> the <strong>laser</strong> effects. Forsurgery using oscillator pulses at MHz repetition rates, bubbleoscillations are probably not relevant. Here, bubble growth isa much slower process driven by the cumulative production <strong>of</strong>non-condensable gas and can more easily be monitored.A significant shortcoming <strong>of</strong> all present models <strong>of</strong> opticalbreakdown in biomaterials is the lack <strong>of</strong> consideration <strong>of</strong> thespecific absorption properties <strong>of</strong> the biomolecules or stainscontained in the aqueous medium. Future models should considerthe role <strong>of</strong> heating by linear absorption and the modification<strong>of</strong> multiphoton processes by intermediate energy levelslocated within the band gap for water. These levels could allowfor multiphoton processes <strong>of</strong> lower order, leading to freeelectrongeneration and bond breaking in the biomolecule atlower irradiances than those required for optical breakdown <strong>of</strong>water.ACKNOWLEDGEMENTS This work was sponsored by theUS Air Force Office <strong>of</strong> Scientific Research through its European Office<strong>of</strong> Aerospace Research and Development under Grant No. FA8655-02-1-3047, and, in parts, by the German Bundesministerium für Bildung undForschung under Grant No. 13N8461. We appreciate stimulating discussionson the modeling <strong>of</strong> plasma formation with Paul Kennedy (US AirForce Optical Research Laboratory, Brooks City Base, San Antonio, USA),Nadezhda Bulgakova (Institute <strong>of</strong> Thermophysics, SB RAS, Novosibirsk,Russia), Rieko Verhagen (Philips Research, Eindhoven, The Netherlands),Cord Arnold (Laserzentrum Hannover, Germany), and Norbert Linz (Institute<strong>of</strong> Biomedical Optics, University <strong>of</strong> Lübeck, Germany). We thank S.B.Kiselev (Colorado School <strong>of</strong> Mines, Golden, USA) for providing tabulateddata <strong>of</strong> the kinetic spinodal [163] used for calculating the bubble-formationthresholds.REFERENCES1 Y.R. Shen, The Principles <strong>of</strong> Nonlinear Optics (Wiley, New York 1984)2 A. Vogel, V. Venugopalan, Chem. Rev. 103, 577 (2003)3 V. Venugopalan, A. Guerra, K. Nahen, A. Vogel, Phys. Rev. Lett. 88,078 103 (2002)4 K. König, I. Riemann, P. Fischer, K. Halbhuber, Cell. Mol. Biol. 45,195 (1999)5 C.B. Schaffer, A. Brodeur, J.F. García, E. Mazur, Opt. Lett. 26, 93(2001)6 K. Minoshima, A.M. Kowalevicz, I. Hartl, E. Ippen, J.G. Fujimoto,Opt. Lett. 26, 1516 (2001)7 W. Watanabe, T. Asano, K. Yamada, K. Itoh, J. Nishii, Opt. Lett. 28,2491 (2003)8 S. Taccheo, G. Della Valle, R. Osellame, G. Cerullo, N. Chiodo, P. Laporta,O. Svelto, A. Killi, U. Morgner, M. Lederer, D. Kopf, Opt. Lett.29, 2626 (2004)9 R.F. Steinert, C.A. Puliafito, The Nd:YAG Laser in Ophthalmology(Saunders, Philadelphia 1986)10 A. Vogel, W. Hentschel, J. Holzfuss, W. Lauterborn, Ophthalmology93, 1259 (1986)11 I. Ratkay-Traub, I.E. Ferincz, T. Juhasz, R.M. Kurtz, R.R. Krueger,J. Refract. Surg. 19, 94 (2003)12 A. Heisterkamp, T. Mamom, O. Kermani, W. Drommer, H. Welling,W. Ertmer, H. Lubatschowski, Graef. Arch. Clin. Exp. 241, 511 (2003)13 T. Juhasz, F.H. Loesel, R.M. Kurtz, C. Horvath, J.F. Bille, G. Mourou,IEEE J. Sel. Top. Quantum Electron. 5, 902 (1999)14 M. Han, L. Zickler, G. Giese, M. Walter, F.H. Loesel, J.F. Bille,J. Biomed. Opt. 9, 760 (2004)15 A. Vogel, K. Nahen, D. Theisen, IEEE J. Sel. Top. Quantum Electron.2, 847 (1996)16 A. Heisterkamp, T. Ripken, H. Lubatschowski, T. Mamom, W. Drommer,H. Welling, W. Ertmer, Appl. Phys. B 74, 419 (2002)17 W. Liu, O. Kosareva, I.S. Golubtsov, A. Iwasaki, A. Becker, V.P. Kandidov,S.L. Chin, Appl. Phys. B 76, 215 (2003)18 S.S. Mao, F. Quéré, S. Guizard, X. Mao, R.E. Russo, G. Petite,P. Martin, Appl. Phys. A 79, 1695 (2004)19 J. Kasparian, J. Solle, M. Richard, J.-P. Wolf, Appl. Phys. B 79, 947(2004)20 M. Kolesik, E.M. Wright, J.V. Moloney, Phys. Rev. Lett. 92, 253 901(2004)21 C.L. Arnold, A. Heisterkamp, W. Ertmer, H. Lubatschowski, Appl.Phys. B 80, 247 (2005)22 U. Fuchs, U.D. Zeitner, A. Tünnermann, Opt. Express 13, 3852 (2005)23 R.K. Saiki, D.H. Gelfand, S. St<strong>of</strong>fel, S.J. Scharf, R. Higuchi, G.T. Horn,K.B. Mullis, H.A. Erlich, Science 239, 487 (1988)24 A.F. Markham, Brit. Med. J. 306, 441 (1993)25 S.A. Bustin, J. Mol. Endocrinol. 25, 169 (2000)26 G. Isenberg, W. Bielser, W. Meier-Ruge, E. Remy, J. Microsc. 107, 19(1976)27 W. Meier-Ruge, W. Bielser, E. Remy, F. Hillenkamp, R. Nitsche,R. Unsöld, Histochem. J. 8, 387 (1976)28 K. Schütze, H. Pösl, G. Lahr, Cell. Mol. Biol. 44, 735 (1998)29 K. Schütze, G. Lahr, Nat. Biotechnol. 16, 737 (1998)30 G. Lahr, Lab. Invest. 80, 1477 (2000)31 K. Lorenz, Mechanismen des Katapultierens biologischer Strukturenmit UV-Laserpulsen, Diploma Thesis, University <strong>of</strong> Applied ScienceLübeck (2004) [in German]. Accessible through vogel@bmo.uniluebeck.de32 C.E.Sims,G.D.Meredith,T.B.Krasieva,M.W.Berns,B.J.Tromberg,N.L. Allbritton, Anal. Chem. 700, 4570 (1998)33 K.R. Rau, A. Guerra, A. Vogel, V. Venugopalan, Appl. Phys. Lett. 84,2940 (2004)34 M.W. Berns, J. Aist, J. Edwards, K. Strahs, J. Girton, P. McNeil,J.B. Kitzes, M. Hammer-Wilson, L.-H. Liaw, A. Siemens, M. Koonce,S. Peterson, S. Brenner, J. Burt, R. Walter, P.J. Bryant, D. van Dyk,J. Coulombe, T. Cahill, G.S. Berns, Science 213, 505 (1981)35 H. Liang, W.H. Wright, S. Cheng, W. He, M.W. Berns, Exp. Cell Res.204, 110 (1993)36 K.O. Greulich, Micromanipulation by Light in Biology and Medicine(Birkhäuser, Basel Boston Berlin 1999)37 K. König, I. Riemann, W. Fritsche, Opt. Lett. 26, 819 (2001)38 S. Sato, E. Higurashi, Y. Taguchi, H. Inaba, Appl. Phys. B 54, 531(1992)39 K. Schütze, A. Clement-Sengewald, Nature 368, 667 (1994)
VOGEL et al. <strong>Mechanisms</strong> <strong>of</strong> <strong>femtosecond</strong> <strong>laser</strong> <strong>nanosurgery</strong> <strong>of</strong> cells and tissues 104540 J. Neev, Y. Tadir, P. Ho, M.W. Berns, R.H. Asch, T. Ord, J. Assist.Reprod. Genet. 9, 513 (1992)41 S. Antinori, C. Panci, H.A. Selman, B. Caffa, G. Dani, C. Versaci, Hum.Reprod. 11, 590 (1996)42 K. Rink, G. Delacretaz, R. Salathé, A. Senn, D. Noccera, M. Germond,P. De Grandi, S. Fakan, Laser. Surg. Med. 18, 52 (1996)43 E. Mantoudis, B.T. Podsiadly, A. Gorgry, G. Venkat, I.L. Craft, Hum.Reprod. 16, 2182 (2001)44 M. Tsukakoshi, S. Kurata, Y. Nomiya, Y. Ikawa, T. Kasuya, Appl. Phys.B 35, 135 (1984)45 S.-I. Kurata, M. Tsukakoshi, T. Kasuya, Y. Ikawa, Exp. Cell Res. 162,372 (1986)46 W. Tao, J. Wilkinson, E. Stanbridge, M.W. Berns, Proc. Natl. Acad. Sci.USA 84, 4180 (1987)47 G. Palumbo, M. Caruso, E. Crescenzi, M.F. Tecce, G. Roberti, A. Colasanti,J. Photochem. Photobiol. B 36, 41 (1996)48 T.B. Krasieva, C.F. Chapman, V.J. LaMorte, V. Venugopalan,M.W. Berns, B.J. Tromberg, Proc. SPIE 3260, 38 (1998)49 C.S. Buer, K.T. Gahagan, G.S. Swartzlander Jr., P.J. Weathers, Biotechnol.Bioeng. 60, 348 (1998)50 J.S. Soughayer, T. Krasieva, S.C. Jacobson, J.M. Ramsey,B.C. Tromberg, N.L. Albritton, Anal. Chem. 72, 1342 (2000)51 Y. Shirahata, N. Ohkohchi, H. Itagak, S. Satomi, J. Invest. Med. 49, 184(2001)52 H. Schneckenburger, A. Hendiger, R. Sailer, W.S.L. Strauss,M. Schmitt, J. Biomed. Opt. 7, 410 (2002)53 U.K. Tirlapur, K. König, Nature 418, 290 (2002)54 S.K. Mohanty, M. Sharma, P. Gupta, Biotechnol. Lett. 25, 895 (2003)55 E. Zeira, A. Manevitch, A. Khatchatouriants, O. Pappo, E. Hyam,M. Darash-Yahana, E. Tavor, A. Honigman, A. Lewis, E. Galun, Mol.Ther. 8, 342 (2003)56 L. Paterson, B. Agate, M. Comrie, R. Ferguson, T.K. Lake, J.E. Morris,A.E. Carruthers, C.T.A. Brown, W. Sibbett, P.E. Bryant, F. Gunn-Moore, A.C. Riches, K. Dholakia, Opt. Express 13, 595 (2005)57 G. Huettmann, R. Birngruber, IEEE J. Sel. Top. Quantum Electron. 5,954 (1999)58 D.G. Jay, T. Sakurai, Biochim. Biophys. Acta 1424(2–3), M39–M48(1999)59 G. Hüttmann, J. Serbin, B. Radt, B. Lange, R. Birngruber, Proc. SPIE4257, 398 (2001)60 S. Beck, T. Sakurai, B. Eustace, G. Beste, R. Schier, F. Rudert,D.G. Jay, Proteomics 2, 247 (2002)61 C.M. Pitsillides, E.K. Joe, X. Wei, R.R. Anderson, C.P. Lin, Biophys. J.84, 4023 (2003)62 C.P. Yao, R. Rahmanzadeh, E. Endl, Z. Zhang, J. Gerdes, G. Hüttmann,J. Biomed. Opt. 10 (2005) in press63 S. Tschachotin, Biol. Zentralbl. 32, 623 (1912)64 M. Bessis, G. Nomarski, J. Biophys. Biochem. Cy. 8, 777 (1960)65 G. Moreno, M. Lutz, M. Bessis, Int. Rev. Exp. Pathol. 7, 99 (1969)66 M. Bessis, F. Gires, G. Mayer, G. Nomarski, C. R. Acad. Sci. III – Vie255, 1010 (1962)67 R.L. Amy, R. Storb, Science 150, 756 (1965)68 R. Storb, R.L. Amy, R.K. Wertz, B. Fauconnier, M. Bessis, J. Cell Biol.31, 11 (1966)69 M.W. Berns, R.S. Olson, D.E. Rounds, Nature 221, 74 (1969)70 M.W. Berns, W.K. Cheng, A.D. Floyd, Y. Ohnuki, Science 171, 903(1971)71 O.G. Stonington, T.P. Spurck, J.A. Snyder, J.D. Picket-Heaps, Protoplasma153, 62 (1989)72 M. Bessis, Adv. Biol. Med. Phys. 13, 209 (1971)73 P.P. Calmettes, M.W. Berns, Proc. Natl. Acad. Sci. USA 80, 7197(1983)74 A. Khodjakov, R.W. Cole, C.L. Rieder, Curr. Biol. 10, 59 (2000)75 J. Colombelli, S.W. Grill, E.H.K. Stelzer, Rev. Sci. Instrum. 75, 472(2004)76 E.L. Botvinick, V. Venugopalan, J.V. Shah, L.H. Liaw, M. Berns, Biophys.J. 87, 4203 (2004)77 L. Sacconi, I.M. Tolic-Norrelyke, R. Antolini, F.S. Pavone, J. Biomed.Opt. 10, 014 002 (2005)78 J.R. Aist, H. Liang, M.W. Berns, J. Cell Sci. 104, 1207 (1993)79 M.F. Yanik, H. Cinar, H.N. Cinar, A.D. Chisholm, Y. Jin, A. Ben-Yakar,Nature 432, 822 (2004)80 A. Vogel, J. Noack, K. Nahen, D. Theisen, S. Busch, U. Parlitz,D.X. Hammer, G.D. Nojin, B.A. Rockwell, R. Birngruber, Appl. Phys.B 68, 271 (1999)81 J. Noack, A. Vogel, IEEE J. Quantum Electron. 35, 1156 (1999)82 R.A. Meldrum, S.W. Botchway, C.W. Wharton, G.J. Hirst, EMBO Rep.12, 1144 (2003)83 W. Watanabe, N. Arakawa, S. Matsunaga, T. Higashi, K. Fukui,K. Isobe, K. Itoh, Opt. Express 12, 4203 (2004)84 A. Heisterkamp, I.Z. Maxwell, E. Mazur, J.M. Underwood, J.A. Nickerson,S. Kumar, D.E. Ingber, Opt. Express 13, 3690 (2005)85 N. Shen, D. Datta, C.B. Schaffer, P. LeDuc, D.E. Ingber, E. Mazur,Mech. Chem. Biosyst. 2, 17 (2005)86 W. Supatto, D. Dèbarre, B. Moulia, E. Brouzés, J.-L. Martin, E. Farge,E. Beaurepaire, Proc. Natl. Acad. Sci. USA 102, 1047 (2005)87 S.H. Chung, D.A. Clark, C.V. Gabel, E. Mazur, A.D.T. Samuel, J. Neurosci.25 (2005) in press88 K. König, O. Krauss, I. Riemann, Opt. Express 10, 171 (2002)89 I. Riemann, T. Anhut, F. Stracke, R. Le Harzic, K. König, Proc. SPIE5695, 216 (2005)90 A.A. Oraevsky, L.B. Da Silva, A.M. Rubenchik, M.D. Feit, M.E. Glinsky,M.D. Perry, B.M. Mammini, W. Small IV, B. Stuart, IEEE J. Sel.Top. Quantum Electron. 2, 801 (1996)91 A. Vogel, J. Noack, Proc. SPIE 4260, 83 (2001)92 A. Khodjakov, R.W. Cole, B.R. Oakley, C.L. Rieder, Cell Motil. Cytoskel.38, 311 (1997)93 S.W. Grill, J. Howard, E. Schäffer, E.H.K. Stelzer, A.A. Hyman, Science301, 518 (2003)94 J. Colombelli, E.G. Reynaud, J. Rietdorf, R. Pepperkork,E.H.K. Stelzer, Traffic 6, 1093 (2005)95 N.I. Smith, K. Fujita, T. Kaneko, K. Katoh, O. Nakamura, S. Kawata,T. Takamatsu, Appl. Phys. Lett. 79, 1208 (2001)96 A. Vogel, S. Busch, U. Parlitz, J. Acoust. Soc. Am. 100, 148 (1996)97 A. Vogel, J. Noack, G. Hüttmann, G. Paltauf, Proc. SPIE 4633, 23 (2002)98 H. Oehring, I. Riemann, P. Fischer, K.J. Halbhuber, K. König, Scanning22, 263 (2000)99 F. Docchio, C.A. Sachhi, J. Marshall, Lasers Ophthalmol. 1, 83 (1986)100 C.A. Sacchi, J. Opt. Soc. Am. B 8, 337 (1991)101 F. Williams, S.P. Varama, S. Hillenius, J. Chem. Phys. 64, 1549 (1976)102 D. Grand, A. Bernas, E. Amouyal, Chem. Phys. 44, 73 (1979)103 D.N. Nikogosyan, A.A. Oraevsky, V. Rupasov, Chem. Phys. 77, 131(1983)104 L.V. Keldysh, Sov. Phys. JETP 20, 1307 (1965)105 M.V. Ammosov, N.B. Delone, V.P. Krainov, Sov. Phys. JETP 64, 1191(1986)106 J.F. Ready, Effects <strong>of</strong> High Power Laser Radiation (Academic, Orlando1971), p. 261107 K.K. Thornber, J. Appl. Phys. 52, 279 (1981)108 D. Arnold, E. Cartier, Phys. Rev. B 46, 15 102 (1992)109 B.K. Ridley, Quantum Processes in Semiconductors (Oxford UniversityPress, Oxford 1999)110 P.K. Kennedy, IEEE J. Quantum Electron. 31, 2241 (1995)111 Q. Feng, J.V. Moloney, A.C. Newell, E.M. Wright, K. Cook,P.K. Kennedy, D.X. Hammer, B.A. Rockwell, C.R. Thompson, IEEEJ. Quantum Electron. 33, 127 (1997)112 A.C. Tien, S. Backus, H. Kapteyn, M. Murnane, G. Mourou, Phys. Rev.Lett. 82, 3883 (1999)113 A. Kaiser, B. Rethfeld, M. Vicanek, G. Simon, Phys. Rev. B 61, 11 437(2000)114 L.V. Keldysh, Sov. Phys. JETP 11, 509 (1960)115 B. Rethfeld, Phys. Rev. Lett. 92, 187 401 (2004)116 B.C. Stuart, M.D. Feit, S. Hermann, A.M. Rubenchik, B.W. Shore,M.D.Perry,Phys.Rev.B53, 1749 (1996)117 N. Bloembergen, IEEE J. Quantum Electron. 10, 375 (1974)118 Q. Sun, H. Jiang, Y. Liu, Z. Wu, H. Yang, Q. Gong, Opt. Lett. 30, 320(2005)119 A.P. Joglekar, H. Liu, G.J. Spooner, E. Meyhöfer, G. Mourou,A.L. Hunt, Appl. Phys. B 77, 25 (2003)120 A.P. Joglekar, H. Liu, E. Meyhöfer, G. Mourou, A.L. Hunt, Proc. Nat.Acad. Sci. 101, 5856 (2004)121 M.D. Feit, A.M. Komashko, A.M. Rubenchik, Appl. Phys. A 79, 1657(2004)122 D.X. Hammer, R.J. Thomas, G.D. Noojin, B.A. Rockwell,P.A. Kennedy, W.P. Roach, IEEE J. Quantum Electron. 3, 670 (1996)123 M. Lenzner, J. Krüger, S. Sartania, Z. Cheng, C. Spielmann,G. Mourou, W. Kautek, F. Krausz, Phys. Rev. Lett. 80, 4076 (1998)124 H.S. Carslaw, J.C. Jaeger, Conduction <strong>of</strong> Heat in Solids, 2nd edn. (OxfordUniversity Press, Oxford 1959)125 F. Docchio, Europhys. Lett. 6, 407 (1988)
1046 Applied Physics B – Lasers and Optics126 K. Nahen, A. Vogel, IEEE J. Sel. Top. Quantum Electron. 2, 861(1996)127 J. Noack, Optischer Durchbruch in Wasser mit Laserpulsen zwischen100 ns und 100 fs, Ph.D. Dissertation, University <strong>of</strong> Lübeck (1998)128 J. Noack, D.X. Hammer, G.D. Noojin, B.A. Rockwell, A. Vogel,J. Appl. Phys. 83, 7488 (1998)129 D. Du, X. Liu, G. Mourou, Appl. Phys. B 63, 617 (1996)130 D. Du, J. Squier, R. Kurtz, V. Elner, X. Liu, G. Güttmann, G. Mourou,in Ultrafast Phenomena IX, ed. by P.F. Barbara, W.H. Knox,G.A. Mourou, A.H. Zewail (Springer, New York 1994), p. 254131 D. Stern, R.W. Schoenlein, C.A. Puliafito, E.T. Dobi, R. Birngruber,J.G. Fujimoto, Arch. Ophthalmol. – Chic. 107, 587 (1989)132 M.H. Niemz, T.P. Hoppeler, T. Juhasz, F.J. Bille, Lasers Light Ophthalmol.5, 149 (1993)133 T.P. Hughes, Plasmas and Laser Light (Adam Hilger, Bristol 1975)134 R.P. Godwin, C.G.M. van Kessel, J.N. Olsen, P. Sachsenmaier, R. Sigel,Z. Naturforsch. 32a, 1100 (1977)135 D. von der Linde, H. Schüler, J. Opt. Soc. Am. B 13, 216 (1996)136 D.X. Hammer, E.D. Jansen, M. Frenz, G.D. Noojin, R.J. Thomas,J. Noack, A. Vogel, B.A. Rockwell, A.J. Welch, Appl. Opt. 36, 5630(1997)137 C.H. Fan, J. Sun, J.P. Longtin, J. Appl. Phys. 91, 2530 (2002)138 C.H. Fan, J. Sun, J.P. Longtin, J. Heat Trans. – T. ASME 124, 275(2002)139 D.M. Rayner, A. Naumov, P.B. Corkum, Opt. Express 13, 3208 (2005)140 M. Born, E. Wolf, Principles <strong>of</strong> Optics (Pergamon Press, Oxford 1970)141 H. Ditlbacher, J.R. Krenn, A. Leitner, F.R. Aussenegg, Opt. Lett. 29,1408 (2004)142 S. Grill, E.H.K. Stelzer, J. Opt. Soc. Am. A 16, 2658 (1999)143 B.C. Garret, D.A. Dixon, D.M. Camaioni, D.M. Chipman,M.A. Johnson, C.D. Jonah, G.A. Kimmel, J.H. Miller, T.N. Rescigno,P.J. Rossky, S.S. Xantheas, S.D. Colson, A.H. Laufer, D. Ray,P.F. Barbara, D.M. Bartels, K.H. Becker, K.H. Bowen, S.E. Bradforth,I. Carmichael, J.V. Coe, L.R. Corrales, J.P. Cowin, M. Dupuis,K.B. Eisenthal, J.A. Franz, M.S. Gutowski, K.D. Jordan, B.D. Kay,J.A. LaVerne, S.V. Lymar, T.E. Madey, C.W. McCurdy, D. Meisel,S. Mukamel, A.R. Nilsson, T.M. Orlando, N.G. Petrik, S.M. Pimblott,J.R. Rustad, G.K. Schenter, S.J. Singer, A. Tokmak<strong>of</strong>f, L.S. Wang,C. Wittig, T.S. Zwier, Chem. Rev. 105, 355 (2005)144 U.K. Tirlapur, K. König, C. Peuckert, R. Krieg, K.-J. Halbhuber, Exp.Cell Res. 263, 88 (2001)145 B. Boudaiffa, P. Cloutier, D. Hunting, M.A. Huels, L. Sanche, Science287, 1658 (2000)146 H. Hotop, in L.G. Christophorou, J.K. Olth<strong>of</strong>f (eds.), Proceedings <strong>of</strong> theInternational Symposium on Gaseous Dielectrics IX, Ellicott City, MD,USA, 22–25 May 2001 (Kluwer Academic/Plenum, New York, 2001),p. 3147 S. Gohlke, E. Illenberger, Europhys. News 33, 207 (2002)148 M.A. Huels, B. Boudaiffa, P. Cloutier, D. Hunting, L. Sanche, J. Am.Chem. Soc. 125, 4467 (2003)149 T. Mitchinson, M. Kirschner, Nature 312, 237 (1984)150 I.M. Jánosi, D. Chrétien, H. Flyvberg, Biophys. J. 83, 1317 (2002)151 H.O. Jeschke, E.M. Garcia, in Nonlinear Optics, Quantum Optics andUltrafast Phenomena with X-rays, ed. by B.W. Adams (Kluwer Academic,Boston Dordrecht London 2003), p. 175152 N.M. Bulgakova, R. Stoian, A. Rosenfeld, I.V. Hertel, E.E.B. Campbell,Phys. Rev. B 69, 054 102 (2004)153 S. Nolte, C. Momma, H. Jacobs, A. Tünnermann, B.N. Chikov,B. Wellegehausen, H. Welling, J. Opt. Soc. Am. B 14, 2716 (1997)154 H. Kuchling, Taschenbuch der Physik, 13th edn. (FachbuchverlagLeipzig 1991)155 G. Paltauf, H. Schmidt-Kloiber, Appl. Phys. A 68, 525 (1999)156 G. Paltauf, P. Dyer, Chem. Rev. 103, 487 (2003)157 M.W. Sigrist, F.K. Kneubühl, J. Acoust. Soc. Am. 64, 1652 (1978)158 G. Paltauf, H. Schmidt-Kloiber, Appl. Phys. A 62, 303 (1996)159 V.P. Skripov, E.N. Sinitsin, P.A. Pavlov, G.V. Ermakov, G.N. Muratov,N.V. Bulanov, V.G. Baidakov, Thermophysical Properties <strong>of</strong> Liquidsin the Metastable (Superheated) State (Gordon and Breach, New York1988)160 K.P. Köstli, M. Frenz, H. Bebie, H.P. Weber, Phys. Med. Biol. 46, 1863(2001)161 B.T. Cox, P.C. Beard, J. Acoust. Soc. Am. 117, 3616 (2005)162 C.E. Brennen, Cavitation and Bubble Dynamics (Oxford UniversityPress, New York Oxford 1995)163 S.B. Kiselev, Physica A 269, 252 (1999)164 S.B. Kiselev, J.F. Ely, Physica A 299, 357 (2001)165 P.G. Debenedetti, Metastable Liquids: Concepts and Principles(Princeton University Press, Princeton 1996)166 J.C. Fisher, J. Appl. Phys. 19, 1062 (1948)167 Q. Zheng, D.J. Durben, G.H. Wolf, C.A. Angell, Science 254, 829(1991)168 B. Garrison, T.E. Itina, L.V. Zhigilei, Phys. Rev. E 68, 041 501 (2003)169 F.R. Gilmore, Calif. Inst. Tech. Rep. 26 (1952)170 R.T. Knapp, J.W. Daily, F.G. Hammitt, Cavitation (McGraw-Hill, NewYork 1971), pp. 117–131171 J. Staudenraus, W. Eisenmenger, Ultrasonics 31, 267 (1993)172 G. Paltauf, H. Schmidt-Kloiber, J. Appl. Phys. 82, 1525 (1997)173 J. Noack, A. Vogel, Appl. Opt. 37, 4092 (1998)174 M.H. Rice, J.M. Walsh, J. Chem. Phys. 26, 824 (1957)175 P.A. Barnes, K.E. Rieckh<strong>of</strong>f, Appl. Phys. Lett. 13, 282 (1968)176 J. Stolarski, J. Hardman, C.G. Bramlette, G.D. Noojin, R.J. Thomas,B.A. Rockwell, W.P. Roach, Proc. SPIE 2391, 100 (1995)177 E.J. Chapyak, R.P. Godwin, A. Vogel, Proc. SPIE 2975, 335 (1997)178 B. Zysset, J.G. Fujimoto, T.F. Deutsch, Appl. Phys. B 48, 139 (1989)179 E.N. Glezer, E. Mazur, Appl. Phys. Lett. 71, 882 (1997)180 C.B. Schaffer, N. Nishimura, E. Mazur, SPIE Proc. 3451, 2 (1998)181 T. Juhasz, G.A. Kastis, C. Suarez, Z. Bor, W.E. Bron, Lasers Surg. Med.19, 23 (1996)182 C.B. Schaffer, N. Nishimura, E.N. Glezer, A.M.-T. Kim, E. Mazur, Opt.Express 10, 196 (2002)183 C.P. Cain, R.J. Thomas, G.D. Noojin, D.J. Stolarski, P.K. Kennedy,G.D. Buffington, B.A. Rockwell, Graef. Arch. Clin. Exp. Publishedonline (7 July 2004)184 A. Vogel, K. Nahen, D. Theisen, R. Birngruber, R.J. Thomas,B.A. Rockwell, Appl. Opt. 38, 3636 (1999)185 L.B. Glebov, O.M. Efimov, G.T. Petrovski, P.N. Rogovtsev, Sov.J. Quantum Electron. 15, 226 (1984)186 O.M. Efimov, J. Opt. Technol. 71, 338 (2004)187 M.J. Soileau, W.F. Williams, N. Mansour, E.W. Van Stryland, Opt. Eng.28, 1133 (1989)188 P.A. Dayton, J.E. Chomas, A.F.H. Lunn, J.S. Allen, J.R. Lindner,S.I. Simon, K.W. Ferrara, Biophys. J. 80, 1547 (2001)189 C.P. Lin, M.W. Kelly, S.A.B. Sibayan, M.A. Latina, R.R. Anderson,IEEE J. Sel. Top. Quantum Electron. 5, 963 (1999)190 D. Leszczynski, C.M. Pitsillides, R.K. Pastila, R.R. Anderson, C.P. Lin,Radiat. Res. 156, 399 (2001)191 Lord Rayleigh, Philos. Mag. 34, 94 (1917)192 J. Neumann, R. Brinkmann, Proc. SPIE 5863, 586 307 (2005)193 D. Needham, R.S. Nunn, Biophys. J. 58, 997 (1990)194 V. Kotaidis, A. Plech, Appl. Phys. Lett. 87, (2005) in press195 M. Lokhandwalla, B. Sturtevant, Phys. Med. Biol. 46, 413 (2001)196 D. Boal, Mechanics <strong>of</strong> the Cell (Cambridge University Press, Cambridge2002)197 B. Wolfrum, R. Mettin, T. Kurz, W. Lauterborn, Appl. Phys. Lett. 81,5060 (2002)198 M.J. Zohdy, C. Tse, J.Y. Ye, M. O’Donnell, IEEE T. Ultrason. Ferr. 52(2005) in press199 L.A. Crum, Ultrasonics 22, 215 (1984)200 T.G. Leighton, The Acoustic Bubble (Academic, London 1994)201 A. Vogel, Optical Breakdown in Water and Ocular Media, and Its Usefor Intraocular Photodisruption (Shaker Verlag, Aachen 2001)202 H.J. Koester, D. Baur, R. Uhl, S.W. Hell, Biophys. J. 77, 2226 (1999)203 A. Hopt, E. Neher, Biophys. J. 80, 2029 (2001)204 C. Eggeling, A. Volkmer, C.A.M. Seidel, Chem. Phys. Chem. 6, 791(2005)205 B.R. Masters, P.T.C. So, C. Buehler, N. Barry, J.D. Sutin, W.W. Mantulin,E. Gratton, J. Biomed. Opt. 9, 1265 (2004)206 J. Roegener, R. Brinkmann, C.P. Lin, J. Biomed. Opt. 9, 367 (2004)207 W. Watanabe, S. Matsungata, T. Shimada, T. Higashi, K. Fukui, K. Itoh,Med. Laser Appl. 20, 185 (2005)208 J. Neumann, R. Brinkmann, J. Biomed. Opt. 10, 024 001 (2005)209 K. König, H. Liang, M.W. Berns, B.J. Tromberg, Nature 377, 20 (1995)210 K. König, J. Microsc. 200, 83 (2000)211 K. König, in Methods in Cellular Imaging, ed. by A. Periasamy (OxfordUniversity Press, Oxford 2001), p. 236212 J. Pearce, S. Thomsen, in Optical–Thermal Response <strong>of</strong> Laser-Irradiated Tissue, ed. by A.J. Welch, M. van Germert (Plenum, NewYork 1995), p. 561213 D. Simanowski, M. Sarkar, A. Irani, C.O’Connel-Rodwell, C. Contag,A. Schwettman, D. Palanker, Proc. SPIE 5695, 254 (2005)
VOGEL et al. <strong>Mechanisms</strong> <strong>of</strong> <strong>femtosecond</strong> <strong>laser</strong> <strong>nanosurgery</strong> <strong>of</strong> cells and tissues 1047214 L. Descloux, S. Rastegar, G. Delacretaz, A. Hollis, K. Rink, Proc. SPIE3195, 137 (1998)215 W.J. Denk, J.H. Strickler, W.W. Webb, Science 248, 73 (1990)216 P.T.C. So, Opt. Express 3, 312 (1998)217 K. König, T.W. Becker, P. Fischer, I. Riemann, K.J. Halbhuber, Opt.Lett. 24, 113 (1999)218 Y. Guo, P.P. Ho, A. Tirksliunas, F. Liu, R.R. Alfano, Opt. Lett. 22, 1323(1997)219 L. Moreaux, O. Sandre, J. Mertz, J. Opt. Soc. Am. B 17, 1685 (2000)220 S.-W. Chu, T.M. Liu, C.-K. Sun, C.-Y. Lin, H.-J. Tsai, Opt. Express 11,933 (2003)221 L.Fu,X.Gan,M.Gu,Opt.Lett.30, 385 (2005)222 W.J. Denk, D.W. Piston, W.W. Webb, in Handbook <strong>of</strong> Biological ConfocalMicroscopy, ed. by J.B. Prawley (Plenum, New York 1995),p. 445223 A. Schönle, S. Hell, Opt. Lett. 23, 325 (1998)224 M.W. Berns, Z. Wang, A. Dunn, V. Wallace, V. Venugopalan, Proc.Natl. Acad. Sci. USA 97, 9504 (2000)225 Y. Hosokawa, H. Takabayashi, S. Miura, C. Shukunami, Y. Hiraki,H. Masuhara, Appl. Phys. A 79, 795 (2004)226 J.A. Barron, P. Wu, H.D. Ladouceur, B.R. Ringeisen, Biomed. Microdev.6, 139 (2004)227 B.R. Ringeisen, H. Kim, J.A. Barron, D.B. Krizman, D.B. Chrisey,S. Jackman, R.Y.C. Auyeung, B.J. Spargo, Tissue Eng. 10, 483(2004)228 T. Ripken, U. Oberheide, C. Ziltz, W. Ertmer, G. Gerten, H. Lubatschowski,Proc. SPIE 5688, 278 (2005)229 C.A. Toth, D.G. Narayan, G.D. Noojin, K.P. Winter, B.A. Rockwell,W.P. Roach, Invest. Ophth. Vis. Sci. 38, 2204 (1997)230 B.A. Rockwell, D.X. Hammer, R.A. Hopkins, D.J. Payne, C.A. Toth,W.P. Roach, J.J. Druessel, P.K. Kennedy, R.E. Amnotte, B. Eilert,S. Phillips, G.D. Noojin, D.J. Stolarski, C. Cain, J. Laser Appl. 11, 42(1999)231 C.B. Schaffer, J.F. García, E. Mazur, Appl. Phys. A 71, 351 (2003)232 M. Bass (ed. in chief), Handbook <strong>of</strong> Optics, vol. II (McGraw-Hill, NewYork 1995)233 O.M. Efimov, K. Gabel, S.V. Garnov, L.B. Glebov, S. Grantham,M. Richardson, M.J. Soileau, J. Opt. Soc. Am. B 15, 193 (1998)234 A. Hertwig, S. Martin, J. Krüger, W. Kautek, Appl. Phys. A 79, 1075(2004)235 W. Watanabe, T. Toma, K. Yamada, J. Nishii, K. Hayashi, K. Itoh, Opt.Lett. 25, 1669 (2000)236 A.M. Streltsov, N.F. Borelli, J. Opt. Soc. Am. B 19, 2496 (2002)237 B. Poumellec, L. Sudrie, M. Franco, B. Prade, A. Mysyrowicz, Opt.Express 9, 1070 (2003)238 V.R. Bhardwaj, P.B. Corkum, D.M. Rayner, C. Hnatowsky, E. Simova,R.S. Taylor, Opt. Lett. 29, 1312 (2004)239 S. Juodkazis, K. Yamasaki, V. Mizeikis, S. Matsuo, H. Misawa, Appl.Phys. A 79, 1549 (2004)240 A. Saul, W. Wagner, J. Phys. Chem. Ref. Data 18, 1537 (1989)