Vol 24, No 1, March 2011 - Enable
Vol 24, No 1, March 2011 - Enable
Vol 24, No 1, March 2011 - Enable

Create successful ePaper yourself
Turn your PDF publications into a flip-book with our unique Google optimized e-Paper software.
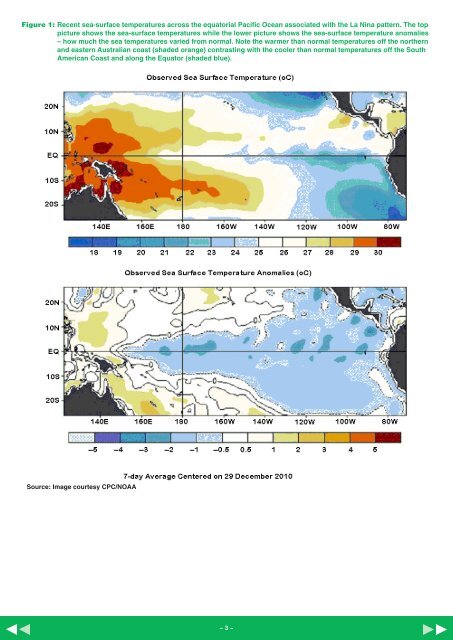
Figure 1: Recent sea-surface temperatures across the equatorial Pacific Ocean associated with the La Nina pattern. The toppicture shows the sea-surface temperatures while the lower picture shows the sea-surface temperature anomalies– how much the sea temperatures varied from normal. <strong>No</strong>te the warmer than normal temperatures off the northernand eastern Australian coast (shaded orange) contrasting with the cooler than normal temperatures off the SouthAmerican Coast and along the Equator (shaded blue).Source: Image courtesy CPC/NOAA~ 3 ~