Vol 24, No 1, March 2011 - Enable
Vol 24, No 1, March 2011 - Enable
Vol 24, No 1, March 2011 - Enable

Create successful ePaper yourself
Turn your PDF publications into a flip-book with our unique Google optimized e-Paper software.
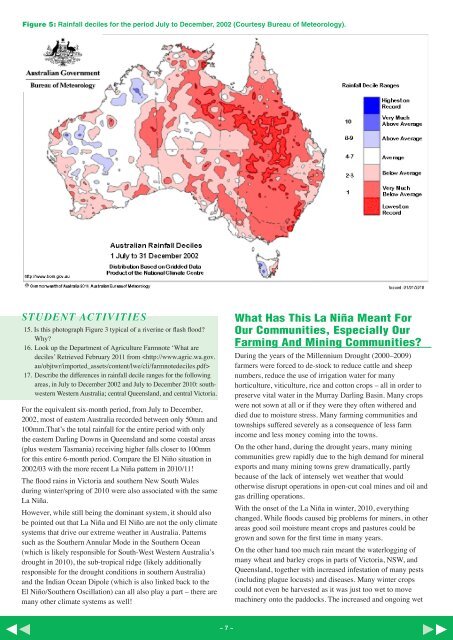
Figure 5: Rainfall deciles for the period July to December, 2002 (Courtesy Bureau of Meteorology).STUDENT ACTIVITIES15. Is this photograph Figure 3 typical of a riverine or flash flood?Why?16. Look up the Department of Agriculture Farmnote ‘What aredeciles’ Retrieved February <strong>2011</strong> from 17. Describe the differences in rainfall decile ranges for the followingareas, in July to December 2002 and July to December 2010: southwesternWestern Australia; central Queensland, and central Victoria.For the equivalent six-month period, from July to December,2002, most of eastern Australia recorded between only 50mm and100mm.That’s the total rainfall for the entire period with onlythe eastern Darling Downs in Queensland and some coastal areas(plus western Tasmania) receiving higher falls closer to 100mmfor this entire 6-month period. Compare the El Niño situation in2002/03 with the more recent La Niña pattern in 2010/11!The flood rains in Victoria and southern New South Walesduring winter/spring of 2010 were also associated with the sameLa Niña.However, while still being the dominant system, it should alsobe pointed out that La Niña and El Niño are not the only climatesystems that drive our extreme weather in Australia. Patternssuch as the Southern Annular Mode in the Southern Ocean(which is likely responsible for South-West Western Australia’sdrought in 2010), the sub-tropical ridge (likely additionallyresponsible for the drought conditions in southern Australia)and the Indian Ocean Dipole (which is also linked back to theEl Niño/Southern Oscillation) can all also play a part – there aremany other climate systems as well!What Has This La Niña Meant ForOur Communities, Especially OurFarming And Mining Communities?During the years of the Millennium Drought (2000–2009)farmers were forced to de-stock to reduce cattle and sheepnumbers, reduce the use of irrigation water for manyhorticulture, viticulture, rice and cotton crops – all in order topreserve vital water in the Murray Darling Basin. Many cropswere not sown at all or if they were they often withered anddied due to moisture stress. Many farming communities andtownships suffered severely as a consequence of less farmincome and less money coming into the towns.On the other hand, during the drought years, many miningcommunities grew rapidly due to the high demand for mineralexports and many mining towns grew dramatically, partlybecause of the lack of intensely wet weather that wouldotherwise disrupt operations in open-cut coal mines and oil andgas drilling operations.With the onset of the La Niña in winter, 2010, everythingchanged. While floods caused big problems for miners, in otherareas good soil moisture meant crops and pastures could begrown and sown for the first time in many years.On the other hand too much rain meant the waterlogging ofmany wheat and barley crops in parts of Victoria, NSW, andQueensland, together with increased infestation of many pests(including plague locusts) and diseases. Many winter cropscould not even be harvested as it was just too wet to movemachinery onto the paddocks. The increased and ongoing wet~ 7 ~