Key World Energy Statistics 2007 - Deres
Key World Energy Statistics 2007 - Deres
Key World Energy Statistics 2007 - Deres

Create successful ePaper yourself
Turn your PDF publications into a flip-book with our unique Google optimized e-Paper software.
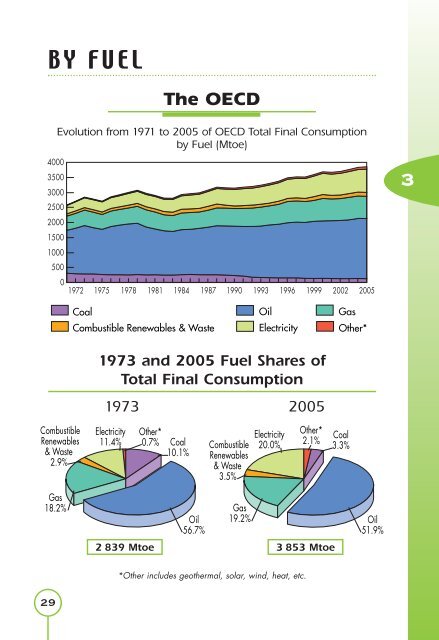
BY FUELThe OECD4000350030002500200015001000Evolution from 1971 to 2005 of OECD Total Final Consumptionby Fuel (Mtoe)50001972 1975 1978 1981 1984 1987 1990 1993 1996 1999 2002 20053CoalCombustible Renewables & WasteOilElectricityGasOther*1973 and 2005 Fuel Shares ofTotal Final Consumption1973 2005CombustibleRenewables& Waste2.9%Electricity11.4%Other*0.7%Coal10.1%CombustibleRenewables& Waste3.5%Electricity20.0%Other*2.1%Coal3.3%Gas18.2%Oil56.7%Gas19.2% Oil51.9%2 839 Mtoe 3 853 Mtoe*Other includes geothermal, solar, wind, heat, etc.29