Key World Energy Statistics 2007 - Deres
Key World Energy Statistics 2007 - Deres
Key World Energy Statistics 2007 - Deres

Create successful ePaper yourself
Turn your PDF publications into a flip-book with our unique Google optimized e-Paper software.
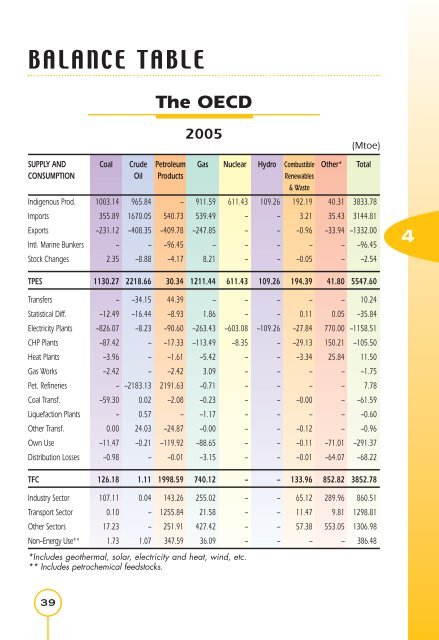
BALANCE TABLEThe OECD2005(Mtoe)SUPPLY AND Coal Crude Petroleum Gas Nuclear Hydro Combustible Other* TotalCONSUMPTION Oil Products Renewables& WasteIndigenous Prod. 1003.14 965.84 – 911.59 611.43 109.26 192.19 40.31 3833.78Imports 355.89 1670.05 540.73 539.49 – – 3.21 35.43 3144.81Exports –231.12 –408.35 –409.78 –247.85 – – –0.96 –33.94 –1332.00Intl. Marine Bunkers – – –96.45 – – – – – –96.45Stock Changes 2.35 –8.88 –4.17 8.21 – – –0.05 – –2.544TPES 1130.27 2218.66 30.34 1211.44 611.43 109.26 194.39 41.80 5547.60Transfers – –34.15 44.39 – – – – – 10.24Statistical Diff. –12.49 –16.44 –8.93 1.86 – – 0.11 0.05 –35.84Electricity Plants –826.07 –8.23 –90.60 –263.43 –603.08 –109.26 –27.84 770.00 –1158.51CHP Plants –87.42 – –17.33 –113.49 –8.35 – –29.13 150.21 –105.50Heat Plants –3.96 – –1.61 –5.42 – – –3.34 25.84 11.50Gas Works –2.42 – –2.42 3.09 – – – – –1.75Pet. Refineries – –2183.13 2191.63 –0.71 – – – – 7.78Coal Transf. –59.30 0.02 –2.08 –0.23 – – –0.00 – –61.59Liquefaction Plants – 0.57 – –1.17 – – – – –0.60Other Transf. 0.00 24.03 –24.87 –0.00 – – –0.12 – –0.96Own Use –11.47 –0.21 –119.92 –88.65 – – –0.11 –71.01 –291.37Distribution Losses –0.98 – –0.01 –3.15 – – –0.01 –64.07 –68.22TFC 126.18 1.11 1998.59 740.12 – – 133.96 852.82 3852.78Industry Sector 107.11 0.04 143.26 255.02 – – 65.12 289.96 860.51Transport Sector 0.10 – 1255.84 21.58 – – 11.47 9.81 1298.81Other Sectors 17.23 – 251.91 427.42 – – 57.38 553.05 1306.98Non–<strong>Energy</strong> Use** 1.73 1.07 347.59 36.09 – – – – 386.48*Includes geothermal, solar, electricity and heat, wind, etc.** Includes petrochemical feedstocks.39