Key World Energy Statistics 2007 - Deres
Key World Energy Statistics 2007 - Deres
Key World Energy Statistics 2007 - Deres

Create successful ePaper yourself
Turn your PDF publications into a flip-book with our unique Google optimized e-Paper software.
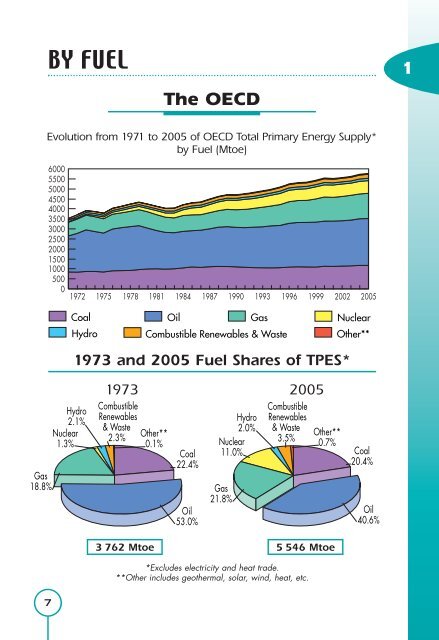
BY FUEL 1The OECDEvolution from 1971 to 2005 of OECD Total Primary <strong>Energy</strong> Supply*by Fuel (Mtoe)6000550050004500400035003000250020001500100050001972 1975 1978 1981 1984 1987 1990 1993 1996 1999 2002 2005CoalHydroOilGasCombustible Renewables & Waste1973 and 2005 Fuel Shares of TPES*NuclearOther**Gas18.8%7Hydro2.1%Nuclear1.3%1973 2005CombustibleRenewables& Waste2.3%Other**0.1%Coal22.4%Oil53.0%Hydro2.0%Nuclear11.0%Gas21.8%CombustibleRenewables& Waste3.5%3 762 Mtoe 5 546 Mtoe*Excludes electricity and heat trade.**Other includes geothermal, solar, wind, heat, etc.Other**0.7%Coal20.4%Oil40.6%