Annual Report 2000 - Kemira
Annual Report 2000 - Kemira
Annual Report 2000 - Kemira

Create successful ePaper yourself
Turn your PDF publications into a flip-book with our unique Google optimized e-Paper software.
Europa im Blick – EU-Förderungen im Land Brandenburg Seite 1Europa im Blick –EU-Förderungen im Land Brandenburg- Unterrichtsmaterial -GEKO e.V.www.geko-bb.de„Konkurrenz für den Laser“Wer heute die leistungsstärkste Plasma-Trennschneidanlageder Welt ordern will, der kommt an Kjellberg inder Lausitz nicht vorbei. In wenigen Tagen stellt dieKjellberg Finsterwalde Plasma und Maschinen GmbHihre neue Anlage HiFocus 440i auf der Messe „Euroblech“in Hannover vor. Mit 440 Ampere Stromstärke und 100Kilowatt Leistung kann sie einen Brenner so mit Energie versorgen, dass er bis zu 100Millimeter starkeEdelstahlbleche sauber zu durchtrennen vermag. In ihren Leistungsparametern ist sie so abregelbar,dass sich mit ihr sogar Gravuren (Beschriftungen) ausführen und ganz dünne Bleche schneidenlassen. Diese Technologie ist heute so vielseitig, dass sie zur ernsten Konkurrenz für die Laserschneidtechnikwurde. Etwa ab einer Blechstärke von 30 Millimetern sei für den Laser praktischSchluss, erläutert Krink. Plasma-Trennschneidanlagen hätten aber noch einen anderen entscheidendenVorteil: Sie kosteten in der Regel nur ein Sechstel dessen, was für eine Laseranlage (etwa 300000 Euro) gezahlt werden müsse. Der Exportanteil des Unternehmens liegt mittlerweile bei 55 Prozent.Die Unternehmensgruppe ist dabei mit 1,75 Millionen Euro Fördermitteln unterstützt worden.Warum investiert die Europäische Union Millionen in Elbe-Elster?Das Beispiel des EFRE-geförderten Kjellberg FinsterwaldePlasma und Maschinen GmbH istnur eines von vielen, das die Bedeutung der EU-Förderpolitik für das Land Brandenburg aufzeigt.Allein über den Europäischen Sozialfonds wurden in der Förderperiode <strong>2000</strong> bis 2006rund 26.000 kleinere und größere Projekte in Brandenburg gefördert.Brandenburg erhält EU-Fördermittel, weil das so genannte Bruttoinlandsprodukt (BIP) proEinwohner unter 75% des EU–Durchschnitts liegt. Dieses BIP-Kriterium haben die EU-Staaten im Rahmen ihrer „Konvergenz“-Politik festgelegt.„Konvergenz“ heißt „Annäherung“. Es bedeutet, dass innerhalb der EU versucht wird, dieLebensverhältnisse aller Mitgliedsstaaten – bis hin zu einzelnen Regionen – einander anzugleichen.Diese Politik ist eine Konsequenz, die vor mehr als fünfzig Jahren aus den verheerendenKriegen des 20 Jahrhunderts gezogen wurde: Zentrales Ziel der Europäischen Union, die1957 noch als „Europäische Wirtschaftsgemeinschaft EWG“ gegründet wurde, war der Erhaltdes Friedens. Man war überzeugt: Wirtschaftlicher Wohlstand ist ein wichtiger Garant fürden Frieden. So war die „Schaffung annähernd gleicher Lebensverhältnisse“ zentraler Bestandteilder „Römischen Verträge“, dem Gründungsdokument der EWG von 1957.Also mussten diejenigen unterstützt werden, denen es auch damals schon wirtschaftlichnicht so gut ging. Zum Beispiel den Regionen im Süden Italiens, die „Mezzogiorno“ genanntwerden.Die Förderpolitik hat sich über die Jahrzehnte geändert. Seit <strong>2000</strong> gibt es längerfristige Förderperioden.Nach der Förderperiode <strong>2000</strong>-2006 befinden wir uns aktuell in der Förderperiode2007 bis 2013.
CompanyTikkurilaTikkurila OyTikkurila Paints OyTikkurila ABAS Baltic Color 1)UAB Baltic ColorZAO FinncolorOOO Kraski TikkurilaTikkurila Festék KFTImagica LtdA/S Baltic Color 1)Tikkurila Polska Sp. z o.o. 2)Spetra S.r.l.Tikkurila Coatings OyTikkurila Coatings B.V.Tikkurila Coatings (Ireland) LtdTikkurila Coatings LtdTikkurila ABAS Tikkurila CoatingsTikkurila Coatings KFTZAO Tikkurila CoatingsSiA Tikkurila CoatingsTikkurila Services OyTikkurila Finance OyAlcro-Beckers ABAlcro-Beckers Norge A/SAlcro-Beckers Poland LtdAlcro-Beckers Danmark A/SPolifarb Becker Debica SANokian Laatumaalit OyPigrol Farben GmbHHolmbergs Färg i Skövde ABFärghuset i Bollnäs ABSundsvalls Färghandel ABTapetlagret Öbergs Färghus i Västerås ABGemptus ABFärgmästaren J E Englund ABHässleholms Färg & Miljö ABRF Golventreprenader ABRunes Färger ABGamol Försäljnings ABFärghuset i Malmö ABFärgservice i Malmö ABFärghuset i Kristinehamn ABBilldals Färghus ABGolv & Färghuset Peter Alvefelt AB<strong>Kemira</strong> Agro<strong>Kemira</strong> Agro Oy<strong>Kemira</strong> Agro Holdings Ltd<strong>Kemira</strong> Agro U.K. Ltd<strong>Kemira</strong> Ltd<strong>Kemira</strong> Ireland Ltd<strong>Kemira</strong> S.A./N.V.Battaille S.A.Engrais Battaille S.A.<strong>Kemira</strong> Engrais S.A.<strong>Kemira</strong> Agro Holding B.V.2
OUR CORE VALUES• Respect for individuals• Innovation• Working together• Goal orientation(More about our values on page 55.)OUR VISIONWe are the preferred partner to our customers, offeringcomplete solutions.WE AIM TO BE• The leading chemical and integrated serviceprovider for the pulp & paper industry.• The world leader in chemical water purification.• A leading European paint and coatings company.• A world-class performer in industrial chemicals.• The preferred partner in the food supply chain,offering novel solutions and integrated services.OUR CORE COMPETENCIESWater management andchemistry• Water treatment applicationsfor both drinkingwater and wastewater.• Water treatment knowhowbased on expertiseand cost-effectiveness thatcan also be exploited withinour core businesses.FINANCIAL OBJECTIVES<strong>2000</strong> TargetYear of change from 2001Net sales growth, % (continuing operations) 11 Over 10Operating income, % of net sales (continuing op.) 8 Over 10Earnings per share, growth % 217 Over 10Cash flow return on capital invested, % 11 Over 10Gearing, % 37 40–100Environmental know-how and recycling• Integrated solutions aimed at recycling raw materialsor utilizing waste.• Environmentally friendlier alternatives for chemicalsand their applications.• Increasingly sustainable integrated solutions.Internal and external networking• Our organization is flexible, allowing us to reactquickly to changes.• We implement the best practices throughout the Group.• We continuously create closer links to ourexternal networks.Brands and integrated services• Integrated services and quality products tocreate added value.• Brand products and services.• Cooperation and networking in our capital-intensiveoperations.4
<strong>Kemira</strong>’s business areas arechemicals, tikkurila and agroKEMIRA CHEMICALS OFFERS PRODUCTS ANDTOTAL SOLUTIONS FOR INDUSTRIAL CUSTOMERS<strong>Kemira</strong> Chemicals’ most important customers are the pulpand paper industry, water treatment plants and other industry(notably, the paints, printing ink, detergent and finechemicals industries). Pulp and paper chemicals as well aswater treatment chemicals are growth areas for the <strong>Kemira</strong>Group. <strong>Kemira</strong> Chemicals has production facilities in 27countries.Net sales in <strong>2000</strong>, EUR million 767% of Group net sales 30Operating income, EUR million 69% of Group operating income 40Personnel at 31.12. 3,329TIKKURILA SERVES PAINT CUSTOMERSTikkurila is a modern paint manufacturer whose brands arehousehold names in its home markets. In its marketing,Tikkurila draws on the advantages of the latest in tintingtechnology. It is an industry forerunner as a manufacturer ofenvironmentally sound products. Tikkurila has productionfacilities in 10 countries. Paints are one of the <strong>Kemira</strong>Group’s growth areas.Net sales in <strong>2000</strong>, EUR million 345% of Group net sales 13Operating income, EUR million 27% of Group operating income 15Personnel at 31.12. 1,506KEMIRA AGRO IS PART OF THE FOOD-SUPPLY CHAINAgro is one of Europe’s largest producers of specialty fertilizers.Its products are used in crop cultivation, greenhousesand horticultural applications. <strong>Kemira</strong> Agro is focussing onnew product and service packages, such as growth-promotingprogrammes for specific plants and varieties. <strong>Kemira</strong>Agro has production facilities in 11 countries.Net sales in <strong>2000</strong>, EUR million 1,116% of Group net sales 43Operating income, EUR million 23% of Group operating income 13Personnel at 31.12. 2,7595
CEO’s reviewDuring the past year we at <strong>Kemira</strong> have moved structurally in the direction wepromised, securing a lower level of capital-intensive operations and a reducedsusceptibility to the effect of business cycles. We have thus created possibilitiesfor both better earnings and faster growth.Although the forecasts for the trend in the world economy are partly conflicting- even downbeat - in the current year we expect the favourable trend to continuein our growth areas of operations: paper, pulp and water treatment chemicalsas well as paints. We shall continue to search actively for growth potentialthrough acquisitions as a continuation of last year’s Alcro-Beckers AB and KremsPaper Chemicals deals. Our aim in so doing is again to exceed our 10 per centannual growth target in our continuing business areas. In <strong>2000</strong> we achievedgrowth of 11 per cent.In all our business operations we have decided to focus on the total solutionsour customers require. We want to be more than just a supplier of chemicals.This will call for strengthening our R&D activities as we extend our networkingto encompass both customers and research institutes and universities.Environmental and recycling solutions occupy a central position within ouroperations. To meet these needs we have established competence centres inOulu to do water research and in Helsingborg, Sweden, to work on recycling solutions.We wish to underscore the objective of “the Quality of Life” in all sectorsof our operations. We are doing our part to ensure that the world has an adequatesupply of pure water and nutrition, a pleasing environment and a foundationfor culture and leisure pursuits.In developing our own products and processes, we want to stress the potentialfor achieving a balance between man, nature and industry. We want to abideby high ethical principles and to honour our commitment to international environmental,health and safety programmes, such as Responsible Care. Our environmentalbusiness will grow further from the level we have now reached: 14per cent of net sales.We also stress the importance of the quality of life in our working environment.This is why we have drawn up a set of shared values underpinning ouroperations. Our objective is a corporate culture in which each person’s knowhowand ability can develop and contribute to reaching our joint objectives.I wish to extend my warmest thanks to our customers, shareholders and otherstakeholders for their good cooperation during the past year. A special vote ofthanks goes to our personnel, who have actively and efficiently carried out ourfar-reaching process of transformation. I believe that the work we do togetherwill yield even better results in the year ahead.Tauno Pihlava6
In November an agreement wassigned on the acquisition of Alcro-BeckersAB, Sweden’s largest manufacturer ofdecorative paints. The deal entered intoforce 1 January 2001. <strong>Kemira</strong>’s positionin the UK was strengthened by purchasingthe industrial coatings business ofMason Coatings.The purchase of Krems PaperChemicals was completed in Septemberand it will increase the volume ofthe <strong>Kemira</strong> Chemicals’ Pulp & Paperunit by a good 10% annually. The watertreatment chemicals business wasbeefed up by acquiring a 15% interestin Kemiron Inc., one of the largest fullrangemanufacturers of coagulants inthe United States.It was decided to streamline theGroup’s business structure by combining<strong>Kemira</strong> Pigments Oy, which manufacturestitanium dioxide, with <strong>Kemira</strong>Chemicals’ Industrial Chemicals unit.The Kemphos phosphorus business,the Bolifor feed phosphates and thepotassium sulphate business, all ofwhich are connected with the foodsupply chain, would be transferredfrom <strong>Kemira</strong> Chemicals to <strong>Kemira</strong> Agro.<strong>Kemira</strong> Chemicals’ formic acid businesswould be transferred from the Pulp &Paper unit to the Industrial Chemicalsunit, as would the previously independentChemicals’ unit <strong>Kemira</strong> FineChemicals. The transfers aim tostrengthen the strategic focus accordingto which <strong>Kemira</strong> Chemicals will concentrateon industrial customers, Agroon customers who are part of the foodsupply chain and Tikkurila on paintcustomers. The transfers of businessescame into effect on 1 January 2001.Following these realignments,<strong>Kemira</strong> Chemicals’ net sales will increaseby about EUR 50 million and itsoperating income will improve substantiallybecause Pigments’ operating incomeis significantly better than that ofbusinesses transferred to Agro. Agro’snet sales will increase by about EUR120 million and its operating income isexpected to improve.KEMIRA CHEMICALSThe Group’s fastest growing area wasagain <strong>Kemira</strong> Chemicals, whose netsales rose by 10% to EUR 767 million(697 million). Of the strategic businessunits, Pulp & Paper Chemicals andKemwater continued to grow, whereasIndustrial Chemicals’ net sales wereslightly below the previous year’s figure.<strong>Kemira</strong> Fine Chemicals also grew.<strong>Kemira</strong> Chemicals posted operatingincome of EUR 69 million (83 millionin 1999), or 9% of net sales (12%).This figure included about EUR 13 millionof non-recurring write-downs onassets as well as about EUR 4 millionof additional costs arising from thestrikes in the spring. The greater expenseof raw materials and transportcosts due to the high price of oil hasled to higher overall costs, whichcould not in all cases be passed oninto product prices.Sales by the Pulp & Paper Chemicalsunit, which has been named oneof the Group’s strategic growth areas,increased by 14%. The growth waslargely organic because the industrywhich Pulp & Paper Chemicals servesexperienced a period of strongly risingsales in <strong>2000</strong>. It was not until right atthe end of the year that signs of aslight slowdown began to appear. Thehydrogen peroxide market has improved,particularly in North America.The other products of the Pulp andPaper unit have also performed welland the unit has succeeded in maintainingits good profitability.By way of a deal concluded at thebeginning of September, <strong>Kemira</strong>Chemicals purchased Krems PaperChemicals from Neste Chemicals Oy.The sizing agent business of the FinnishOy Chemec Ab was a part of thisdeal. The purchase price was aboutEUR 34 million and the companieshave net sales of EUR 35 million.Through this acquisition, <strong>Kemira</strong> willbecome the world’s most integratedand versatile manufacturer of papersizings and gained a strong footholdwithin speciality chemicals for the paperindustry in Europe’s Germanspeakingregion.Expansion investments continued inmany areas. An extension to the specialtychemicals plant was completed inVaasa, Finland, and in Helsingborg, Swedendebottlenecking projects will be carriedout at the hydrogen peroxide plant.The capital expenditure project for thepaper sizing plant in Brazil is movingahead according to plans.The markets of the Kemwaterbusiness unit developed as expectedand growth continued in Eastern andSouthern Europe. Kemwater’s net salesgrew by 7%, though operating incomewas below last year’s figure owing tonon-recurring write-downs on assets.Kemwater is another of the <strong>Kemira</strong>Chemicals units which belong to theGroup’s strategic growth areas.The most important of Kemwater’sgrowth projects was the purchase of a15% stake in Kemiron Inc, the UnitedStates’ largest manufacturer of a fullrange of coagulants. The company hadnet sales last year of USD 50 million.By way of the deal Kemwater gainedentry into the world’s largest singlemarket area for water treatment chemicals.At the company in China, Kemwater(Yixing) Co. Ltd, the shareholdingwas increased to 60%.Two acquisitions were made in Europe.The market position was furtherstrengthened by purchasing Luebnyzávody a.s., a Czech manufacturer ofaluminium sulphate, and the ferrichloridebusiness of Solvay S.A. of Spain.In Pori, Finland the manufacture ofmagnesium-free iron coagulant wasexpanded. Kemwater Services Oy concludeda major agreement for developingthe water supply in Kosovo. In StPetersburg, studies are being made ofpossibilities to team up with local suppliersto carry on cooperation in wastewater treatment.It was a difficult year for IndustrialChemicals. The only unit that faredNet salesOther countriesFinland96 97 98 99 00EURmillion2500<strong>2000</strong>150010005000Net sales by business area<strong>Kemira</strong>Chemicals30 %Tikkurila13 %Other 2 %<strong>Kemira</strong>Agro43 %<strong>Kemira</strong>Pigments12 %Operating income bybusiness area<strong>Kemira</strong>Chemicals40 %Tikkurila15 %Other 1 %<strong>Kemira</strong>Agro13 %<strong>Kemira</strong>Pigments31 %8
well was Kemphos, which manufacturesphosphoric acid in Siilinjärvi, Finland.Its result too was burdened bythe lower price of phosphoric acid,though this was partially offset by thehigh exchange rate of the US dollar.The units that manufacture animalfeeds and detergent chemicals had difficultiesadjusting the market prices tocompensate for the rises in raw materialcosts. The markets for phosphoric acidand calcium chloride have evened outand the fall in prices has come to a haltor has swung upwards in some markets.Of the detergent chemicals units,Industrial Chemicals sold its sodiumtripolyphosphate business, which hadnet sales of about EUR 39 million andreported a loss on operations. Followingthe divestment, <strong>Kemira</strong> Chemicalswill close its sodium tripolyphosphatemanufacturing operations in Helsingborg,Sweden, resulting in a non-recurringcharge of about EUR 10 million.Within detergent raw materials theaim is to concentrate on bleachingchemicals, notably sodium percarbonate.Demand for the product hasgot off to a good start and its productionin Helsingborg will be more thandoubled.<strong>Kemira</strong> Fine Chemicals increasedboth its net sales and operating income.TIKKURILAOf Tikkurila’s businesses, tinting systemswere sold, causing net sales tofall by 3% from last year’s figure, toEUR 345 million. Tikkurila Paint’s netsales grew by 6%, whereas Coatings’net sales fell by 9% as a consequenceof disposals of businesses in Great Britain.Operations improved markedly inRussia, Poland and Sweden. TikkurilaCPS was sold in the autumn. The figuresfor CPS’s tinting machines are includedin net sales up to the end ofAugust and colourants up to the end ofSeptember.Tikkurila’s operating income improvedand was EUR 27 million (23million), or 8% of net sales (6%). Operatingincome includes EUR 1.4 millionof other operating income fromthe Tikkurila Coatings’ arrangementsin the UK as well as EUR 0.9 millionfrom the disposal of the Italian companyMatherson S.p.A., a previous CPSunit which manufactures colour cards.As part of the arrangements connectedwith the operations in Poland, a oneoffwrite-down was made to cover theclosure of alkyd production. In Finland,Tikkurila Paints revamped itsmarketing. The cost impact of thesemeasures was a total of about EUR 4million.The sale of Tikkurila CPS’s tintingsystem business took place in twoparts. CPS sold a 50% portion of itsholding in the tinting machine businessto Swisslog AG of Switzerland. Inanother transaction, the colourantbusiness was sold to a newly foundedcompany, in which <strong>Kemira</strong> retained a28% holding. In the first part of theyear, the net sales of the operations divested,including Swisslog’s share ofthe tinting machine business, amountedto about EUR 118 million. The saleprice totalled about EUR 200 million,or nearly twice the units’ net sales lastyear, calculated on <strong>Kemira</strong>’s proportionalinterest in the units. The capitalgain on the deals before taxes wasabout EUR 96 million, taking into account<strong>Kemira</strong>’s remaining minority interestin the new company.The disposal of Tikkurila CPS eliminatedany conflict of interests, whichin certain cases has been detrimentalto the sales of tinting systems toTikkurila’s global competitors in thepaints business and which furthermoreconstrained the growth of TikkurilaPaints and Coatings.In November an agreement wassigned on the acquisition Alcro-BeckersAB, Sweden’s largest manufacturer ofdecorative paints. Alcro-Beckers hadnet sales in <strong>2000</strong> of about EUR 190 million,including the industrial coatingsbusiness in Poland that was included inthe deal. The purchase price was aboutEUR 180 million. Alcro-Beckers’ largestproduction plants are in Sweden andPoland and it also has operations inDenmark, Norway, Germany and Finland.Via this deal, the combined decorativepaints business is now the largestin the Nordic countries and one of thelarge players in Europe. The businesswas made a part of the <strong>Kemira</strong> Groupas from 1 January 2001.Tikkurila’s OOO Kraski Tikkurilasubsidiary in Moscow started up operationsin the spring. In line with itsgrowth strategy, Tikkurila purchasedthe 40% stake in Tikkurila BaltcolorSp. z o.o. held by the Polish partnerBaltchem S.A. Tikkurila Paints andTikkurila Coatings now own 100% ofthe company’s shares on a 50-50 basis.The company, which is now calledTikkurila Polska Sp. z o.o., producesand markets both decorative paintsand industrial coatings on the Polishmarket. As part of the Alcro-Beckersdeal, Tikkurila acquired Polifarb Debica,an important unit in Poland.Tikkurila strengthened its positionin the UK by purchasing the industrialcoatings business of Mason Coatings.Manufacture of its products will bemoved to the plants in Bury and WestBromwich.KEMIRA AGROImplementation of <strong>Kemira</strong>’s new strategy,according to which Agro is prioritizingspecialty fertilizers, was set in motionright from the beginning of theyear by dividing Agro into two newstrategic business units: <strong>Kemira</strong> AgroSpecialties (KAS) and <strong>Kemira</strong> Agro Nitrogen(KAN). <strong>Kemira</strong> aims to peel off<strong>Kemira</strong> Agro Nitrogen in line with itsstrategy.<strong>Kemira</strong> Agro’s vision is to be a primarypartner in cooperation and supplierwithin the food supply chain. Toimplement the new strategy, the partsof <strong>Kemira</strong> Chemicals which are connectedwith the food supply chain wereNet sales by regionAsia 6 %Americas8 %OtherEurope10 %Other 2 %Finland19 %Other EU55 %Operating income and result%1086420Operating incomeIncome after financial itemsOperating margin, %96 97 98 99 00EURmillion250200150100500Return on capitalReturn on equity, %Return on capital invested, % %1412108642096 97 98 99 009
transferred to Agro as from 1 January2001. The businesses transferred wereanimal feed phosphates, phosphoricacid and potassium sulphate.<strong>Kemira</strong> Agro had net sales of EUR1,116 million (1,015 million) and operatingincome of EUR 23 million (an operatingloss of EUR 39 million). Fertilizerprices headed upwards in the firstquarter of the year and kept risingthroughout the rest of the year. Pricesof nitrogen fertilizers were 40-90%higher in different markets at the endof the year and prices of NPK fertilizers20-35% higher in the EU than theywere a year earlier. Competition in thearea of NPK compound fertilizers gottougher in Agro’s main markets outsideEurope. Within raw materials, the priceof natural gas rose sharply, taking a bigbite out of the upside brought by theprice increases, though part of the naturalgas purchases are hedged througha fixed-price contract.In order to improve its position inthe Russian and Baltic markets, <strong>Kemira</strong>Agro has increased its holding in theLithuanian company UAB <strong>Kemira</strong>-Lifosafrom 33% to 51%. The joint venturesproducing compound fertilizers both inLithuania and Malaysia got up to speedand the NPK plant in Zhanjiang, China,was completed in December, when itstarted up trial production. A plant thatwill manufacture water-soluble ureaphosphate will go into operation in theUnited Arab Emirates in February. Thejoint project that was started togetherwith Arab Potash Company to producepotassium nitrate and dicalcium phosphatein Jordan has moved ahead accordingto plans and production willstart up in the summer 2002.Major structural changes took placein Western Europe, <strong>Kemira</strong> Agro’s mainmarket area. Owing to the reduced demandfor products and to cheap imports,the European fertilizer industryclosed about 30 plants by the end of<strong>2000</strong>. About 3 million tonnes of nitrogenfertilizer capacity and 1 milliontonnes of NPK fertilizer capacity cameoff the market. In June, <strong>Kemira</strong> Agroclosed the Pernis plant in the Netherlandsand in December the Rozenburgplant, bringing about a total reductionof 560,000 tonnes of NPK/DAP capacityand nearly 1 million tonnes of nitrogenfertilizer capacity. The latter closure resultedin charges to income in <strong>2000</strong> totallingabout EUR 82 million, which arepresented in the income statement line:“Non-recurring items from discontinuingoperations”. All these moves are believedto improve the health of the sectorand to enable Agro’s fertilizer operationsto develop as part of WesternEurope’s high-quality and competitivefood supply chain.KEMIRA PIGMENTSAs a consequence of divestments ofbusinesses, <strong>Kemira</strong> Pigments’ net salesdeclined by 37% to EUR 307 million.Sales volumes were about 44% smallerthan they were a year ago after the unitin the United States was divested at thebeginning of April and the unit in theNetherlands at the beginning of May.The divested units had net sales in thefirst part of the year of EUR 97 millionand posted an operating loss of EUR 3million. In 1999 the net sales of the divestedunits were EUR 326 million. Thesales volumes of the remaining unit inPori grew by 9% and average pricesrose by nearly 14% on the same perioda year ago.<strong>Kemira</strong> Pigments posted operatingincome of EUR 54 million (35 million in1999).Demand for titanium dioxide pigmentgrew significantly in <strong>2000</strong> comparedwith the previous year in all themarket areas, but most of all in WesternEurope. The strong growth in demandled to a tight delivery situation, pushingup prices several times during the year.The latest price increase notificationswere made towards the end of <strong>2000</strong>.From the beginning of 2001,<strong>Kemira</strong> Pigments is part of <strong>Kemira</strong>Chemicals’ Industrial Chemicals unit.OTHER UNITS<strong>Kemira</strong> Metalkat, which manufacturescatalytic converters, reported net salesgrowth of 14% to EUR 40 million. Operatingincome was EUR 2.8 million, asagainst EUR 3.1 million a year earlier.<strong>Kemira</strong> Safety, which manufacturespersonal respiratory protective devices,was sold to the American company ScottTechnologies Inc. for USD 17 million,resulting in a capital gain of EUR 12 million.The business was transferred to thebuyer as from the beginning of May.FINANCIAL PERFORMANCEConsolidated operating income wasEUR 175 million (111 million), representing7% of net sales. Income beforetaxes and minority interests was EUR307 million (59 million), includingnon-recurring income in a net amountof EUR 162 million. Net financial expenseswere EUR 31 million (52 million).Income after taxes was EUR 208million (30 million). The cash flow returnon invested capital was 11%.CAPITAL EXPENDITUREThe Group’s capital expenditures totalledEUR 218 million (168 million),or 9% of net sales. Capital expendituresincreased on the previous year,when no major acquisitions weremade. The Alcro-Beckers acquisitiondoes not yet show up in the figuresfor <strong>2000</strong>. Depreciation on fixed assetsamounted to EUR 171 million. Disposalsof assets including the sales of subsidiariesgenerated EUR 527 million(18 million). The Group’s investmentsin environmental protection amountedto EUR 9 million (13 million). All themost important capital expendituresare discussed in the reviews of thebusiness areas.The Group spent about EUR 48million on research and development,or about 2% of net sales. The figuredoes not include capital expenditures.Capital expenditureEURmillion300250200150100500Capital expenditure bybusiness areaOther6 %<strong>Kemira</strong>Agro30 %Net debt and financing expenses%1512Net debtNet financing expenses, % of liabilitiesEURmillion1000800% As % of net sales12108642096 97 98 99 00<strong>Kemira</strong>Chemicals46 %<strong>Kemira</strong>Pigments12 %Tikkurila6 %963096 97 98 99 00600400<strong>2000</strong>10
ENVIRONMENTAL PROTECTIONAND MANAGEMENT OF RISKSEnvironmental protection is an essentialpart of the Group’s operations. Theverified Environmental <strong>Report</strong> is includedin this <strong>Annual</strong> <strong>Report</strong> (pp. 56-62).The Group continually pays particularattention to ensuring that its operationsare safe and its plants run withoutdisturbances. Operations are alsoevaluated together with the risk managementunits of insurance companies.During the year the 12 largest productionsites were thus evaluated. Boththe environmental protection and riskmanagement organizations werestrengthened and centralized withinGroup Administration.FINANCINGThe Group’s financial position strengthenedsubstantially as a consequence ofthe divestments of businesses. Interestbearingnet debt at the end of <strong>2000</strong>stood at EUR 425 million (934 million).New loans were not raised during theyear and a substantial part of the shortterm-loans was repaid.Cash flow before financing was EUR523 million (31 million). The Group’sequity ratio was 48% at the end of theyear (38%). The gearing ratio (net debtas a ratio of shareholders’ equity) was37%. The amount of liquid funds grewmarkedly on the previous year, totallingEUR 247 million at the end of the year.Unused agreed credit facilities amountedto about EUR 422 million.Net financing expenses were EUR31 million (52 million). The increase incosts due to the rise in interest rateswas compensated by lower net debts,a gain on foreign exchange and bymeasures taken to hedge interest raterisks. The proportion which fixed-interestloans represent within the totalamount of the Group’s interest-bearinglong-term loans (including pensionloans, which are considered to befloating rate loans) was about 51% atthe end of the year. Foreign exchangegains amounted to EUR 1.5 million (aforeign exchange loss of EUR 1.6 million).PARENT COMPANY’S FINANCIALPERFORMANCEThe parent company’s net sales comeonly from the sale of energy in Finlandboth within and outside the Group.The parent company had net sales ofEUR 21 million (27 million). Operatingloss was EUR 0.3 million (a profit of3.5 million). The parent companybears the cost of Group managementand administration.The reason for the fall in net saleswas that in the previous year the parentcompany sold a substantial part ofits electric power business.The parent company’s net financialexpense totalled EUR 7.4 million(income 16.5 million). Income beforetaxes and appropriations was EUR 170million (102 million). Capital expendituresamounted to EUR 20 million, includingincreases in the equity of subsidiaries.PERSONNELThe Group employed an average of9,644 people, or 1,099 less than in theprevious year. Of the total personnel,an average of 4,736 were employed byGroup companies outside Finland.The parent company had an averagepayroll of 120 employees, 12 lessthan a year ago.During the year under review thefollowing persons served on the Boardof Directors of <strong>Kemira</strong> Oyj: Sten-OlofHansén (Chairman), Niilo Pellonmaa(Vice Chairman), Timo Kaisanlahti, EijaMalmivirta, Anssi Soila and Tauno Pihlava.At its meeting on 13 December<strong>2000</strong> the Supervisory Board electedthe previous directors to seats on theBoard for the term beginning 1 January2001, except for Timo Kaisanlahti,who was replaced by Ritva Hainari. Ofthe members of the Board of Directors,only CEO Tauno Pihlava is employedby the <strong>Kemira</strong> Group.A large part of the Group’s personnelare covered by various bonus systemsthat vary from country to country.In addition, the Group has a share optionsystem for top management. This isdiscussed in greater detail on page 13.OWNERSHIPThe Finnish government’s holding in<strong>Kemira</strong> was 53.4% at 31 December<strong>2000</strong>. The proportion held by institutionalinvestors outside Finland was15.1%, whereas Finnish institutional investorsand mutual funds held 20.8%of the shares. Private investors’ holdingsamounted to 6.7% of the sharesoutstanding.In accordance with the authorizationgranted by the <strong>Annual</strong> GeneralMeeting, the company repurchased atotal of 4,155,000 of its own shares(share buyback) by 31 December <strong>2000</strong>at an average price of EUR 5.54/share.In addition, the company has in itspossession 1,000,000 shares which itpurchased in 1999, giving the companya total holding of 4.0% of <strong>Kemira</strong>’sshares outstanding.CHANGES IN THE GROUPSTRUCTUREVarious companies or participationswere established, acquired or divestedduring the year, as discussed in the reviewof the business areas above. Thechanges in the Group structure arepresented in more detail on page 37-38. Because the changes made duringthe financial year were major in sizeand import, the financial statement informationof both continuing and discontinuingoperations are given separatelyin the Notes to the consolidatedfinancial statements.GearingNet debt divided by net debt plus equity.Target96 97 98 99 00%100806040200Cash flowCash flow from operationsCash flow after capital expenditure96 97 98 99 00EURmillion6005004003002001000–100–200Personnel 31.12.<strong>2000</strong>Othercountries2529Holland370Sweden803Finland4495UK66811
OUTLOOK FOR THE FUTURE<strong>Kemira</strong> Chemicals. The market outlookfor the Pulp & Paper Chemicals unit remainsgood thanks to continuing strongdemand in the Pulp and Paper industry.Recently, however, there has been increaseduncertainty concerning economicgrowth. The transfer of the formicacid business to Industrial Chemicalswill take with it both net sales and operatingincome, thereby cutting into Pulp& Paper Chemicals’ growth.The Kemwater unit is expected tocontinue growing at a strong rate and itsstrategy will be implemented by centralizingoperations within larger units.The titanium dioxide pigment businessthat was transferred to IndustrialChemicals has continued to enjoy gooddemand, though the slowing economicgrowth in the United States may lowerdemand in the North American market.New titanium dioxide capacity willcome on stream to a limited extent andthe price level of the product is expectedto hold up well throughout the currentyear too. In addition, IndustrialChemicals’ result will be improved bythe formic acid business that was transferredfrom Pulp & Paper Chemicals, aswell as by the melding of <strong>Kemira</strong> FineChemicals into Industrial Chemicals. Onthe other hand, a factor that will lowernet sales and operating income is thetransfer of the Kemphos phosphoricacid business, feed phosphates and potassiumsulphate business, which areconnected with the food supply chain,to <strong>Kemira</strong> Agro from the beginning of2001.Of Industrial Chemicals’ other products,the sales volumes of calcium chlorideare expected to grow and its pricelevel to move in a better direction. Inline with an agreement that has beensigned, Industrial Chemicals will get outof its detergent phosphate business, thuseliminating the loss that was booked lastyear. The other detergent raw material,sodium percarbonate, has done well onthe market and operations are expectedto show further favourable development.As a consequence of the structural arrangementscarried out and the strengthof the operating environment, <strong>Kemira</strong>Chemicals’ full-year operating incomewill increase markedly on last year’s.Tikkurila. The divestment of TikkurilaCPS will make possible strongergrowth of the mainline paints business.An example in point is the net salesgenerated by Alcro-Beckers, which becamea part of Tikkurila from the beginningof the year. The joint growth prospectsof Tikkurila and Alcro-Beckers arebetter than ever before, especially inRussia, the Baltic countries and Poland,where the growth potential of the overallmarket is substantial.The paints business is estimated toreport better earnings this year than itdid in <strong>2000</strong>.<strong>Kemira</strong> Agro. Grain stocks aroundthe world were smaller at the end of<strong>2000</strong> than they have been in recentyears. Owing to the prohibition on theuse of meat and bone meal (MBM),there will probably be an increasingneed for soy beans and cheap feedgrain in Europe in step with an acceleratingshift to feed phosphates. Globalnutrient demand is forecast to grow by1%. In Western Europe the quantitiesare still declining slightly, but thanks tothe closures of local fertilizer industrycapacity and limitations on cheap imports,fertilizer supply and demand willbe in better balance than they havebeen for a long time. This is also reflectedby the fact that the stocks ofWest European producers are smallerthan they were last year. The positiveexpectations are also strengthened bythe agreement between China and theWorld Trade Organization, WTO.<strong>Kemira</strong> Agro will continue its preparationsaimed at getting out of nitrogenfertilizer production. Although prices, especiallyof nitrogen fertilizers, have risenmarkedly, the high price of natural gasand the strong dollar will push up rawmaterial costs, thereby eating into theupside brought by higher prices, especiallyin the first half of the year. Thereafterthe price of natural gas too is expectedto stabilize at a lower level.On the horticultural and specialtyfertilizer side as well as within processchemicals, the favourable trend is expectedto continue.<strong>Kemira</strong> Agro’s full-year operatingincome is expected to improve on lastyear’s figure.<strong>Kemira</strong> Group. The most significantof the external factors of uncertainty influencing<strong>Kemira</strong>’s result are the trendin the United States economy and theresultant exchange rate of the dollar aswell as the global trend in the price ofenergy. Furthermore, the solution leadingto the divestment of <strong>Kemira</strong> Agro’snitrogen fertilizer business may alsohave an important impact. This year the<strong>Kemira</strong> Group’s operating income is expectedto exceed last year’s figure. As aconsequence of acquisitions that willbe made, net debt and net financingcosts will increase this year, but the netoperational result is nevertheless expectedto improve on last year’s.EARNINGS AND PERSONNEL BY BUSINESS AREA IN <strong>2000</strong>EUR million Net sales Operating Income after Personnel,income financial items average<strong>Kemira</strong> Chemicals 767 69 53 3,210Tikkurila 345 27 26 2,049<strong>Kemira</strong> Agro 1,116 23 6 2,833<strong>Kemira</strong> Pigments 307 54 50 1,084Others* 76 2 9 468Intra-Group sales –125Group, total 2,486 175 144 9,644* Includes other businesses, Group administration and eliminations from operating income and income before extraordinary items.All forecasts and estimates mentioned in this report are based on the current judgement ofthe economic environment, and the actual results may be significantly different.12
Shares and shareholdersSHARES AND VOTING RIGHTS<strong>Kemira</strong> Oyj has 128,800,000 sharesoutstanding and each share carriesone vote at general meetings of theshareholders. According to the Articlesof Association, the company’s sharecapital can be in the range of fromEUR 217 to 850 million. The sharecapital can be changed within theselimits without amending the Articles ofAssociation. The share capital of<strong>Kemira</strong> Oyj at present is EUR 217 million.<strong>Kemira</strong> Oyj shares are registeredwithin the book-entry system.DIVIDEND POLICY<strong>Kemira</strong> aims to distribute a dividendwhich is 30% - 50% of its operativenet income. The company’s Board ofDirectors will propose to the <strong>Annual</strong>General Meeting that a dividend ofEUR 0.30 per share, or EUR 37.1 million,be paid for the <strong>2000</strong> financialyear. This corresponds to a dividendpayout of 41% of the net income withoutnon-recurring items, or 18% of thenet income for the year. Taking intoaccount the Finnish tax base, thisamounts to a taxable dividend of EUR0.42. The record date for the dividendpayout will be 6 April 2001, and thedividend will be paid on 18 April2001.INCREASE IN SHARE CAPITALThe Board of Directors of <strong>Kemira</strong> Oyjdoes not at present have authorizationsto increase the company’s sharecapital.PURCHASE OF OWN SHARESThe <strong>Annual</strong> General Meeting held on11 April <strong>2000</strong> resolved to authorizethe company’s Board of Directors topurchase a maximum of 5,440,000 ofthe company’s own shares on themarket (share buyback). The authorizationis valid for one year from thedate of the <strong>Annual</strong> General Meeting.Including shares previously boughtback, the company can have in itspossession a total of 6,440,000 of itsown shares, representing 5% of theentire shares outstanding. On the basisof the new authorization, by 31December <strong>2000</strong> the number of sharesbought back was 4,155,000 and thecompany had in its possession a totalof 5,155,000 of its own shares.INSIDER RULESThe insiders regulations issued by HelsinkiExchanges on 28 October 1999are observed within the <strong>Kemira</strong>Group. A list of insiders including theirshareholdings at 31 December <strong>2000</strong> isgiven on page 66.LISTING AND SHARE TRADING<strong>Kemira</strong> Oyj’s shares have been listedon Helsinki Exchanges since 10 November1994. In addition to Helsinki,trading in the shares is done throughthe SEAQ International trading systemoperated by the London Stock Exchange.<strong>Kemira</strong> is also part of thePORTAL system in the United States.In the United States, <strong>Kemira</strong>’s shareswere issued under Regulation 144A,whereby only qualified institutionalbuyers permitted under this legislationare allowed to buy and sell the shares.<strong>Kemira</strong>’s shares can also be traded inthe United States in the form of ADSshares. One ADS share corresponds totwo <strong>Kemira</strong> shares.PRICE AND TRADING VOLUMEThe price of <strong>Kemira</strong>’s share on HelsinkiExchanges weakened by 12.3% during<strong>2000</strong>, whereas the HEX index fellby 10.6%. The highest price of theshare was EUR 6.80 and the lowestprice was EUR 4.92. The price of theshare at the end of the year was EUR5.36. The taxation value of the sharefor year <strong>2000</strong> Finnish tax declarationsis EUR 3.605. Turnover of the share onHelsinki Exchanges totalled 17,366,406shares, and in euro terms the turnoverwas EUR 98 million. The market capitalizationat the end of <strong>2000</strong> was EUR663 million.DISTRIBUTION OF OWNERSHIP 31.12.<strong>2000</strong>MANAGEMENT BOND ISSUE WITHWARRANTS, STOCK OPTIONS ANDSHARE OWNERSHIPOn 26 April, 1995, the <strong>Annual</strong> GeneralMeeting of <strong>Kemira</strong> Oyj passed a resolutionto float an issue of bonds withwarrants targeted at the managementof the <strong>Kemira</strong> Group. The amount ofthe bond loan was EUR 100,912.76.Each member of the Board of Directorswho was employed by <strong>Kemira</strong>Oyj was entitled to subscribe for amaximum of EUR 13,455.03 of thebond loan with warrants. The maturityof the issue was five years beginningon 2 May 1995, the interest is 6% andthe issuing price was 100%. The optionsgive management the right tosubscribe for a maximum of 1,200,000shares in the company between 1 December1998 and 31 January 2002 at aprice of EUR 6.73 per share. Thesesubscriptions can increase the company’sshare capital by a maximum ofEUR 2.02 million. The bonds with warrantswere subscribed for by 16 persons.At present, no one had sold theirwarrants or converted them intoshares.The conditions for exercise of the1998 share option programme werenot fulfilled.The members of the Board of Directorsand the Supervisory Board aswell as the Managing Director and theManaging Director’s Deputy owned37,580 <strong>Kemira</strong> Oyj shares at the end ofthe year. This represents 0.03% of thecompany’s shares and voting rights.The issue of bonds with warrants entitlingholders to <strong>Kemira</strong> Oyj shares hasbeen subscribed for by the ManagingDirector and the Managing Director’sDeputy in the amount of EUR16,818.79, which corresponds to200,000 share options.Number of Number of % of Shares % of sharesshares shareholders shareholders total and votes1 – 50 1,063 8.09 41,817 0.0351 – 100 1,038 7.90 81,477 0.06101 – 1,000 8,828 67.22 3,830,372 2.971,001 – 5,000 1,914 14.57 3,725,920 2.895,001 – 10,000 135 1.03 1,017,858 0.7910,001 – 100,000 115 0.88 3,291,920 2.56100,001 – 500,000 24 0.18 5,480,100 4.25500,001 – 1,000,000 6 0.05 4,037,563 3.14Over 1,000,000 11 0.08 89,971,374 69.85Total 13,134 100.00 111,478,401Nominee-registered shares 17,321,599 13.46Grand total 128,800,000 100.0013
Distribution of shareholders31.12.<strong>2000</strong>Non-profitorganizations1 %Public sectorentities62 %Earnings/shareEUR1,00,80,6Cash flow/shareEUR2,52,01,5Households7 %Foreignshareholders 15 %Financialinstitutionsand insurancecompanies 9 %Privatecompanies 6 %96 97 98 99 000,40,2096 97 98 99 001,00,50Shareholders’ equity/share96 97 98 99 00EUR109876543210Share price* 1996–<strong>2000</strong>*monthly average<strong>Kemira</strong>HEX96 97 98 99 00EUR706050403020100Share turnover on HelsinkiExchanges 1996–<strong>2000</strong>96 97 98 99 00Millionshares654321020 LARGEST SHAREHOLDERS 31.12.<strong>2000</strong>Shareholder Number of % of sharesshares (1000) and votes1. Finnish State 68,754 53.382. Franklin Resources Inc. 1) 6,425 4.993. Sampo Group 3,539 2.75Industrial Insurance Company Ltd 1,480,000 sharesSampo Enterprise Insurance Company Ltd 450,000 sharesSampo Life Insurance Company Ltd 1,609,000 shares4. Ilmarinen Mutual Pension Insurance Company Ltd 3,435 2.675. Pohjola Group 2,920 2.27Pohjola Non-Life Insurance Company 1,780,000 sharesPohjola Life Insurance Company Ltd 1,140,000 shares6. Varma-Sampo Mutual Pension Insurance Company 2,514 1.957. Odin Group 1,956 1.52Odin Norden 1,538,000 sharesOdin Finland 418,000 shares8. Tapiola Mutual Pension Insurance Company 1,562 1.219. Suomi Mutual Life Assurance Company 1,260 0.9810. Local Government Pensions Institution 800 0.6211. Tapiola General Mutual Insurance Company 714 0.5512. Norvestia Oyj 705 0.5513. Kaleva Mutual Insurance Company 700 0.5414. Pension Foundation Neliapila s.r. 577 0.4515. Mutual Insurance Company Pension-Fennia 542 0.4216. Tapiola Mutual Life Assurance Company 455 0.3517. The LEL Employment Pension Fund 348 0.2718. Seligson & Co. Fund Management Company Plc 314 0.2419. Neste Pension Foundation s.r. 270 0.2120. Finnish Broadcasting Company Pension Foundation s.r. 246 0.19<strong>Kemira</strong> Oyj 5,155 4.00Nominee-registered shares 10,897 8.46Other, total 14,712 11.43Total 128,800 100.001)As announced by Franklin Resources Inc. 30 November <strong>2000</strong>. In addition the company has assets managed under agreement asfollows: 3,788,620 shares, or 2.94 % of shares and votes.14
Definitions of key ratiosPER-SHARE DATAEarnings per share (EPS)Income before extraordinary items +/– minority interest– taxesAdjusted average number of sharesNet income per shareNet incomeAdjusted average number of sharesCash flow from operationsCash flow from operations, after change in net workingcapital and before capital investmentsCash flow from operations per shareCash flow from operationsAdjusted average number of sharesDividend per shareDividends paidNumber of shares at end of yearDividend payout ratioDividend per share x 100Earnings per shareDividend yieldDividend per share x 100Share price at end of yearEquity per shareEquity at end of yearNumber of shares at end of yearFINANCIAL RATIOSNet liabilitiesInterest-bearing liabilities – cash and bank – securitiesEquity ratio, %Shareholders’ equity + minority interest x 100Total assets – advance payments receivedGearing, %Net liabilities x 100Shareholders’ equity + minority interestInterest coverOperating income + depreciationNet financial expensesReturn on capital invested, % (ROI)Income before extraordinary items + interest expenses +other financing expenses x 100Total assets – interest-free liabilities(average)Return on equity, % (ROE)Income before extraordinary items – taxes+/– tax effect of extraordinary items x 100Shareholders’ equity + minority interests(average)Cash flow return on capital invested (CFROI), %Cash flow from operations x 100Total assets – interest-free liabilities(average)Share price, year averageShares traded (EUR)Shares traded (volume)Share price, end of yearWeighted average share price of the last trading dayPrice per earnings per share (P / E)Share price at end of yearEarnings per sharePrice per equity per shareShare price at end of yearEquity per sharePrice per cash flow per shareShare price at end of yearCash flow from operations per shareShare turnoverNumber of shares traded during the year and the proportionalshare of number of shares traded to weighted average numberof shares during the year15
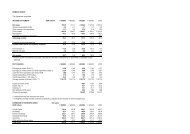
Key figuresPER-SHARE DATA<strong>2000</strong> 1999 1998 1997 1996Per-share dataEarnings per share, EUR 1) 4) 0.73 0.23 0.61 0.81 0.86Net income per share, EUR 1) 1.64 0.23 0.61 0.81 0.86Cash flow from operations per share, EUR 1.69 1.41 0.96 2.00 2.05Dividend per share, EUR 2) 0.30 0.23 0.29 0.29 0.27Dividend payout ratio, % 2) 18.2 100.0 47.2 35.3 31.4Dividend yield 2) 5.6 3.8 4.6 3.3 2.7Equity per share, EUR 1) 9.08 7.57 7.27 7.16 6.53Price per earnings per share (P/E) ratio 1) 7.34 26.57 10.30 10.60 11.43Price per equity per share 1) 0.59 0.81 0.90 1.20 1.50Price per cash flow per share 3.17 4.33 6.50 4.30 4.78Dividend paid, EUR million 2) 37.1 29.6 36.8 36.8 34.7Share price and turnoverShare price, year high, EUR 6.80 6.90 10.60 10.34 10.09Share price, year low, EUR 4.92 5.20 5.21 7.65 6.05Share price, year average, EUR 5.67 5.85 8.06 9.01 8.06Share price, end of year, EUR 5.36 6.11 6.24 8.61 9.81Number of shares traded (1000), Helsinki 17,366 20,703 30,277 33,241 33,276% of number of shares 13 16 24 26 27Market capitalization, end of year, EUR million 663.0 780.9 803.6 1,109.2 1,262.9Increase in share capitalAverage number of shares (1000) 3) 126,623 128,318 128,800 128,800 122,090Number of shares at end of year (1000) 3) 123,645 127,800 128,800 128,800 128,800Increases in number of shares (1000) – – – – 8,000Share capital, EUR million 217.0 217.0 216.6 216.6 216.6Increases in share capital, EUR million – – – – 13.51)The change in accounting practice (IAS 12) reduced 1998 taxes by EUR 14.0 million.2)The <strong>2000</strong> dividend is the Board of Directors’ proposal to the <strong>Annual</strong> General Meeting.3)Weighted average number of shares outstanding, adjusted by the number of shares bought back.4)Net income before gain/loss on discontinuing operations.16
FINANCIAL RATIOS<strong>2000</strong> 1999 1998 1997 1996Income statementNet sales, EUR million 2,486 2,526 2,413 2,420 2,266Foreign operations, EUR million 2,024 2,073 1,916 1,955 1,764Sales in Finland, % 19 18 21 19 22Exports from Finland, % 24 20 19 22 24Sales generated outside Finland, % 57 62 61 59 54Operating income, EUR million 175 111 148 198 210% of net sales 7 4 6 8 9Net financing income and expenses, EUR million 31 52 51 53 67% of net sales 1 2 2 2 3Interest cover 11 6 6 7 6Income before extraordinary items, EUR million 144 59 97 145 143% of net sales 6 2 4 6 6Extraordinary income and expenses, EUR million – – – – –Discontinuing operations 162 – – – –Income before taxes and minorityinterests, EUR million 307 59 97 145 143% of net sales 12 2 4 6 6Net income, EUR million 1) 208 30 79 104 104Return on capital invested, % 10 6 8 11 12Return on equity, % 1) 9 3 8 12 14Cash flowCash flow from operations, EUR million 214 181 123 257 250Sales of subsidiaries and fixed assets,EUR million 527 18 14 61 26Capital expenditure, EUR million 218 168 255 211 202% of net sales 9 7 11 9 9Cash flow after capital expenditure, EUR million 523 31 –119 107 73Cash flow return on capital invested, % 11 9 7 14 14Balance sheetNon-current assets, EUR million 1,277 1,486 1,444 1,404 1,366Shareholders’ equity, EUR million 1) 1,122 968 936 923 840Liabilities, EUR million 1,259 1,620 1,504 1,458 1,601Total assets, EUR million 2,399 2,603 2,453 2,389 2,447Net liabilities, EUR million 425 934 892 745 798Equity ratio, % 1) 48 38 39 39 35Gearing, % 37 95 94 80 94PersonnelPersonnel (average) 9,644 10,743 10,785 10,392 10,631of whom in Finland 4,908 5,090 5,155 5,176 5,945Exchange ratesKey exchange rates (31 December)USD 0.93050 1.00460 1.16674 1.09686 1.28033GBP 0.62410 0.62170 0.70547 0.66122 0.75559NLG 2.20371 2.20371 2.20371 2.12352 2.23322SEK 8.83130 8.56250 9.48736 8.66346 8.81110DKK 7.46310 7.43300 7.44892 7.48079 7.61395BEF 40.3399 40.3399 40.33990 40.50225 41.03333FIM 5.94573 5.94573 5.94573 5.94573 5.945731)The change in accounting practice (IAS 12) reduced 1998 taxes by EUR 14.0 million.17
Consolidated income statement1.1. – 31.12.Note <strong>2000</strong> 1999EUR million EUR millionNet sales 1, 28 2,486.0 2,526.2Share of associates’ net income 2, 28 –0.5 2.8Other income from operations 3 30.9 32.6Cost of sales 4, 5 –2,170.3 –2,262.5Depreciation 6, 28 –171.3 –188.1Operating income 28 174.8 111.0Financing income and expenses 7 –30.5 –52.4Income before non-recurring items, taxes andminority interest 144.3 58.6Non-recurring items from discontinuing operations 8, 22 162.2 –Income before taxes and minority interests 306.5 58.6Direct taxes 9 –96.3 –27.8Income before minority interests 210.2 30.8Minority interest –2.4 –0.9Net income 207.8 29.9Earnings per share, EUR 10 0.73 0.23The income statement has been split into continuing and discontinuing operations in Note 22.18
Consolidated balance sheet31.12.Note <strong>2000</strong> 1999EUR million EUR millionASSETSNon-current assetsIntangible assets 11 88.7 79.7Tangible assets 12 1,049.5 1,328.2Investments 13Holdings in associates 63.4 50.7Other shares and holdings 19.6 8.4Other investments 55.3 18.5Total investments 138.3 77.6Total non-current assets 1,276.5 1,485.5Current assetsInventories 14 348.7 455.9Receivables 15Interest-bearing receivables 11.2 23.4Other interest-free receivables 515.9 549.7Total receivables 527.1 573.1Securities 21, 26 199.0 42.4Cash and bank 21, 26 47.7 46.0Total current assets 1,122.5 1,117.4Total assets 2,399.0 2,602.9LIABILITIES AND SHAREHOLDERS’ EQUITY31.12.Note <strong>2000</strong> 1999EUR million EUR millionShareholders’ equityShare capital 217.0 217.0Share premium account 252.5 252.5Revaluation reserve 8.0 8.3Own shares –28.8 –5.8Other reserves 2.6 4.2Retained earnings 463.2 461.6Net profit for the financial year 207.8 29.9Total shareholders’ equity 1,122.3 967.7Minority interests 18.0 15.2Long-term liabilitiesInterest-bearing long-term liabilities 17,21 573.3 848.8Deferred tax liabilities 18 52.6 56.6Provision for liabilities and charges 19 74.4 39.2Total long-term liabilities 700.3 944.6Current liabilities 20Interest-bearing short-term liabilities 98.2 173.5Interest-free short-term liabilities 460.2 501.9Total current liabilities 558.4 675.4Total liabilities 1,258.7 1,620.0Total liabilities and shareholders’ equity 2,399.0 2,602.919
Consolidated cash flow statement<strong>2000</strong> 1999EUR million EUR millionFunds from operationsOperating income 174.8 111.0Adjustments to operating income 1 ) –1.4 –6.5Depreciation 171.3 188.1Interest income 15.5 6.4Interest expense –47.6 –56.2Dividend received 2.0 4.2Other financing items –8.3 0.1Taxes –72.5 –31.5Total funds from operations 233.8 215.6Change in net working capitalInventories 15.6 –26.7Short-term receivables –45.3 –83.5Interest-free short-term liabilities 9.8 75.5Change in net working capital, total –19.9 –34.7Cash flow from operations 213.9 180.9Capital expenditureAcquisitions of Group companies –5.9 –4.1Acquisitions of associated companies –17.1 –Purchase of other shares –12.1 –9.9Purchase of other fixed assets –183.2 –154.1Disposal of Group companies 513.8 –Disposal of associated companies – –Sales of other shares 0.1 0.3Sales of other fixed assets 13.3 18.2Total capital expenditure 308.9 –149.6Cash flow before financing 522.8 31.3FinancingChange in long-term loans (increase +, decrease -) –223.2 18.6Change in long-term loan receivables (increase -, decrease +) –37.0 0.6Short-term financing, net (increase +, decrease -) –53.1 –20.2Dividend paid –29.4 –36.8Own shares –23.0 –Other 1.2 –0.6Financing, total –364.5 –38.4Increase / decrease in liquid funds 158.3 –7.1Liquid funds at end of year 246.7 88.4Liquid funds at beginning of year 88.4 95.5Increase / decrease in liquid funds 158.3 –7.1The above figures cannot be directly delivered from the balance sheets owing to changes, e.g., in the Groupstructure and foreign exchange rates.The cash flows of the business areas are shown with the segment data.1)Non-cash flow items included in operating income (e.g. results of associated companies) and gains and losses on thesale of fixed assets.20
Statement of changes in equityEUR millionShare capitalShare premiumfundRevaluationand other fundsExchangedifferencesOwn sharesRetainedearningsTotalShareholders’ equityat 1 January 1999 216.6 252.9 12.3 –36.9 – 491.0 935.9Change in accounting principles 1) – – – – – 18.6 18.6Net profit for the financial year – – – – – 29.9 29.9Dividends paid – – – – – –36.8 –36.8Exchange differences – – – 26.6 – – 26.6Repurchase of own shares – – – – –5.8 – –5.8Other changes – – 0.2 – – –0.9 -0.7Transfers 0.4 –0.4 – – – – –Shareholder’s equity at 31 Dec. 1999 217.0 252.5 12.5 –10.3 –5.8 501.8 967.7Shareholders’ equityat 1 January <strong>2000</strong> 217.0 252.5 12.5 –10.3 –5.8 501.8 967.7Change in accounting principles – – – – – – –Net profit for the financial year – – – – – 207.8 207.8Dividends paid – – – – – –29.4 –29.4Exchange differences – – – –1.4 – – –1.4Repurchase of own shares – – – – –23.0 – –23.0Other changes – – –1.9 – – 2.5 0.6Transfers – – – – – – –Shareholders’ equity at 31 Dec. <strong>2000</strong> 217.0 252.5 10.6 –11.7 –28.8 682.7 1,122.31)The change in the accounting principles in 1999 includes a charge of EUR 18.6 million after taxes for a change in the accounting policy for majormaintenance works (IAS 37). The change in the accounting policy for maintenance works, after tax, in 1999 was a charge of EUR -0.1 million.The Group’s non-restricted shareholders’ equity, which limits the parent company’s dividend payout, was EUR 507.8 million in<strong>2000</strong> and EUR 351.4 million in 1999. This figure is obtained by adding to retained earnings the net income for the financial yearand subtracting from it the proportion of voluntary untaxed reserves which has been transferred to shareholders’ equity and ownshares. Research, establishment and development expenses that have a limiting effect on the distribution of profits have not beencapitalized in the balance sheet.Details of the company’s breakdown of shareholders’ equity and the regulations of the Articles of Association are given on page13. In <strong>2000</strong> the company purchased 4,155,000 of its own shares, which represent 3.2% of the aggregate votes conferred by all theshares and 3.2% of the share capital. By 31.12.<strong>2000</strong> the company had totally 5,155,000 shares in its possession, which represent4.0% of the aggregate votes conferred and 4.0% of the share capital.21
Summary of significant accounting policiesBasis of presentationThe <strong>Kemira</strong> Group’s financial statements have been prepared incompliance with the relevant acts and regulations in force in Finlandand in accordance with the Group’s uniform accountingprinciples. The Group’s accounting principles are based on InternationalAccounting Standards (IAS). Accordingly, the financialstatements also correspond to IAS, with the exception of accountingfor pension expenses, IAS 19, which entered into force on 1January 1999. Its effects on the consolidated income statementand shareholders’ equity are discussed and presented in Notes 23and 24 to the consolidated financial statements.Principles of consolidationThe consolidated financial statements include the accounts of theparent company, <strong>Kemira</strong> Oyj, and companies in which it owns, directlyor indirectly through subsidiaries, over 50 percent of the votingrights. Certain real estate and housing companies, and captiveinsurance companies, as well as companies that had no operationsduring the financial year, have not been consolidated. However,the effect of these companies on the Group’s results and distributablereserves, in cases of any significance, has been consolidatedusing the equity method of accounting. Companies acquired duringthe accounting period are consolidated from the date the responsibilityfor their operations was transferred to the Group. Similarly,units or companies sold during the fiscal year are included inthe income statement up to the date of disposition.All intra-Group transactions have been eliminated as part of theconsolidation process. Acquisitions of companies are accounted forunder the purchase (past-equity) method of accounting. The excessof the acquisition cost over fair value of the net assets acquiredis partly allocated to the identifiable assets and liabilities.Any excess is recorded as goodwill. Goodwill is amortized overthe useful life of the assets acquired, which has as a rule been amaximum of 5 years. Should a longer amortization period be justified,it is a maximum of 20 years. The interests of minority shareholdersin the net assets and profit and loss of consolidated subsidiariesis reflected as a separate item in the Group’s consolidatedbalance sheet and income statement.Derivative financial instruments to hedge currency and interestrate risks have been recorded in the income statement simultaneouslywith the commitment hedged. Derivative financial instruments,which are not considered as hedging instruments, are valuedin the financial statements at the market price in accordancewith conservative accounting practice. The interest portion ofcurrency forwards is recorded as interest income and expenseover the terms of the contract, and the differences in the foreignexchange rates are booked as a credit or charged to incomewhen the underlying hedged transaction has been credited orcharged to income in the financial statements.In the consolidated financial statements, the income statements offoreign subsidiaries have been translated into euro amounts usingthe average exchange rates and the balance sheets have beentranslated using the year-end exchange rates. The translation difference,which arises in translating the income statement and balancesheet using the different exchange rates, is entered in nonrestrictedequity.The Group seeks to hedge the translation risk of its investment inthe net assets of foreign subsidiaries. Accordingly, the foreign currency-denominatedshareholders’ equity in the subsidiaries ishedged against exchange rate changes using long-term foreign currency-denominatedloans as well as forward and currency swapcontracts. In the consolidated financial statements, the exchangerate gains and losses of such loans and forward and currency swapcontracts are credited or charged against the translation differencesarising from the translation of the shareholders’ equity amounts ofthe last confirmed balance sheets of the subsidiaries. Other translationdifferences affecting shareholders’ equity are stated as an increaseor decrease in the non-restricted shareholders’ equity.Management of financial risks is discussed in greater detail in theNotes to the financial statements. The notes furthermore presenta discussion of compliance with the rules of IAS 39, which governthe recording in the accounts of financial instruments and enteredinto force as from 1 January 2001. The foreign exchangerates on the balance sheet date are given on page 17.Pension arrangementsCompanies in which the Group has a participating interest are associatedcompanies, in which the interest is 20-50%. Holdings inassociated companies are presented in the consolidated financialstatements using the equity method of accounting. The Group’sproportionate share of the associated companies’ net income forthe financial year is a separate item in the consolidated incomestatement. Joint ventures that are owned on a fifty-fifty basis withanother shareholder and in which the voting rights and managementresponsibility are divided evenly between the shareholdershave been consolidated according to the proportionate method ofaccounting. Other companies (voting rights owned less than 20percent) are stated at cost in the balance sheet and dividends receivedare included in the income statement.Items denominated in foreign currency, and foreigncurrency and interest rate derivativesIn day-to-day accounting of each Group company, transactions inforeign currencies are translated at the rates of exchange prevailingon the dates of the transactions. At the end of the accountingperiod the unsettled balances of foreign currency transactions arevalued at the rates of exchange prevailing on the balance sheetdate. Foreign exchange gains and losses related to normal businessoperations are treated as adjustments to sales and purchases,while those gains and losses associated with financing and hedgingof the total foreign exchange position are recorded as financingincome and expenses.The Group has various pension schemes in accordance with thelocal conditions and practices in the countries in which it operates.The schemes are generally funded through payments to separatefunds or to insurance companies. Contributions are basedon periodic actuarial calculations and are charged against profits.The parent company’s pension arrangements have been handledwithin the separate pension funds. The uncovered liabilities ofpension funds are presented in the parent company’s financialstatements in short-term interest-free receivables and in shortterminterest-free liabilities.In <strong>2000</strong>, IAS 19 was not applied, but the effect of applying thestandard on the Group’s net income and retained earnings hasbeen calculated and stated in Notes. The liability resulting fromthe changeover to applying IAS 19, which came into force in1999, has been calculated at the Group level such that the accumulatedentitlement has been periodized over the time of theemployment according to the accrual rules for pension arrangements(Projected Unit Credit method). The pension calculationsare based on studies carried out by actuaries.Net salesNet sales include the total invoicing value of products sold andservices provided less sales tax, discounts, rebates and foreignexchange differences in accounts receivable.22
Direct taxesThe consolidated financial statements include direct taxes, whichare based on the taxable results of the Group companies for theaccounting period calculated according to local tax rules, and thechange in the deferred tax liabilities and assets.The Group’s deferred tax liabilities and assets have been calculatedaccording to IAS 12 which came into force from the beginning of1998 and which is allowed by the Finnish legislation. The deferredtax liability has been calculated for all significant temporary differences,which have been obtained by comparing the book value ofeach balance sheet item and the taxation value. Deferred tax assetsare included in the financial statements only if the company considersthat the temporary difference or tax loss will probably be realizedin the near future and that the taxable unit will probablygenerate a sufficient amount of taxable income in order to be ableto make use of the tax claim. Tax assets on confirmed losses havebeen stated observing particular caution. In calculating the deferredtax liability, the tax base in force at the time of preparingthe financial statements has been applied.The tax charged in the income statement of the parent companycomprises direct taxes calculated on an accrual basis. The untaxedreserves of the parent company are shown as a separateitem. Provision for deferred tax liability for the untaxed reserveshas not been made in the balance sheet of the parent company.Research and development expenditureResearch expenditure is expensed. Development expenditure isalso expensed except for major projects for which investment decisionshave been made. These are capitalized. Capitalized developmentcosts are presented in the item “Other long-term expenditures”and amortized over their economic life, not exceeding,however, five years.Fixed assets and depreciationNon-current (fixed) assets are generally stated at cost, except forcertain land and water areas and buildings, which are stated atrevalued amounts, less accumulated depreciation, as applicable.Depreciation is calculated on a straight-line basis so as to writeoff carrying value of fixed assets over their expected useful lives.The depreciation periods adopted are as follows:Machinery and equipmentBuildings and constructionsOther capitalized expensesGoodwill on consolidation3–15 years25 years5–10 years5–20 yearsAs a general rule, interest expense is not capitalized. However,interest expenses related to capital borrowed to finance majorcapital investment projects can, when specifically approved bythe Board, be capitalized as part of the total investment costs.Gains and losses on the sale of fixed assets are included either inincome and expenses of operations with the exception of gainsand losses on discontinuing operations. They are presented as aseparate item. In recent years, new revaluations have not beenmade within the Group.Large, seldom performed maintenance worksLarge, seldomperformed maintenance works are treated as a capitalexpenditure as from 1999 and acquisition costs are depreciatedover their useful lifetimes (IAS 37). Previously, provisions forexpenses were booked for them in advance. The effect of thechange on net income and shareholders’ equity is stated in thestatement of changes in equity.LeasingLeasing payments are treated as rental expenses except for financeleasing agreements, in which the leased property is presentedas part of the Group’s fixed assets and the leasing debt isshown as a long-term liability. In respect of finance leasingagreements, the depreciation on the leased property and the interestexpense on the debt are shown in the income statement insteadof leasing rents.InventoriesInventories are stated at the lower of cost or net realizable value.Cost is determined on a first in first out (FIFO) basis. Net realizablevalue is the amount, which can be realized from the sale ofthe asset in the normal course of business, after allowing for thecosts of realization. The cost of finished goods and work in processinclude an allocable proportion of production overheads.Securities and other short-term investmentsSecurities and other short-term investments are a part of the Group’scash management and are stated at lower of cost or market.Discontinuing operationsBusinesses to be discontinued include those major businesseswhich according to the strategy decided in the autumn 1999 haveeither been divested or wound up, or a decision has been taken towind them up. These are <strong>Kemira</strong> Pigments Inc. in Savannah, USA,and <strong>Kemira</strong> Pigments B.V. in the Netherlands, as well as Tikkurila’sCPS unit, i.e. the colour processing systems business. The <strong>Kemira</strong>Pigments companies were sold in the spring <strong>2000</strong> and the CPSbusiness in the late summer <strong>2000</strong>. Businesses to be discontinuedalso include <strong>Kemira</strong> Agro Rozenburg. A decision was taken towind up its operations, and production was closed in December<strong>2000</strong>. Rozenburg’s operations are part of <strong>Kemira</strong> Agro’s nitrogenbusiness, which is to be divested in line with the strategy adopted.The final solution involves the disposal of the remainder of the nitrogenbusiness and, because the alternatives are currently beingstudied, the remaining nitrogen business is still included in continuingoperations.The income statement and cash flow statements are presented separatelyfor continuing operations and the above-mentioned businesseswhich are to be discontinued, presenting the figures forboth the current year and the comparison year. The businessesdivested in <strong>2000</strong> are not included in the balance sheet at the endof the year. In respect of the comparison year, their impact onthe 1999 balance sheet is discussed in the Notes to the financialstatements and the exact dates of the divestments are given.Non-recurring items for discontinuing operationsIn the consolidated income statement, the capital gains and lossesresulting from the above-mentioned discontinued major businessesare stated as a separate item before taxes and minority interests.Extraordinary income and expensesThere were no extraordinary items in the income statement. Extraordinaryitems of the parent company include Group contributionsreceived and paid.23
Notes to consolidated financial statementsINCOME STATEMENT (EUR million) <strong>2000</strong> 19991. NET SALESNet sales by division<strong>Kemira</strong> Chemicals 766.9 697.0Tikkurila 345.3 357.5<strong>Kemira</strong> Agro 1,115.5 1,014.7<strong>Kemira</strong> Pigments 306.8 488.5Other operations 76.6 84.5Intra-Group invoicing –125.1 –116.0Total 2,486.0 2,526.2Distribution of net sales by geographic market areas, as a percentage of total net salesFinland 19 18Other European Union countries 55 52Other European countries 10 8North and South America 8 13Asia 6 7Other countries 2 2Total 100 1002. SHARE OF ASSOCIATES’ NET INCOMEShare of associates’ profits 4.8 4.9Share of associates’ losses –5.3 –2.1Total –0.5 2.83. OTHER INCOME FROM OPERATIONSGains on the sale of fixed assets 17.5 14.1Sales of scrap and waste 0.5 0.5Insurance compensation 2.8 10.1Income from royalties, knowhow and licences 0.7 0.5Rent income 3.7 3.0Other income 5.7 4.4Total 30.9 32.6Gains on the sale of the fixed assets in <strong>2000</strong> include a capital gain of EUR 12 million on the sale of<strong>Kemira</strong> Safety Oy and a gain of EUR 9.2 million on the sale of shares in electric power utilities in1999.4. COST OF SALESChange in inventories of finished goods 17.6 –6.1Own work capitalized 1) –6.6 –6.6Materials and servicesMaterials and suppliesPurchases during the financial year 1,059.5 1,075.9Change in inventories of materials and supplies –9.4 1.1External services 64.5 85.7Total materials and services 1,114.6 1,162.7Personnel expenses 421.6 456.6Rents 24.4 34.3Losses on the sales of fixed assets 0.7 0.3Other expenses 598.0 621.3Total 2,170.3 2,262.5In <strong>2000</strong> costs included an increase in long-term provisions for liabilities and charges in a totalamount of EUR 35.2 million (a reduction of EUR 4.8 million in 1999)1)Own work capitalized comprises mainly wages, salaries and other personnel expenses and changes ininventoriesrelating to self-constructed fixed assets for own use.24
NOTES TO CONSOLIDATED FINANCIAL STATEMENTSINCOME STATEMENT (EUR million) <strong>2000</strong> 19995. PERSONNEL EXPENSES AND NUMBER OF PERSONNELEmoluments of the Supervisory Board 0.1 0.1Emoluments of boards of directors and managing directors 1) 7.8 8.3Other wages and salaries 316.7 344.7Pension expenses 38.1 40.6Other personnel expenses 58.9 62.9Total 421.6 456.61)Profit sharing bonuses to the management were EUR 0.2 million in <strong>2000</strong> and EUR 0.5million in 1999.The non-executive members of the Board of Directors are paid a monthly emolument; other compensationis not paid to the members of the Board. Persons belonging to the Company’s management,including parties closely associated with them, are not involved in substantial business relationshipswith the Company.Management’s pension commitmentsThe managing director and deputy managing directors of <strong>Kemira</strong> Oyj are entitled to retire at the ageof 60. This possibility is based on the benefits of the supplementary pension foundation that hasbeen closed to new members since 1 January 1991. The supplementary pension foundation’s benefitsconcern all the personnel whose years of service and other conditions concerning the grantingof a pension have been fulfilled. Similar arrangements have been made in the other Group companies.Personnel, average<strong>Kemira</strong> Chemicals 3,210 3,138Tikkurila 2,049 2,301<strong>Kemira</strong> Agro 2,833 2,951<strong>Kemira</strong> Pigments 1,084 1,752Other companies 468 601Total 9,644 10,743Personnel in Finland, average 4,908 5,090Personnel outside Finland, average 4,736 5,653Total 9,644 10,743The total personnel of joint ventures that have been consolidated according to the proportionatemethod of accounting was in average 134 (279 in 1999).Personnel at year end 8,865 10,4366. DEPRECIATIONScheduled depreciationIntangible assetsIntangible rights 2.3 2.0Goodwill 1.9 1.2Goodwill on consolidation 3.8 4.5Other long-term expenditures 7.6 6.1Tangible assetsBuildings and constructions 24.7 23.5Machinery and equipment 125.4 145.5Other tangible assets 5.6 5.3Total 171.3 188.1Scheduled depreciation for goodwill on consolidation was EUR 3.8 million (EUR 4.5 million in 1999).No reductions have been made in the Group reserve in <strong>2000</strong> and 1999.7. FINANCING INCOME AND EXPENSESFinancing incomeDividend income 0.6 0.7Interest income from long-term investments 1.3 1.1Other interest income 14.2 5.3Other financing income 1.0 0.5Exchange gains 1.5 –Total 18.6 7.625
NOTES TO CONSOLIDATED FINANCIAL STATEMENTSINCOME STATEMENT (EUR million) <strong>2000</strong> 1999Financing expensesInterest expenses –47.5 –56.2Other financing expenses –1.6 –2.2Exchange losses – –1.6Total –49.1 –60.0Total financing income and expenses –30.5 –52.4Net financing expenses as a percentage of net sales 1.2 2.1Net interests as a percentage of net sales 1.3 2.0Exchange gains and lossesRealized –8.4 1.8Unrealized 9.9 –3.4Total 1.5 –1.6Interest expenses were not capitalized during <strong>2000</strong> or 1999.The exchange differences on foreign currency loans and foreign currency derivatives have been creditedor charged directly to shareholders’ equity and matched against the translation differences arisingfrom the consolidation of foreign subsidiaries according to the so called equity hedging method.In <strong>2000</strong> these foreign exchange gains totalled EUR 0.3 million (in 1999 foreign exchange losses wereEUR 11.4 million).There were no financing income and expenses from associates.8. DISCONTINUING OPERATIONSProfit on sales 244.7 –Shut-down costs –82.5 –Total 162.2 –9. DIRECT TAXESDirect taxes, current year –113.5 –30.9Direct taxes, previous years –6.2 –0.5Deferred taxes 24.4 3.6Other taxes –1.0 –Total –96.3 –27.8Taxes on capital gains on discontinuing businesses amounted to EUR 46.7 million. There were nosuch items in 1999.Certain Group subsidiaries have tax losses which can be applied against future taxable income.According to the principle of prudence, all tax losses have not been entered as deferred tax assetsbecause there is uncertainty regarding the extent to which they can be used.10. EARNINGS PER SHAREIncome before non-recurring items and taxes 144.3 58.6Minority interests –2.4 –0.9Direct taxes for the financial year –96.3 –27.8Tax on sales profit of the discontinuing operations 46.7 –Net income 92.3 29.9Weighted average number of shares 1) 126,623,000 128,318,000Earnings per share, EUR 0.73 0.231)Weighted average number of shares outstanding, adjusted by the number of shares bought back.26
NOTES TO CONSOLIDATED FINANCIAL STATEMENTSBALANCE SHEET (EUR million)11. INTANGIBLE ASSETSIntangiblerightsGoodwillGoodwill onconsolidation1)Other longtermexpendituresAcquisition cost at beginning of year 34.0 14.1 72.0 84.5 0.4 205.0 179.3Increases 4.3 20.9 8.4 3.6 3.2 40.4 21.0Decreases –10.7 –4.5 –28.0 –5.0 – –48.2 –Exchange differences and other changes –0.5 0.5 –12.2 1.3 0.0 –10.9 4.7Acquisition cost at end of year 27.1 31.0 40.2 84.4 3.6 186.3 205.0Accumulated depreciation atbeginning of year –23.8 –7.1 –49.7 –44.7 – –125.3 –110.6Accumulated depreciation relating todecreases and transfers 8.6 2.9 13.2 3.8 – 28.5 –Depreciation during the financial year –2.3 –1.9 –3.8 –7.6 – –15.6 –13.8Exchange differences and other changes 0.7 –0.3 12.7 1.7 – 14.8 –0.9Accumulated depreciation at end of year –16.8 –6.4 –27.6 –46.8 – –97.6 –125.3Net book value at end of year 10.3 24.6 12.6 37.6 3.6 88.7 79.71) There was no goodwill on consolidation related to associated companies in <strong>2000</strong> and 1999.Advancespaid<strong>2000</strong>total1999total12. TANGIBLE ASSETSAcquisition cost at beginning of year 104.3 606.1 2,496.3 92.7 64.8 3,364.2 3,215.3Increases 1.3 22.9 104.5 4.7 15.1 148.5 137.1Decreases –11.4 –62.8 –402.0 –3.3 –18.5 –498.0 –4.5Exchange differences and other changes –1.0 –12.9 –26.2 –15.1 –14.5 –69.7 16.3Acquisition cost at end of year 93.2 553.3 2,172.6 79.0 46.9 2,945.0 3,364.2Accumulated depreciationat beginning of year – –295.3 –1,687.2 –53.5 – –2,036.0 –1,907.7Accumulated depreciation relating todecreases and transfers – 19.8 237.6 2.0 – 259.4 –4.6Depreciation during the financial year – –24.7 –125.4 –5.6 – –155.7 –174.3Exchange differences and other changes – 4.9 28.7 3.2 – 36.8 50.6Accumulated depreciation at end of year – –295.3 –1,546.3 –53.9 – –1,895.5 –2,036.0Net book value at end of year 93.2 258.0 626.3 25.1 46.9 1,049.5 1,328.21)The acquisition cost and book value of land and water areas include EUR 23.3 million revaluations in <strong>2000</strong> and in 1999.2) The acquisition cost of buildings and constructions include EUR 20.1 million revaluations in <strong>2000</strong> and in 1999.The book value was EUR 7.8 million at the end of <strong>2000</strong> and EUR 8.6 million at the end of 1999.3) Non-depreciated capitalized interest expenses included in buildings were EUR 0.2 million in <strong>2000</strong> (EUR 0.5 million in 1999), in machineryand equipment EUR 0.5 million in <strong>2000</strong> (EUR 2.4 million in 1999). Interest expenses were not capitalized in <strong>2000</strong> and 1999.13. INVESTMENTSAcquisition cost at beginning of year 50.7 8.4 0.9 17.6 77.6 67.9Share of net income of associates –2.0 – – – –2.0 1.5Increases 17.1 12.1 – 35.7 64.9 10.0Decreases – –0.1 – – –0.1 –0.3Transfers –1.7 – – – –1.7 –Exchange differences and other changes –0.7 –0.8 – – –1.5 –1.7Reduction in value – – – – – 0.2Receivables from associates – – 1.1 – 1.1 –Other receivables – – – – – –Net book value at end of year 63.4 19.6 2.0 53.3 138.3 77.6Shares and holdings are specified in Note 27.Land andwaterareas 1)Buildingsand constructions2)Holdings inassociatesMachineryandequipment 3)Othershares andholdingsOther tangibleassetsReceivablesfromassociatesAdvances paidand fixedassets underconstructionOtherinvestments14. INVENTORIES <strong>2000</strong> 1999Materials and supplies 133.7 187.1Work in process 9.1 15.1Finished goods 204.3 252.3Advances paid 1.6 1.4Total 348.7 455.9<strong>2000</strong>total<strong>2000</strong>total1999total1999total27
NOTES TO CONSOLIDATED FINANCIAL STATEMENTSBALANCE SHEET (EUR million) <strong>2000</strong> 199915. RECEIVABLESLong-term receivablesInterest-bearing long-term receivablesLoan receivables from associates – –Loan receivables from others – –Other receivables from others 0.6 0.1Total interest-bearing long-term receivables 0.6 0.1Interest-free long-term receivablesPrepaid expenses and accrued income from others 0.1 4.3Accounts receivable from others 4.6 5.5Other receivables from others 0.6 0.8Total interest-free long-term receivables 5.3 10.6Total long-term receivables 5.9 10.7Current receivablesInterest-bearing short-term receivablesLoan receivables from associates 2.6 2.6Loan receivables from others 1.7 9.5Other receivables from others 6.3 11.3Total interest-bearing short-term receivables 10.6 23.4Interest-free short-term receivablesAccounts receivable from associates 8.0 4.1Accounts receivable from others 411.4 471.6Advances paid from others 14.4 2.7Prepaid expenses and accrued income from others 46.0 22.5Other receivables from associates 4.2 0.9Other receivables from others 26.6 37.2Total interest-free short-term receivables 510.6 539.0Total current receivables 521.2 562.4Total receivables 527.1 573.1Loans to the management of the Group companies 0.0 –16. APPROPRIATIONSIn the consolidated financial statements the appropriations of each individual company have beendivided into equity and deferred tax liability. Appropriations in the balance sheets of the Group companiesare accumulated depreciation difference.Of which equity 134.4 134.3Of which deferred tax liability 51.7 54.8Total accumulated depreciation difference 186.1 189.117. LONG-TERM INTEREST-BEARING LIABILITIESDebentures and other bond loans 61.7 61.7Loans from financial institutions 209.7 398.6Loans from pension institutions 254.5 296.4Other long-term liabilities to associated companies – 0.4Other long-term liabilities to others 47.4 91.7Total 573.3 848.8Long-term interest-bearing liabilities maturing in2002 (2001) 26.4 44.62003 (2002) 150.1 33.62004 (2003) 8.0 192.82005 (2004) 62.0 150.72006 (2005) or later 326.8 427.1Total 573.3 848.828
NOTES TO CONSOLIDATED FINANCIAL STATEMENTSBALANCE SHEET (EUR million) <strong>2000</strong> 1999Interest-bearing liabilities maturing in 5 years or longerLoans from financial institutions 48.8 99.7Loans from pension institutions 248.4 283.9Other long-term interest-bearing liabilities 29.6 43.5Total 326.8 427.1Long-term loans by currency, %EUR 52 35FIM – 18SEK 22 15BEF – 1USD 9 11DKK 4 5GBP 11 7Other 2 8Total 100 100The Group has no convertible bonds.Debentures and other bond loansLoanLoan currencyFI 0003008581 1998-2003 EUR 45.2 45.2FI 0003008599 1998-2006 EUR 16.5 16.5Total 61.7 61.718. DEFERRED TAX LIABILITIESDeferred tax liabilities 78.4 82.3Deferred tax assets 25.8 25.7Net deferred tax liabilities 52.6 56.6Temporary differences 3.2 9.1Untaxed reserves 51.7 54.8Consolidation entries –2.3 –7.3Total 52.6 56.6Deferred tax liabilities and tax assets have been calculated according to IAS regulations, effectivefrom 1 January 1998.The deferred tax liabilities related to untaxed reserves of the Finnish Group companies amounted toEUR 51.7 million in <strong>2000</strong> and EUR 54.8 million in 1999. The deferred tax assets are mainly tax assetsfrom tax losses, finance lease and intra-Group profits.19. PROVISION FOR LIABILITIES AND CHARGESPension liabilitiesUncovered liabilities of pension funds – 0.4Other pension liabilities 15.0 18.3Total 15.0 18.7Other provisions for liabilities and chargesProvisions for reorganization 7.8 7.0Provisions for accidents and environmental liabilities 9.8 7.5Deferred income, Tikkurila CPS 32.6 –Other provisions 9.2 6.0Total 59.4 20.5Total provision for liabilities and charges 74.4 39.2Provisions for liabilities and charges are expected to fall due in a year at the earliest. Short-term provisions(EUR 59.6 million in <strong>2000</strong> and EUR 20.8 million in 1999) are included in accrued expensesand prepaid income.29
NOTES TO CONSOLIDATED FINANCIAL STATEMENTSBALANCE SHEET (EUR million) <strong>2000</strong> 199920. CURRENT LIABILITIESInterest-bearing short-term liabilitiesLoans from financial institutions 20.7 28.6Loans from pension institutions 1.6 3.2Current portion of other long-term loans to others 18.8 19.4Bills of exchange from others 0.8 2.4Other interest-bearing short-term liabilities to associates 2.8 1.2Other interest-bearing short-term liabilities to others 53.5 118.7Total interest-bearing short-term liabilities 98.2 173.5In 1999 current portion of other long-term liabilities include a EUR 0.1 million issue of bonds withwarrants offered to senior management.Interest-free short-term liabilitiesAdvances received from others 7.7 18.5Accounts payable to associates 4.4 0.8Accounts payable to others 189.4 235.3Accrued expenses and prepaid income to others 226.8 202.3Other interest-free short-term liabilities to others 31.9 45.0Total interest-free short-term liabilities 460.2 501.9Total current liabilities 558.4 675.4Accrued expensesAccrued expenses and prepaid income in <strong>2000</strong> include mainly salaries and personnel expenses, taxesand interests.21. NET LIABILITIESInterest-bearing long-term liabilities 573.3 848.8Interest-bearing short-term liabilities 98.2 173.5Securities –199.0 –42.4Cash and bank –47.7 –46.0Total 424.8 933.922. DISCONTINUING OPERATIONSThe <strong>Kemira</strong> Pigments business and the CPS unit or the Tikkurila Group’s colour processing business,were sold because they were not core businesses. <strong>Kemira</strong> Agro’s production in Rozenburg was alsoclosed. <strong>Kemira</strong> Pigments Inc. was sold on 31 March <strong>2000</strong> and <strong>Kemira</strong> Pigments B.V. on 30 April<strong>2000</strong>. The remaining company, <strong>Kemira</strong> Pigments Oy was transferred to the <strong>Kemira</strong> Chemicals businessarea as from 1 January 2001. The portion of the tinting machine business that belonged to theCPS group was sold on 31 August <strong>2000</strong>, and the colour processing systems business was sold on 30September <strong>2000</strong>. The Board of Directors of <strong>Kemira</strong> Oyj decided to wind up <strong>Kemira</strong> Agro Rozenburg,and production was closed in December <strong>2000</strong>. The closure of production resulted in a non-recurringcharge to earnings of EUR 82.5 million.Income statementThe results of the above-mentioned companies are included in the income statement for discontinuingbusinesses up to the time they cease to be a part of the Group. The net amount of the capitalgains on divestments of the companies and the non-recurring expenses for <strong>Kemira</strong> Agro Rozenburgare stated within the income statement for discontinuing businesses.Continuing operations <strong>2000</strong> 1999Net sales 2,124.0 1,920.2Share of associates’ net income –0.5 2.7Other operating income 28.2 29.7Expenses –1,833.9 –1,698.6Depreciation –150.3 –139.5Operating income 167.5 114.5Financing income and expenses –23.4 –32.9Income before Group contribution,taxes and minority interests 144.1 81.6Group contribution –3.3 6.7Net income before taxes and minority interest 140.8 88.3Income taxes –50.7 –29.7Minority interests –1.1 –0.4Net income after taxes 89.0 58.230
NOTES TO CONSOLIDATED FINANCIAL STATEMENTSBALANCE SHEET (EUR million) <strong>2000</strong> 1999Discontinuing operationsNet sales 362.0 606.0Share of of associates’ net income – 0.1Other operating income 2.7 3.0Expenses –336.4 –563.9Depreciation –21.0 –48.7Operating income 7.3 –3.5Financing income and expenses –7.1 –19.5Income before Group contribution, non-recurring itemstaxes and minority interests 0.2 –23.0Group contribution 3.3 –6.7Income taxes 1.1 1.8Minority interests –1.3 –0.4Net income before discontinuance 3.3 –28.3Gain on discontinuance 244.7 –Provision for employee termination –22.3 –Provision for cleaning and contracts –17.7 –Impairment loss –42.5 –Tax on discontinuance –46.7 –Net income after taxes 118.8 –28.3Total Group, net income from ordinary activities 92.3 29.9Balance sheet, discontinuing operationsCarrying amount of total assets(outside Group and intra-Group) 43.7 561.6Carrying amount of total liabilities (outside Group companies)Interest-bearing liabilities 0.4 47.4Interest-free liabilities 52.2 122.8Total 52.6 170.2<strong>Kemira</strong> Agro Rozenburg’s total assets and liabilities are included in the balance sheet at 31 December<strong>2000</strong> and 31 December 1999 and the assets and liabilities of <strong>Kemira</strong> Pigments Inc., <strong>Kemira</strong> PigmentsB.V. and Tikkurila CPS Group are given in the balance sheet at 31 December 1999.Cash flow from discontinuing operationsCash flow from operations – 34.9Capital expenditure –16.7 –36.3Sale of assets 493.9 0.3Cash flow before financing 477.2 –1.1Financing –480.2 3.6Increase / decrease in liquid funds –3.0 2.523. PENSION LIABILITIES ACCORDING TO IAS 19Present value of funded obligations at end of period 754.7 760.9Fair value of plan assets at end of period –877.5 –861.5Unrecorded actuarial gains and losses 124.9 120.1Liability in the balance sheet at end of period 2.1 19.5Change in the net liability is the following:Current service cost 2.0 10.6Interest on obligation 44.6 44.4Expected return on plan assets –51.5 –40.9Other –4.6 2.7Total –9.5 16.8Contributions included in net income 6.3 6.9Impact on net income if IAS 19 had been applied 15.8 –9.9The calculations make use of 10% corridors for unrecorded actuarial costs which have an impact onearnings. The corridor is the higher of the following: 10% of the present value of the obligation or10% of the fair value of the assets. The figures for 1999 have been adjusted to reflect this treatment.31
NOTES TO CONSOLIDATED FINANCIAL STATEMENTSBALANCE SHEET (EUR million) <strong>2000</strong> 199924. THE FINANCIAL IMPACT OF IAS 19If IAS 19 had been applied in the consolidated financial statements and the increase in liabilities resultingfrom the changeover had been entered in its entirety in the income statement, earnings for1999 would have been EUR 9.9 million smaller and shareholders’ equity at 31 December 1999 wouldhave been EUR 19.5 million smaller. Net income in <strong>2000</strong> would have been EUR 15.8 million greaterand shareholders’ equity at 31 December <strong>2000</strong> would have been EUR 2.1 million smaller than in thefinancial statements submitted.25. COLLATERAL AND CONTINGENT LIABILITIESLoans secured by mortgages in the balance sheet andfor which mortgages given as collateralLoans from financial institutions 4.0 10.0Mortgages given 2.3 9.9Loans from pension institutions 74.3 89.1Mortgages given 103.0 110.9Other loans 7.1 6.6Mortgages given 5.6 6.9Total mortgage loans 85.4 105,7Total mortgages given 110.9 127.7Contingent liabilitiesAssets pledgedOn behalf of own commitments 13.5 7.0On behalf of others 1.1 1.1GuaranteesOn behalf of associates 36.0 39.7On behalf of others 2.7 4.2Operating leasingMaturity within one year 4.8 5.1Maturity after one year 12.6 13.8Other obligationsOn behalf of associates 1.3 1.2On behalf of others 1.1 1.0In liabilities for <strong>2000</strong> there are EUR 45.1 million of debts related to finance lease.In 1999 the finance lease included in debts amounted to EUR 55.5 million.There were no collaterals or contingent liabilities related to managing directors, members ordeputy members of boards of directors and the supervisory board.LitigationThe Group has extensive international operations and is a defendant or plaintiff in a number of proceedingsincidental to those operations. The Group does not expect the outcome of any legal proceedingscurrently pending, either individually or in the aggregate, to have material adverse effectupon the Group’s consolidated financial position or results of operations.32
NOTES TO CONSOLIDATED FINANCIAL STATEMENTS26. MANAGEMENT OF FINANCIAL RISKSThe Group’s treasury functions are managed on acentralized basis. Group Treasury serves as an internalbank via which the subsidiaries handle alltheir borrowing, investment and hedging needs.Group Treasury also sees to the investment of liquidfunds, the management of interest rate andforeign exchange risk as well as cash pools. TheTreasury policy is approved by the company’sBoard of Directors. In addition, the Board of Directorsconfirms an action plan for Treasury eachyear. The objective of financial risk managementis to protect the company from unfavourablechanges occurring in the financial markets andthus to contribute to safeguarding the company’searnings trend and its shareholders’ equity. Thecompany employs various financial instruments,such as forward rate agreements, options and futures,within the framework of the limits whichhave been set. Only such instruments are usedwhose market values and risks can be trackedcontinually and reliably within the company’s riskmanagement system. Derivative instruments areused only for hedging, not for speculative purposes.IAS 39The Group observes the IAS accounting rules forderivative instruments, which will come into forcefrom the beginning of 2001 (IAS 39), according towhich all financial derivatives must be booked attheir market value either in the balance sheet orin the income statement.Hedging at the Group level is based primarily onnet currency flow exposure, whereby in 2001 theexchange rate differences in hedging instrumentsare entered, in accordance with IAS 39, in Grouplevelfinancial expenses and not in operating incomeas has been done up to now. This procedurewill increase the variation in Group-level foreignexchange differences and also, to some extent,consolidated operating income comparedwith the present level.The subsidiaries, however, will carry out hedgeaccounting for trading flows, booking foreign exchangedifferences to operating income in theprevious manner, whereby the operating incomefigures for the individual business areas will includethe foreign exchange differences in hedginginstruments.Currency swap agreements connected with longtermloans will be documented in accordancewith IAS requirements and, in respect of loans, exchangerate differences in these swaps will bebooked to foreign exchange differences. The exchangerate differences in hedging instruments forshareholders’ equity items will continue to bebooked to shareholders’ equity against translationdifferences in accordance with IAS 21.Foreign exchange riskThe introduction of the euro has reduced theGroup’s currency flow exposure. The bulk of theGroup’s production in the eurozone is sold in theeurozone. Currency flow risk nevertheless arisesfrom the net currency flows denominated in currenciesother than the reporting currency both inthe eurozone and outside the euro area. At theGroup level, the largest foreign exchange risks in2001 have been estimated to be as follows:- USD surplus EUR 120 million- SEK surplus EUR 15 million- PLN surplus EUR 15 million- and GBP deficit EUR 20 millionwhich comprise a total of more than 80% of the entireEUR 200 million currency flow risk from commercialactivities at the annual level. At the turn ofthe year, 70% of these risks was hedged. Furthermore,currency risk arises on the translation into eurosof the net income and balance sheet items ofcompanies outside the eurozone.Currency flow exposure is hedged selectively insuch a way that already assured foreign currencyflows are hedged completely. Forecast cash flowsare partly hedged. The hedged part is larger whenthe likelihood grows that the forecasted transactionwill materialize. The basic guideline is that a minimumof 30% of the foreign currency flow that isforecast for the next 12 months must be hedged.Each subsidiary is separately responsible for takingits own hedging decisions. The hedging undertakenby the subsidiaries is supplemented, according tothe Group’s needs, by means of Group-level hedgingmeasures that are carried out by Group Treasurysuch that as a rule 50% of the forecast net currencyflow for 12 months is hedged. Group Treasury candiverge from this 50% level by +/- EUR 100 million.Nevertheless, a minimum of 30% and a maximum of100% of the forecast flow must always be hedged.Use of the limits is tracked daily. At the monthly levelan average of about EUR 7 million of this type oflimit was in use. In <strong>2000</strong> the total volume of all externalforeign exchange contracts and options wasabout EUR 6,600 million. This figure includes transactionsmade both on behalf of subsidiaries and atthe Group level.The Group strives to hedge translation risk by keepingforeign currency-denominated liabilities in balance,currency by currency, with the asset items inthe balance sheet. The foreign currency-denominatedshareholders’ equity items of subsidiaries arehedged against foreign exchange fluctuations in accordancewith the so-called equity hedging methodby means of long-term foreign currency-denominatedloans as well as by forward rate agreements andcurrency swaps. Because euro interest rates areclearly lower than, say, the interest rates for the USdollar and the British pound, balance sheet hedgingby means of foreign currency loans results in a substantialcost, which is taken into account when takingdecisions regarding hedging. In hedging balancesheet risk, the equity ratio is monitored such that ifa change of +/- 5.0% in the foreign exchange ratescauses a change of more than 1.5 percentage pointsin the equity ratio, hedging measures have to be undertaken.In practice this means that in the balancesheet the value of the unhedged shareholders’ equityin <strong>2000</strong> could be a maximum of EUR 375 million,of which limit EUR 344 million was in use at theturn of the year. The largest unhedged positions arein the Swedish krona and the British pound.Interest rate riskIn accordance with the Group’s risk managementpolicy, the objective is to hedge against significantinterest rate risks. In order to manage interest raterisks, the Group’s borrowing and investments arespread out between fixed and variable interest rateinstruments. In addition, interest rate swaps and forwardrate agreements are used actively, as are otherderivatives. At the end of <strong>2000</strong>, 51% of the Group’sentire loan portfolio consisted of fixed-interest borrowings.Pension loans are considered to be floatingrate loans. Treasury Management also monitorsthe duration of the loan portfolio as well as itssensitivity to changes in the interest rate curve. Theaverage duration of the entire loan portfolio at theend of <strong>2000</strong> was about 24 months, whereas the durationfor pension loans has been set at one year. In2001 the duration of the loan portfolio can vary in arange of 6-24 months. In 2001 a change of one per-33
NOTES TO CONSOLIDATED FINANCIAL STATEMENTScentage point in the interest rate curve is allowed tocause a maximum change of EUR 15 million in themarket value of the asset/liability portfolio. Limitscan be changed through a decision of the Board ofDirectors in accordance with the market situation. Asa consequence of this policy, the Group’s averageinterest rate level in general has been higher thanthe market level of short-term interest rates whenlow rates prevail and, on the other hand, lower thanthe market level when high rates prevail.Counterparty riskCounterparty risk is due to the fact that a contractualparty to a financing transaction is not necessarilyable to fulfil its obligations under the agreement.Counterparty risks in treasury operations are mainlyconnected with investing funds and with the counterpartyrisks of derivative contracts. The Group acceptsas its counterparty only financial institutionsthat have a good credit rating. At present there aremore than 20 approved counterparties. A counterpartythat has received a credit rating below the A levelor an unrated counterparty must have a separate approval.At present this condition applies only to afew counterparties. Before being accepted as a counterparty,the financial institution must go through aspecial approval process. In addition, Group Treasuryapproves the new banking relationships of subsidiaries.Counterparty risk is monitored on a monthlybasis by defining from the market values of receivablesthe maximum risk associated with eachcounterparty. For each financial institution, there isan approved limit.As a consequence of the high liquidity arising from divestments,during <strong>2000</strong> the company’s Board of Directorsincreased the limits for investing in short-termcommercial paper to a total maximum of EUR 200 million,spread among 45 different companies. At the turnof the year, 46% of the limit was in use, i.e. EUR 92 million.During the financial year credit losses were not incurredin treasury operations.Funding riskThe Group diversifies its funding risk by obtainingfinancing from different sources in different markets.The Group has bank loans, pension loans, insurancecompany loans, a Medium Term Note Programmeas well as short-term domestic and foreigncommercial paper programmes. The objective is tobalance the maturity schedule of the bond and loanportfolio and to maintain a sufficiently long maturityfor long-term loans. The average maturity of longtermloans (not including pension loans) was 3.0years at the turn of the year, and in 2003, 26% ofthem will fall due, i.e. a total of EUR 150 million.The Group’s solvency and funding arrangementsare safeguarded by maintaining good liquidity andby means of revolving credit facilities. The Grouphas a commercial paper programme providing forthe raising of a maximum of EUR 150 million aswell as a Euro Commercial Paper (ECP) programme,within which a maximum of USD 200 millioncan be raised. The ECP programme was usedto a very minor extent in <strong>2000</strong>. At the end of theyear no commercial paper programmes were in use.Due to divestments, the Group’s average liquidityin <strong>2000</strong> was an exceptionally high EUR 206 million.At the end of <strong>2000</strong>, liquidity amounted toEUR 247 million as well as an unused revolvingcredit facility of about EUR 422 million, for a totalof EUR 669 million. Liquidity management is developedby continually improving the efficiency ofthe cash pool arrangement. The euro cash poolthat was introduced during <strong>2000</strong> will in future facilitatethe management of the Group’s liquidfunds considerably. Plans call for expanding furtherthe euro cash pool stage by stage during2001, notably, to Austria and Spain.Documentation riskThe Group’s documentation risk for financingagreements is managed by concentrating the approvalof financing agreements within Group Treasuryas well as by using standardized agreements.Financial instruments 31.12.<strong>2000</strong> 31.12.1999Nominal Fair Nominal Fairvalue value value valueCurrency instrumentsForward contracts 417.6 10.5 318.9 1.9Of which for hedging of future currency flows 21.2 1.3 47.7 3.2Currency optionsBought 208.0 1.1 5.8 0,1Sold 257.2 0.1 11.6 –0.5Currency swaps 95.1 –9.8 183.2 –9.9Interest rate instrumentsInterest rate swaps 220.9 –3.3 173.9 –3.6Forward rate agreements 10.0 – 290.0 –Of which open – – – –Bond futures 6.0 – 2.0 –Of which open 2.0 – – –Nominal values of the financial instruments do not necessarily correspond with the actual cash flowsbetween the counterparties and do not therefore give a fair view of the risk position of the Group.Fair values are based on market valuation on the date of reporting for the instruments which are publicly traded.Other instruments have been valued based on net present values of future cash flows. A valuation modelhas been used to estimate the fair values of options.34
NOTES TO CONSOLIDATED FINANCIAL STATEMENTS27. SHARES AND HOLDINGS OF GROUP COMPANIESHolding%Associated companies 1)A/S Ammonia Fredericia Denmark 33.3Alufluor AB Helsingborg Sweden 50.0Aluminium Sulphate Co. of Egypt, S.A.E. Cairo Egypt 26.1Biolchim Tunisie Carthage Tunis 25.0CPS Color Group Oy Vantaa Finland 28.4DA Kemikaalide AS Tallinn Estonia 40.0Farmit Website Oy Helsinki Finland 33.3Indkoebsselskabet for Kali I/S Fredericia Denmark 50.0Kemax B.V. Rozenburg Netherlands 50.0<strong>Kemira</strong> Arab Potash Company Amman Jordan 48.0<strong>Kemira</strong> Compound Fertiliser (Zhanjiang) Co. Ltd. Zhanjiang China 49.0<strong>Kemira</strong> Emirates Fertilizer Company (Kefco) Dubai United Arab Emirates 39.8<strong>Kemira</strong> Kuok Fertilizer Sdn. Bhd. Kuala Lumpur Malaysia 30.0<strong>Kemira</strong> Thai Co. Ltd Bangkok Thailand 49.5<strong>Kemira</strong> Trading Oy Helsinki Finland 100.0<strong>Kemira</strong>-Ube Ltd Tokyo Japan 50.0Kemwater Phil., Corp. Manila Philippines 40.0KK Animal Nutrition (Pty) Ltd. Durban South Africa 50.0Movere Oy Lahti Finland 40.0Oy Polargas Ab Oulu Finland 30.0PK Düngerhandelsgesellschaft m.b.H. Hannover Germany 50.0Seco S.A. Ribécourt France 49.9S.E.M. <strong>Kemira</strong> Algérie S.P.A. Alger 40.0Superstar Fertilizers Co. Ltd Bangkok Thailand 40.0Spruce Vakuutus Oy Helsinki Finland 100.0Swedish Water Corporation AB Stockholm Sweden 20.0Union <strong>Kemira</strong> Co. Abu Dhabi United Arab Emirates 49.0Varteko Valduse AS Pärnu Estonia 44.81)Including such wholly owned companies that have been consolidated according to the equity method.Real estate and housing companies are included in other shares.Other shares and holdingsForcit Oy Finland 15.4Suomen Rehu Oy Finland 19.9Kemiron Companies Inc. United States 15.028. SEGMENT DATAIn <strong>2000</strong> the Group was organized into the following main business areas: <strong>Kemira</strong> Chemicals, Tikkurila,<strong>Kemira</strong> Agro and <strong>Kemira</strong> Pigments.Intra-Group transfer prices are based primarily on market prices. In some cases, for example, wheremarketing companies are involved, cost-based prices are used, thereby including the margin (so-calledcost plus method).The assets and liabilities of businesses comprise assets and liabilities which can be allocated, directlyor justifiably, to the businesses in question. The assets of the business segments include tangible andintangible assets, interest in associated companies, inventories and interest-free receivables. Shortterminterest-free liabilities are included in the liabilities of the business segments.35
NOTES TO CONSOLIDATED FINANCIAL STATEMENTSSegment data (EUR million)<strong>2000</strong> Chemicals Tikkurila Agro Pigments Other GroupIncome statementExternal net sales 700.3 345.3 1,098.0 293.8 48.6 2,486.0Intra-Group sales 66.6 0.0 17.5 13.0 –97.1 –Net sales, total 766.9 345.3 1,115.5 306.8 –48.5 2,486.0Share of associates’ net income 2.6 – –0.9 – –2.2 –0.5Operating income 69.4 27.1 22.9 53.8 1.6 174.8Other informationAssets of businesses 815.1 178.4 756.0 224.0 92.6 2,066.1of which holdings in associated companies 28.4 – 24.3 0.7 10.0 63.4Unallocated assets 332.9Consolidated assets, total 2,399.0Liabilities of businesses 122.2 71.5 233.6 47.1 –14.2 460.2Unallocated liabilities 798.5Consolidated liabilities, total 1,258.7Capital expenditure 100.1 13.1 65.7 27.1 12.3 218.3Depreciation 60.3 16.8 63.9 27.0 3.3 171.3Cash flowsOperations 107.8 71.2 29.8 79.3 –74.2 213.9Net capital expenditure –99.2 115.6 –57.6 358.9 –8.8 308.9Financing –2.7 –193.6 41.6 –442.7 232.9 –364.51999 Chemicals Tikkurila Agro Pigments Other GroupIncome statementExternal net sales 629.4 357.3 1,000.4 477.7 61.4 2,526.2Intra-Group sales 67.6 0.2 14.3 10.8 –92.9 –Net sales, total 697.0 357.5 1,014.7 488.5 –31.5 2,526.2Share of associates’ net income 2.9 – –0.5 – 0.4 2.8Operating income 83.2 23.1 –38.8 34.9 8.6 111.0Other informationAssets of businesses 777.2 297.5 792.5 538.4 58.5 2,464.1of which holdings in associated companies 29.3 – 16.5 0.6 4.3 50.7Unallocated assets 138.8Consolidated assets, total 2,602.9Liabilities of businesses 112.1 59.1 231.4 93.0 6.0 501.6Unallocated liabilities 1,118.4Consolidated liabilities, total 1,620.0Capital expenditure 48.9 22.6 47.4 46.2 3.0 168.1Depreciation 56.0 18.1 64.2 46.2 3.6 188.1Cash flowsOperations 75.0 27.5 36.5 55.1 –13.2 180.9Capital expenditure –48.5 –20.5 –46.3 –46.2 11.9 –149.6Financing –14.5 –5.8 3.7 –1.4 –20.4 –38.436
NOTES TO CONSOLIDATED FINANCIAL STATEMENTSGeographical segment (EUR million)<strong>2000</strong> 1999Net salesFinland 461.2 453.5Other EU countries 1,378.4 1,324.5Rest of Europe 247.9 211.7North and South America 194.3 328.9Asia 163.4 167.8Other countries 40.8 39.8Total 2,486.0 2,526.2Assets (tangible and intangible fixed assets)Finland 511.5 535.5Other EU countries 496.2 603.8Rest of Europe 40.7 34.5North and South America 50.0 190.0Asia 39.8 42.4Other countries – 1.7Total 1,138.2 1,407.9Capital expenditureFinland 62.5 77.6Other EU countries 130.5 58.9Rest of Europe 14.1 9.8North and South America 10.5 20.4Asia 0.6 1.3Other countries 0.1 0.1Total 218.3 168.129. CHANGES IN GROUP STRUCTUREAcquisitions of Group companies, and new subsidiaries that have been founded• <strong>Kemira</strong> Chemicals Oy and the City of Helsinki established a company named Kemwater ServicesOy, whose line of business includes the treatment of waste water. <strong>Kemira</strong> Chemicals Oy has a 51%holding in the company and the City of Helsinki 49%.• Tikkurila Coatings Oy established in Latvia a subsidiary named SiA Tikkurila Coatings.• In Russia, <strong>Kemira</strong> Agro Oy established a wholly-owned subsidiary named <strong>Kemira</strong> Agro Russia Oy.• <strong>Kemira</strong> Metalkat established a subsidiary named Metalkat Romania S.A. in Craiova, Romania.Metalkat Oy has an 80% stake in the company.• <strong>Kemira</strong> Chemicals established a company named <strong>Kemira</strong> Chemicals Brasil Ltda.• <strong>Kemira</strong> Chemicals acquired Neste Chemicals’ paper chemicals business, which includes the paperchemicals business of the Austrian company Krems Chemie and the hydrophobic sizing businessof Oy Chemec Ab of Finland. The businesses in Austria and Germany were organized under thedirection of the existing company <strong>Kemira</strong> Chemie GmbH. New companies included in the acquisitionwere PCS Paper Chemicals Systems Vertriebsges.mbH (55%), which operates in Austria andGermany, the Polish company Krems Swiecie Sp. z o.o (65%), the Russian company ZAONovokrems (47%), the Polish company Cell Krems Sp. z o.o (55%) and KKS Krems Kimya Sanayive Ticaret A.S. of Turkey (51%).• <strong>Kemira</strong> Agro raised its holding in UAB <strong>Kemira</strong> Lifosa from 33 % to 51%.• <strong>Kemira</strong> Chemicals established a new subsidiary named <strong>Kemira</strong> Phosphates Oy.• In October, <strong>Kemira</strong> Metalkat established the marketing company OE-Direct AutomobilteileEntwicklungs- und Vertriebs GmbH (60% holding) in Germany.• <strong>Kemira</strong> Chemicals Oy increased its holding in Kemwater (Yixing) Co. Ltd from 49% to 60%.• Tikkurila’s holding in Tikkurila Polska Sp. z o.o rose from 60% to 100%.37
NOTES TO CONSOLIDATED FINANCIAL STATEMENTSDivestments of Group companies• The following subsidiaries of Tikkurila Coatings Ltd were sold to Becker Acroma Ltd: NorthernUniversal Coatings Ltd, Industrial Coatings Western Ltd, Industrial Coatings Eastern Ltd, IndustrialCoatings Northern Ltd, Southern Coatings and Services Ltd, Universal Surface Coatings Ltd andChiltern Surface Coatings Ltd.• <strong>Kemira</strong> sold <strong>Kemira</strong> Pigments Inc. to the American company Kerr-McGee Chemical LLC.• <strong>Kemira</strong> Pigments B.V. was sold to Kerr-McGee Chemical LLC together with <strong>Kemira</strong> Pigmente GmbH.• <strong>Kemira</strong> Oyj sold <strong>Kemira</strong> Safety Oy to the American-owned company Scott Technologies Inc.• The operations of Prospector B.V. and its subsidiary Aquanorm VOF were wound up.• Matherson S.p.A was sold at the turn of March-April <strong>2000</strong>.• Tikkurila sold its 50% holding in the Corob Group to Swisslog, which previously had a 50% stakein the same group. The deal included the following companies: Corob International AG, CorobOy, Corob Color Robots B.V., Corob SpA, Corob Scandinavia AB, Corob CPS Service Ltd, CorobSudamericana S.A., Corob North America Inc. and Corob Ltd. At the same time, the associatedcompany Corob India PVT.LTD was sold.• Tikkurila sold its 50% holding in the joint ventures Becker Acroma Ltd and Becker Acroma(Ireland) Ltd.• Tikkurila CPS Oy sold its business which manufactures color processing systems (including thesubsidiaries Winter-Bouts B.V., Macpherson GmbH, Winter-Bouts GmbH, CPS Color SA Pty Ltd,CPS Color Ltda, CPS Color Pty Ltd, Tikkurila Inc. and Tikkurila CPS (SEA) Pte Ltd) at the end ofSeptember <strong>2000</strong>. The <strong>Kemira</strong> Group has a 28% holding in the new company, CPS Color Group Oy.Changes in holdings in Group companies within the Group• Ownership of Tikkurila Coatings B.V. was transferred from Tikkurila CPS Oy to Tikkurila Coatings Oy.• <strong>Kemira</strong> Pigments B.V.’s holding of shares in <strong>Kemira</strong> Pigments S.A. (50%) was sold to <strong>Kemira</strong> Oyj.• Ownership of Tikkurila Coatings (Ireland) Ltd was transferred from Tikkurila Coatings Ltd toTikkurila Coatings Oy.• Multirange B.V. was transferred from the ownership of <strong>Kemira</strong> Agro Holding B.V. to <strong>Kemira</strong> Oyj.• <strong>Kemira</strong> Chemicals has carried out internal structural changes in the group in Canada.• Kemwater B.V. was merged with <strong>Kemira</strong> Chemicals B.V. The new company’s name is <strong>Kemira</strong>Chemicals B.V.Name changes• <strong>Kemira</strong> Color B.V. changed its name to Tikkurila Coatings B.V.• <strong>Kemira</strong> Coatings Ltd was renamed Tikkurila Coatings Ltd.• <strong>Kemira</strong> Coatings (Ireland) Ltd was renamed Tikkurila Coatings (Ireland) Ltd.• Dickursby Färg AB was renamed Tikkurila AB.• The name Tikkurila Baltcolor Sp. z o.o was changed to Tikkurila Polska Sp. z o.o.• Societatea Comercala Chimbis S.A. was renamed <strong>Kemira</strong> Chimbis S.A.• CN Paper Chemicals Oy was renamed <strong>Kemira</strong> Paper Chemicals Oy, the name Krems SwiecieSp. z o.o was changed to <strong>Kemira</strong> Swiecie Sp. z o.o, the name ZAO Novokrems was changed toZAO Novo<strong>Kemira</strong>, the name Cell Krems Sp z o.o was changed to <strong>Kemira</strong> Cell Sp. z o.o and KKSKrems Sanayi ve Ticaret A.S was changed to <strong>Kemira</strong> Kimya Sanayi ve Ticaret A.S.• Tikkurila CPS Oy was renamed Tikkurila Finance Oy.38
<strong>Kemira</strong> oyj financial statementsINCOME STATEMENT(EUR million) 1.1. – 31.12.Note <strong>2000</strong> 1999Net sales 1 20.7 27.2Other income from operations 2 13.4 9.8Cost of sales 3, 4 –33.5 –32.5Depreciation 5 –0.9 –1.0Operating income –0.3 3.5Financing income and expenses 6 –7.5 16.5Income before extraordinary items, –7.8 20.0appropriations and taxesExtraordinary items 7 177.6 81.6Income before appropriations and taxes 169.8 101.6Appropriations 8 0.0 0.0Direct taxes 9 –49.3 –28.4.Net income 120.5 73.2CASH FLOW STATEMENT <strong>2000</strong> 1999(EUR million)BALANCE SHEET(EUR million) 31.12.Note <strong>2000</strong> 1999ASSETSNon-current assetsIntangible assets 10 0.4 0.4Tangible assets 11 21.1 21.4Investments 12Shares in Group companies 440.2 434.7Holdings in associates 5.0 5.0Other shares and holdings 3.3 3.1Own shares 28.8 5.8Other investments 390.0 477.3Total investments 867.3 925.9Total non-current assets 888.8 947.7Current assetsReceivables 13Interest-bearing receivables 70.2 114.1Interest-free receivables 145.3 123.4Total receivables 215.5 237.5Securities 14 417.3 334.3Cash and bank 1.1 2.7Total current assets 633.9 574.5Total assets 1,522.7 1,522.2Funds from operationsOperating income –0.3 3.5Adjustments to operating income –13.2 –Depreciation 0.9 1.0Interest income 35.8 31.0Interest expense –22.2 –22.5Dividend received 0.4 1.3Other financing items –16.2 17.4Taxes –49.3 –20.4Total funds from operations –64.1 11.3Change in net working capitalShort-term receivables –9.6 –2.7Interest-free short-term liabilities –15.1 7.5Change in net working capital, total –24.7 4.8Cash flow from operations -88.8 16.1Capital expenditureAcquisitions of Group companies –19.3 –66.3Acquisitions of associated companies – –Purchase of other fixed assets –0.6 –0.8Disposal of Group companies 16.1 –Disposal of associated companies – –Sales of other fixed assets 0.1 0.2Total capital expenditure –3.7 –66.9Cash flow before financing –92.5 –50.8FinancingChange in long-term loans (increase +, decrease -) –175.1 120.8Change in long-term loan receivables(increase –, decrease +) 87.3 –47.6Short-term financing, net (increase +, decrease -) 139.4 –28.3Group contribution 174.8 109.1Dividend paid –29.4 –36.8Other –23.1 –5.9Financing, total 173.9 111.3Increase / decrease in liquid funds 81.4 60.5Liquid funds at end of year 418.4 337.0Liquid funds at beginning of year 337.0 276.5Increase / decrease in liquid funds 81.4 60.5LIABILITIES AND SHAREHOLDERS’ EQUITYShareholders’ equity 15Share capital 217.0 217.0Share premium account 252.5 252.5Reserve for own shares 28.8 5.8Retained earnings 205.7 184.9Net profit for the financial year 120.5 73.2Total shareholders’ equity 824.5 733.4Appropriations 16 0.5 0.5Long-term liabilitiesInterest-bearing long-term liabilities 17 306.7 525.2Interest-free long-term liabilities 18 – –Total long-term liabilities 306.7 525.2Current liabilities 19Interest-bearing short-term liabilities 362.5 217.5Interest-free short-term liabilities 28.5 45.6Total current liabilities 391.0 263.1Total liabilities 697.7 788.3Total liabilities and shareholders’ equity 1,522.7 1,522.239
NOTES TO KEMIRA OYJ FINANCIAL STATEMENTSINCOME STATEMENT (EUR million)1. NET SALES <strong>2000</strong> 1999Net sales 20.7 27.2Net sales consist of sale of electricity to Finnish Groupcompanies and other external customers in Finland.2. OTHER INCOME FROM OPERATIONSGains on the sale of fixed assets 13.3 9.3Other income 0.1 0.5Total 13.4 9.83. COST OF SALESMaterials and servicesMaterials and suppliesPurchases during the financial year 15.7 20.8External services – –Total materials and services 15.7 20.8Personnel expenses 11.8 6.4Rents 2.1 2.3Losses on the sales of fixed assets 0.0 0.0Other expenses 3.9 3.0Total 33.5 32.54. PERSONNEL EXPENSES AND NUMBER OF PERSONNELEmoluments of the Supervisory Board 0.1 0.1Emoluments of boards of directorsand managing directors 1) 0.3 0.9Other wages and salaries 5.3 4.2Pension expenses 5.4 0.7Other personnel expenses 0.7 0.5Total 11.8 6.41)Performance-related bonuses were not paid to management in <strong>2000</strong> and in1999. Year <strong>2000</strong> salary paid to the managing director, including fringe benefits,was EUR 0.3 million.Management’s pension commitmentsThe managing director and deputy managing directors of <strong>Kemira</strong> Oyj areentitled to retire at the age of 60. This possibility is based on the benefits of thesupplementary pension foundation that has been closed to new members since1 January 1991. The supplementary pension foundation’s benefits concern allthe personnel whose years of service and other conditions concerning thegranting of a pension have been fulfilled.The non-executive members of the Board of Directors are paid a monthlyemolument; other compensation is not paid to the members of the Board ofDirectors.Persons belonging to the Company’s management, including parties closelyassociated with them, are not involved in substantial business relationshipswith the Company.The pension commitments to the management of the company do not differfrom those to the other permanent staff.PersonnelPersonnel, average 120 132Personnel at year end 116 1335. DEPRECIATIONScheduled depreciationIntangible assetsIntangible rights 0.1 0.1Other long-term expenditures 0.0 0.0Tangible assetsBuildings and constructions 0.3 0.3Machinery and equipment 0.5 0.6Other tangible assets 0.0 0.0Total 0.9 1.0Decrease in difference between scheduled and actual depreciationIntangible assets 0.0 0.0Other long-term expenditures 0.0 –0.1Buildings and constructions –0.1 –0.2Machinery and equipment 0.1 0.3Total 0.0 0.0Interest incomeFrom long-term investments fromGroup companies 22.4 26.5From short-term investments fromGroup companies 14.3 12.6From short-term investments from others 7.8 1.8Total interest income 44.5 40.9Other financing incomeOther financing income from Group companies 0.1 0.2Other financing income from others 0.0 0.0Total other financing income 0.1 0.2Exchange differencesExchange differences from Group companies – 75.2Exchange differences from others – –69.3Total exchange differences – 5.9Total financing income 45.2 48.8Financing expensesInterest expensesInterest expenses to Group companies –7.4 –2.1Interest expenses to others –24.2 –29.7Total interest expenses –31.6 –31.8Other financing expenses –0.6 –0.5Exchange differencesExchange differences from Group companies 13.2 –Exchange differences from others –33.7 –Total exchange differences –20.5 –Total financing expenses –52.7 –32.3Total financing income and expenses –7.5 16.5Exchange gains and lossesRealized –24.4 17.7Unrealized 3.9 –11.8Total –20.5 5.97. EXTRAORDINARY ITEMSExtraordinary incomeGroup contributions received 190.7 96.1Total 190.7 96.1Extraordinary expensesGroup contributions granted –2.3 –2.9Write-downs on shares –10.8 –11.6Total –13.1 –14.5Total extraordinary income and expenses 177.6 81.68. CHANGE IN APPROPRIATIONSDecrease in depreciation difference 0.0 0.0Total 0.0 0.09. DIRECT TAXESOn extraordinary items 51.5 22.8Current year –2.5 5.6Previous years 0.3 0.0Other 0.0 0.0Total 49.3 28.410. INTANGIBLE ASSETSIntangiblerights<strong>2000</strong> 1999Other longtermexpenditures<strong>2000</strong>total1999totalAcquisition cost at beginning of year 0.7 0.5 1.2 1.8Increases 0.0 0.0 0.0 0.2Decreases 0.0 0.0 0.0 –0.8Acquisition cost at end of year 0.7 0.5 1.2 1.2Accumulated depreciation atbeginning of year –0.4 –0.4 –0.8 –1.5Accumulated depreciation relating todecreases and transfers 0.0 0.0 0.0 0.8Depreciation during the financial year 0.0 0.0 0.0 –0.1Accumulated depreciation at end of year –0.4 –0.4 –0.8 –0.8Net book value at end of year 0.3 0.1 0.4 0.46. FINANCING INCOME AND EXPENSESFinancing incomeDividend incomeDividend income from Group companies 0.3 –Dividend income from associates 0.3 1.6Dividend income from others 0.0 0.2Total dividend income 0.6 1.840
NOTES TO KEMIRA OYJ FINANCIAL STATEMENTSBALANCE SHEET (EUR million)11. TANGIBLE ASSETSLand andwater areas 1)Buildings andconstructions 2)MachineryandequipmentOthertangibleassetsAdvancespaid and fixedassets underconstructionAcquisition cost at beginning of year 2.7 28.2 8.7 0.5 0.0 40.2 41.0Increases 0.0 0.1 0.4 0.0 0.0 0.5 0.4Decreases 0.0 0.0 –0.3 0.0 0.0 –0.3 –1.2Acquisition cost at end of year 2.7 28.3 8.9 0.5 0.0 40.4 40.2Accumulated depreciation at beginning of year 0.0 –11.5 –6.8 –0.4 0.0 –18.8 –19.1Accumulated depreciation relating todecreases and transfers 0.0 0.0 0.2 0.0 0.0 0.2 1.2Depreciation during the financial year 0.0 –0.3 –0.5 0.0 0.0 –0.8 –0.9Accumulated depreciation at end of year 0.0 –11.8 –7.1 –0.4 0.0 –19.4 –18.8Net book value at end of year 2.7 16.5 1.7 0.1 0.0 21.0 21.41) The acquisition cost and the book value of land and water areas include revaluations of EUR 0.6 million in <strong>2000</strong> and in 1999.2) The acquisition cost of buildings and constructions include revaluations of EUR 5.0 million in <strong>2000</strong> and in 1999.<strong>2000</strong>total1999total12. INVESTMENTSHoldings inassociatesGroupcompany andother sharesInvestments inGroupcompaniesAcquisition cost at beginning of year 5.0 437.8 477.3 5.8 925.9 817.8Increases 0.0 19.4 0.0 23.0 42.4 72.2Decreases 0.0 –13.7 0.0 – –13.7 –11.7Receivables from Group companies 0.0 0.0 –87.3 – –87.3 47.6Net book value at end of year 5.0 443.5 390.0 28.8 867.3 925.9Shares and holdings are specified in Note 21.Ownshares<strong>2000</strong>total1999total13. RECEIVABLES <strong>2000</strong> 1999Long-term receivablesInterest-free long-term receivablesReceivable from pension liability at 1 Jan. 1.3 1.5Transfer to other short-term interest-free receivables –1.3 –1.5Increase / Decrease – –Receivable from pension liability at 31 Dec. – –Total interest-free long-term receivables – –Total long-term receivables – –Current receivablesInterest-bearing short-term receivablesLoan receivables from Group companies 70.2 114.1Total interest-bearing short-term receivables 70.2 114.1Interest-free short-term receivablesAccounts receivableAccounts receivable from Group companies 2.6 3.2Accounts receivable from others 0.1 1.0Total accounts receivable 2.7 4.2Advances paid 0.0 0.1Prepaid expenses and accrued incomePrepaid expenses and accrued incomefrom Group companies 115.1 111.0Prepaid expenses and accrued incomefrom others 27.4 6.7Total prepaid expenses and accrued income 142.5 117.7Other interest-free short-term receivablesReceivables from pension liability at 1 Jan. – –Transfer from long-term receivables 1.3 1.5Decrease –1.3 –0.2Receivables from pension liability at 31 Dec. 0.0 1.3Other receivables 0.1 0.1Total interest-free short-term receivables 0.1 1.4Total current receivables 145.3 123.4Total receivables 215.5 237.5Loans to the management – –Prepaid expenses and accrued income fromInterests 8.7 9.9Taxes 12.7 –Exchange differences 9.0 5.9Group contribution 109.7 96.1Other 2.4 5.8Total 142.5 117.714. SECURITIESSecurities in Group companies 241.7 308.2Securities in other companies 175.6 26.1Total 417.3 334.315. SHAREHOLDERS’ EQUITY <strong>2000</strong> 1999Share capital at 1 Jan. 217.0 216.6Change 0.0 0.4Share capital at 31 Dec. 217.0 217.0Share premium account at 1 Jan. 252.5 252.9Change 0.0 –0.4Share premium account at 31 Dec. 252.5 252.5Fund for own shares at 1 Jan. 5.8 –Purchase of own shares 23.0 5.8Fund for own shares at 31 Dec. 28.8 5.8Retained earnings at 1 Jan. 258.1 227.5Net profit for the year 120.5 73.2Dividends paid –29.4 –36.8Purchase of own shares –23.0 –5.8Donations 0.0 0.0Retained earnings and net profitfor the year at 31 Dec. 326.2 258.1Total shareholders’ equity at 31 Dec. 824.5 733.416. APPROPRIATIONSAppropriationsAppropriations in the balance sheets are as follows:Buildings and constructions 0.2 0.0Machinery and equipment 0.3 0.4Other tangible assets 0.0 0.1Intangible rights 0.0 0.0Other long-term expenditures 0.0 0.0Total 0.5 0.5Change in appropriationsAppropriations at 1 Jan. 0.5 0.5Change in untaxed reserves 0.0 0.0Appropriations at 31 Dec. 0.5 0.5Deferred tax liabilities on accumulated depreciations were EUR 0.1 million at 31Dec. <strong>2000</strong> and EUR 0.1 million at 31 Dec. 1999.17. LONG-TERM INTEREST-BEARING LIABILITIESDebentures and other bond loans 61.7 61.7Loans from financial institutions 193.7 380.7Loans from pension institutions 51.3 56.3Other long-term liabilities 0.0 26.5Total 306.7 525.2Long-term interest-bearing liabilities maturing in2002 (2001) 8.6 45.52003 (2002) 142.6 8.72004 (2003) 1.5 174.32005 (2004) 54.6 142.22006 (2005) or later 99.4 154.5Total 306.7 525.241
NOTES TO KEMIRA OYJ FINANCIAL STATEMENTSBALANCE SHEET (EUR million)Interest-bearing liabilities maturing<strong>2000</strong> 1999in 5 years or longerLoans from pension institutions 51.3 56.3Other long-term interest-bearing liabilities 48.1 98.2Total 99.4 154.5Debentures and other bond loansLoanLoan currencyFI 0003008581 1998-2003 EUR 45.2 45.2FI 0003008599 1998-2006 EUR 16.5 16.5Total 61.7 61.7The Group has no convertible bonds.18. LONG-TERM INTEREST-FREE LIABILITIESPension liabilitiesUncovered liabilities of pension funds – 0.1Other pension liabilities 1.2 1.4Transfer to other intrerest-free liabilities –1.2 –1.5Total – –19. CURRENT LIABILITIESInterest-bearing short-term liabilitiesLoans from financial institutions 39.3 87.6Current portion of other long-termloans to others 54.9 11.5Advances received 0.8Other interest-bearing short-term liabilitiesto Group companies 258.9 79.2to others 8.6 39.2Total interest-bearing short-term liabilities 362.5 217.5Repayment items for other long-term loans in 1999 include an EUR 0.1 millionissue of bonds with warrants targeted at management.Interest-free short-term liabilitiesAccounts payableto Group companies 0.4 0.0to others 2.6 3.0Total accounts payable 3.0 3.0Accrued expenses and prepaid incometo Group companies 6.2 3.9to others 19.1 37.4Total accrued expenses and prepaid income 25.3 41.3Pension liabilitiesTransfer from interest-free long-term liabilities 1.2 1.5Change in pension liabilites –1.2 –0.3Total pension liabilities 0.0 1.2Other interest-free liabilites to others 0.2 0.1Total interest-free short-term liabilities 28.5 45.6Total current liabilities 391.0 263.1<strong>2000</strong> 1999Accrued expenses and prepaid incomeFrom salaries 1.3 0.9From interests and exchange differences 23.1 26.9From taxes 0.0 7.6From Group contribution 0.2 0.2Other 0.7 5.7Total 25.3 41.320. COLLATERAL AND CONTINGENT LIABILITIESLoans secured by mortgages in the balance sheet andfor which mortgages given as collateralLoans from pension institutions 4.8 4.3Mortgages given 5.0 5.0Contingent liabilitiesAssets pledgedOn behalf of own commitments 1.1 0.2On behalf of Group companies 9.8 10.9GuaranteesOn behalf of Group companiesfor loans 57.1 70.0for leasing obligations 53.9 54.1for other obligations 4.4 7.7On behalf of associates 24.3 20.2On behalf of others 1.6 1.9Total 141.3 153.9Letter of Comfort obligations 1)On behalf of Group companiesfor credits 0.7 0.2for leasing agreements 2.1 3.7Total 2.8 3.91)Letter of Comfort obligations do not constitute a legal guarantee.The nominal values and market values of financing instruments are included in theNotes to the consolidated financial statements.21. SHARES AND HOLDINGS OF KEMIRA OYJShares in subsidiaries Group <strong>Kemira</strong> Oyjholding % holding %<strong>Kemira</strong> Agro Oy 100 100<strong>Kemira</strong> Chemicals Oy 100 100<strong>Kemira</strong> Pigments Holding B.V. 100 17.79<strong>Kemira</strong> Metalkat Oy 100 100<strong>Kemira</strong> Pigments Oy 100 100<strong>Kemira</strong> Trading Oy 100 100Tikkurila Oy 100 100Spruce Vakuutus Oy 100 100<strong>Kemira</strong> Danmark Holding A/S 100 100<strong>Kemira</strong> (UK) Limited 100 100Multirange B.V. 100 100<strong>Kemira</strong> Pigments Latin America Comercial Ltda 100 50<strong>Kemira</strong> Pigments S.A. 100 50Proposal for the distribution of profitsThe net profit of <strong>Kemira</strong> Oyj for the <strong>2000</strong> financial yearwas EUR 120,542,659 and the distributable equity at 31December <strong>2000</strong> was EUR 326,180,000. The Group’snon-restricted equity was EUR 642,156,000. The parentcompany’s payment of a dividend is limited by theGroup’s distributable equity, EUR 507,787,000, which isobtained when the share of untaxed reserves that hasbeen transferred to shareholders’ equity is subtractedfrom the non-restricted equity shown in the ConsolidatedBalance Sheet.Helsinki 12 February 2001Sten-Olof HansénIt is proposed to the <strong>Annual</strong> General Meeting that adividend of EUR 0.30 per share, or EUR 37,094,000, bepaid for the financial year. It is proposed that EUR 500,000be reserved for use by the Board of Directors for purposespromoting the common good (among otherthings, for donations to the <strong>Kemira</strong> Oyj foundation).Niilo PellonmaaEija MalmivirtaRitva HainariTauno PihlavaAnssi Soila42
Auditors’ reportTo the shareholders of <strong>Kemira</strong> OyjWe have audited the accounting records and the financialstatements, as well as the administration bythe Supervisory Board, the Board of Directors andthe Managing Director of <strong>Kemira</strong> Oyj for the yearended 31 December <strong>2000</strong>. The financial statements,which include the report of the Board of Directors,consolidated and parent company incomestatements, balance sheets and notes to the financialstatements, have been prepared by the Boardof Directors and the Managing Director. Based onour audit we express an opinion on these financialstatements and the company’s administration.We have conducted our audit in accordance withFinnish Generally Accepted Auditing Standards.Those standards require that we plan and performthe audit in order to obtain reasonable assuranceabout whether the financial statements are free ofmaterial misstatement. An audit includes examining,on a test basis, evidence supporting theamounts and disclosures in the financial statements, assessingthe accounting principles used and significantestimates made by the management, as well as evaluatingthe overall financial statement presentation. Thepurpose of our audit of the administration has been toexamine that the Supervisory Board, the Board of Directorsand the Managing Director have complied withthe rules of the Finnish Companies Act.In our opinion, the financial statements have been preparedin accordance with the Finnish Accounting Actand other rules and regulations governing the preparationof financial statements in Finland. The financialstatements give a true and fair view, as defined in theAccounting Act, of both the consolidated and parentcompany result of operations, as well as of the financialposition. The financial statements can be adoptedand the members of the Supervisory Board, the Boardof Directors and the Managing Director of the parentcompany can be discharged from liability for the periodaudited by us. The proposal made by the Board ofDirectors on how to deal with the retained earnings isin compliance with the Finnish Companies Act.Helsinki, 12 February 2001KPMG WIDERI OY ABHannu NiilekseläAuthorized Public AccountantStatement of the supervisory boardThe Supervisory Board of <strong>Kemira</strong> Oyj has read thefinancial statements of the parent company and theGroup for <strong>2000</strong> and studied the Auditors’ report atits meeting today.The Supervisory Board advises the 2001 <strong>Annual</strong> GeneralMeeting that the company has been managedwell and that it has no comments to make on the financialstatements of the parent company and theGroup for <strong>2000</strong>. The Supervisory Board proposesthat the financial statements of the parent companyand the Group be adopted and that the Board ofDirectors, the Managing Director and his deputiesbe discharged from liability. The Supervisory Boardconcurs with the proposal of the Board of Directorsfor the distribution of profit funds.Helsinki, 14 February 2001Timo KalliRisto RankiPekka KainulainenKari RajamäkiSirpa HertellMikko Långström43
<strong>Kemira</strong>ChemicalsNet sales bybusiness unitIndustrialChemicals31 %Kemwater20 %FineChemicals4 %Pulp &PaperChemicals45 %Net salesNet sales%20151050Operating margin, %96 97 98 99 00EURmillion800600400200A YEAR OF GROWTH FOR PULP &PAPER CHEMICALSPulp & Paper Chemicals’ net salesrose by 14 % to EUR 372 million. Theunit’s customer industry, the pulp andpaper industry, experienced a strongupswing throughout <strong>2000</strong>, althoughright at the end of the year there weresigns of a slight slowdown. A numberof major acquisitions and mergerswere concluded amongst client companies,and this consolidation trend iscontinuing at full force. This alsobrings new challenges to chemicalssuppliers, who must have an increasinglyglobal and more integrated servicecapability to meet the needs ofstrongly expanding client companies.<strong>Kemira</strong> Chemicals is responding tothis challenge by building on its strategyof total solutions and by expandingits presence in world markets.The first important step in implementingthe new strategy was the acquisitionof Neste Chemicals’Finnish-Austrian specialtychemicals business. Viathis deal we gained afirm foothold withinspecialty chemicalsfor the paper industryin Europe’sGerman-speakingregion. Apart fromAustria, the dealincludes operationsin Finland, Poland,Turkey and Russia.Expansion investmentsmoved ahead inmany areas. An extension willbe completed at the specialty chemicalsplant in Vaasa. In Sweden a debottleneckingprogramme will be carriedout at the hydrogen peroxideplant, and peracetic acid equipmenthas been installed at Södra Cell AB inMönsterås. The capital expenditure onthe sizing plant in Brazil is movingahead according to plans.0Capital expenditure96 97 98 99 00The sharply higher cost of oilraised raw material prices in <strong>2000</strong> andthe impact of oil prices will be considerablein the current year as well.KEMWATER CONTINUES TOEXPANDEURmillion140120100806040200For the most part, Kemwater’s operationsshowed a favourable trend in<strong>2000</strong>. Net sales were up 7 % to EUR156 million. Organizational changeswere made and at present Kemwateris divided into three water managementunits: Nordic, Continental andOverseas. The fourth business unit isSludge Management, which concentrateson developing the Krepro business.Krepro refers to the process oftreating and recycling waste watersludge by environmentally soundmeans. <strong>Kemira</strong> Chemicals is pursuingcooperation in this area with Agro.Kemwater’s new projects movedahead at a good clip. The bestgrowth came in the Overseassegment, where a15% stake was purchasedin KemironInc, the UnitedStates’ leadingmanufacturer ofiron coagulants.We also increasedour holding inour company inChina, Kemwater(Yixing) Co. Ltd.Two acquisitionswere made in theContinental segment. Wepurchased Luebny závody a.s.,the Czech manufacturer of aluminiumsulphate, and the ferrichloride businessof Solvay S.A. of Spain.The Nordic unit expanded themanufacture of magnesium-free ironcoagulant at its plant in Pori. KemwaterServices Oy concluded an importantagreement on development of Kosovo’swater supply system. In St. Pe-44
KEMIRA CHEMICALSEUR million<strong>2000</strong> 1999 1998 1997 1996Net sales 767 697 630 582 520Cost of sales –638 –558 –507 –462 –407Depreciation –60 –56 –48 –45 –42Operating income 69 83 75 75 71Net financing expenses –16 –24 –19 –17 –20Income before extraordinary items 53 59 56 58 51Capital invested (average) 647 596 524 453 415Return on capital invested % 12 13 14 17 18Capital expenditure 100 56 126 86 72Personnel (average) 3,210 3,138 3,114 2,845 2,283The operating income figure includes the non-recurring costs of winding up the detergentphosphate plant and other one-time depreciation totalling EUR 14 million.tersburg we are studying the possibilitiesof starting up the manufacture ofchemicals for waste water treatmentneeds together with local suppliers.Prices of aluminium hydrate, whichis used as a raw material for waterchemicals, faced increase pressures.INDUSTRIAL CHEMICALS SHOWSITS GRITIt was a difficult year for IndustrialChemicals. Net sales were roughly atthe level of a year earlier. The onlyunit that posted good earnings wasKemphos, which manufactures phosphoricacid in Siilinjärvi, Finland. Itsearnings too were burdened by thelower price of phosphoric acid. This,however, was partly offset by the highexchange rate of the dollar. The unitsthat manufacture animal feeds and detergentchemicals had difficulties adjustingthe market prices to compensatefor the rises in raw material costs.Within detergent chemicals, the sodiumtripolyphosphate business wassold, and this will lead to the discontinuanceof manufacture of the productin Helsingborg, Sweden, within afew years. The calcium chloride unitcontinued to face a tight competitivesituation.Industrial Chemicals’ most importantcapital expenditure, the expansionof sodium percarbonate production inSweden, progressed according toplans and will reach completion beforethe end of 2001. Similarly, investmentswere made in the receivingend for feed phosphate raw materialsso that we will be able to uselower-priced and purer Kovdor apatiteas a raw material of feedphosphates.<strong>Kemira</strong> Fine Chemicals Oy’s operationsdeveloped in line with theagreed strategy. The company reportedsomewhat better net salesthan a year ago.KEMIRA CHEMICALS ANDSOCIETY<strong>Kemira</strong> Chemicals’ business units willcontinue to have an important socialsignificance in future: Kemwater purifiesboth drinking water and waste waterfor hundreds of millions of peopleand Pulp & Paper Chemicals serves informationexchange as well as educationand training by making possibleefficient and environmentally soundpaper production. Industrial Chemicals’ECOX is a detergent compoundthat is harmless to the environment,and titanium dioxide is an essentialraw material in countless everydayproducts.DEVELOPMENT OF INFORMATIONSYSTEMSInstallation and fine-tuning of the SAP/R3 systems moved ahead. The systemwas placed in use in Germany, and itwill be up and running in Canada duringthe spring.45
<strong>Kemira</strong> Chemicals is building an e-commerce system as part of its processoraganization with the aim of achievingsmoothly running operations fromthe supplier all the way to a satisfiedcustomer. E-commerce will enable thischain to be extended so that both suppliersand customers are more closelyinvolved together in the same process.OUTLOOK FOR THE FUTUREHydrogen peroxide (100%)in West Europe(Estimated averages)95 96 97 98 99 00Phosphoric acidUS Gulf C&F NW Europe95 96 97 98 99 00EUR/t1000800600400<strong>2000</strong>USD/t4504003503002502001501005002001 will be a year of positive growthfor <strong>Kemira</strong> Chemicals. Significantly,the Pulp & Paper Chemicals and Kemwaterunits are among the entire<strong>Kemira</strong> Group’s most importantgrowth areas, which are expected todeliver growth of 20-30% over thenext few years. Expansion will be propelledmainly by acquisitions. Thesearch for promising acquisition candidateshas been made a top priorityand both units are expecting resultswithin a year. At present exploratorystudies are focusing on the UnitedStates and Europe. We are also investinga good deal in research and developmentwith the aim of ensuring organicgrowth in both our present companiesand in those we buy.Considerable changes have takenplace within <strong>Kemira</strong> Chemicals’ strategicbusiness units. Pulp & PaperChemicals’ formic acid unit, <strong>Kemira</strong>Pigments’ Pori plant and <strong>Kemira</strong> FineChemicals’ were melded into IndustrialChemicals as from the beginning of2001. Feed phosphates, potassium sulphatefertilisers and the phosphoricacid business in turn were transferredto Agro.The outlook for the current yearwill depend a great deal on the generaltrend in business cycles, particularlyin the United States. It is believed that<strong>Kemira</strong> Chemicals’ net sales and netincome will grow both organically andvia acquisitions. The internal structuraltransformation that has been carriedout within <strong>Kemira</strong>, above all the integrationof Pigments within Chemicals,will improve earnings.<strong>Kemira</strong>PigmentsTHE BEST UNIT WAS RETAINEDIn line with <strong>Kemira</strong>’s strategy, <strong>Kemira</strong>Pigments’ weakly profitable productionunits in the United States and theNetherlands were sold. In future<strong>Kemira</strong> Pigments is basing its operationson its competitive productionunit in Pori.DEMAND LIFTS PRICESThe world’s titanium dioxide market isgrowing at a rate of 3% a year in stepwith the growth in gross domesticproduct. Although the total volumes oftitanium dioxide used for differentpurposes do not necessarily changevery significantly from one year to thenext, demand for the product variesaccording to a cycle of about threeyears. The main reason for this is thatcustomers stock up on the productand then wind down their stocks.Compared with the previous year,demand for titanium dioxide grew significantlyin <strong>2000</strong> in all market areas,but above all in western Europe. Thestrong growth in demand led to a tightdelivery situation, pushing up pricesseveral times during the year. The latestprice increase notifications weremade towards the end of <strong>2000</strong>.A bit more than 100,000 tonnes ofnew capacity came on stream aroundthe world during <strong>2000</strong>. The increasesin capacity have been made by meansof debottlenecking because even thepresent price level does not supportcapital expenditures on completelynew plants. Announcements havebeen made concerning a total of about400,000 tonnes, which consists of debottleneckinginvestments and severalpreliminary plans for building fairlysmall lines over the next four years.This corresponds to the averagegrowth in demand. The present goodbalance between supply and demandwill thus hold steady in coming years.<strong>Kemira</strong> Pigments delivers productsto more than a hundred countries alltold. Our most important market areais western Europe, though we have animportant market position in LatinAmerica and Asia as well. Our mostimportant growth area, particularlywithin printing ink products, will beNorth America in the years ahead.46
COSTLIER RAW MATERIALSThe most important production costfactors are ilmenite and energy. Theprice of ilmenite has risen owing tothe scarcity of the ore on the market,and the general price level of energyhas been on the rise.NEAR-TERM OBJECTIVESOur plant in Pori is one of the world’slargest plants that employs the sulphatemethod. It has a capacity of 120,000tonnes a year. The plant uses the lowestcost titanium dioxide raw material – ilmenite.This means that the productionunit in Pori has a very competitive costlevel. We have a strong market positionwithin number of speciality products,such as within products used in printinginks and microfine titanium dioxide.Our objective is to grow furtherboth in the area of specialty productsand industrial pigments. Within specialtyproducts we are seeking growththrough new products and higher volumes.The possibility of lifting productioncapacity gradually to 150,000tonnes by means of debottlenecking isunder study at present.A central objective for us withinenvironmental protection in futureyears is to exploit process byproductflows in the form of saleable products.Byproducts are used for purposes suchas water purification, soil conditioningand as an additive in cement.R&D REMAINS A HIGH PRIORITYThe titanium dioxide manufacturingprocess is lengthy and complex and itsproper control calls for a good deal ofknow-how. <strong>Kemira</strong> has special expertisewithin finishing, in the manufactureof microfine product and also inthe area of environmental technology.Product development on pigmentarytitanium dioxide, which has good opacityproperties, was weighted towards pigmentsthat are used in the printing inkand paint industries. The accent in theTitanium dioxide pigmentdevelopment of speciality products wason articles used in cosmetics, plastics,paints and catalysts. The developmentwork on microfine transparent TiO 2 pigmentwhich is used in so-called high effectautomotive paints reached completion.As part of our research and developmentwork, we pursued cooperationwith customers, universities and researchinstitutes.We are studying domestic ilmenitein cooperation with VTT technical researchcentre of Finland and a developmentcompany in the mining field.The technical suitability of this ilmeniteas a raw material for the sulphateprocess in Pori is being studied bymeans of a plant-scale test run.FURTHER IMPROVEMENTS INEFFICIENCY<strong>Kemira</strong> Pigments’ efficiency has risensignificantly in recent years. In Pori theproduction capacity per employee hasrisen by about 40% since 1997. Overthe next few years we shall increasecapacity further and improve the efficiencyof energy use.SYNERGIES WITH THE OTHERBUSINESS AREASOur cooperation with Kemwater is importantfor both parties. Together withTikkurila we have studied the use of titaniumdioxide in paints. In future weshall engage in closer cooperation with<strong>Kemira</strong>’s research centres in Espoo andOulu with the aim of enhancing theuse of research resources.OUTLOOK FOR THE FUTUREDemand for titanium dioxide has heldup well, though the slowing of economicgrowth in the United States maylower demand in the North Americanmarket. New capacity will be madeavailable only to a limited extent. It isbelieved that the price level will remainstrong next year too.IlmeniteC&F NW EuropeEUR/kgUSD/t11010090807060502.52.01.51.00.5095 96 97 98 99 0095 96 97 98 99 0047
TikkurilaNet sales bymarket areaOther EU37 %Net salesNet sales%201510Operating margin, %EURmillion400300200Capital expenditureEURmillion50403020100Othercountries14 %East Europe19 %Finland27 %Other WestEurope3 %5096 97 98 99 00100096 97 98 99 00The operational framework of thepaint business, which <strong>Kemira</strong> has chosenas a strategic priority, improvedconsiderably when Tikkurila CPS, thetinting business, was sold to IndustriKapital, a Swedish private equity investmentfirm, in the autumn.TIKKURILA PAINTS EXPANDSWESTWARDThe acquisition of Alcro-Beckers AB atthe turn of the year 2001 marked thestart of Tikkurila’s expansioninto Western Europe.Sweden’s largest paintmanufacturer hasteamed up withTikkurila before:the Baltic Colorjoint venture hasoperated successfullyin the Balticcountries since1994.Tikkurila’s decorativepaints areseeking to establish amajor position in selectedmarket areas. By way ofthis acquisition, Tikkurila became thelargest paint manufacturer in the Nordiccountries. In Europe the companyis already amongst the ten largestmanufacturers, but it has set its sightson being in the top five in a fewyears.Within exterior paints, the focus inrecent years has been on the developmentof technically high quality andweather-resistant products. The use ofsolvent-containing products has beenreduced by replacing these or by introducingequivalent water-borne orlow-solvent alternatives. Water-borneproducts too have been developedfurther. On the interior paints side,Tikkurila is pushing ahead with thedevelopment of very low-emittingproducts.A FAVOURABLE CONTINENTALEUROPEAN MARKETThe rainy summer hampered sales ofexterior paints in Finland and Sweden.Thanks to brisk demand in the earlymonths of the year and the autumn,sales of decorative paints neverthelessreached the previous year’s level.The Feelings products and conceptwhich facilitate the selection of coloursand was brought out on the market inthe spring has been well received bothin Finland and in export markets,and sales havegrown according to expectations.Earnings wereweakened somewhatby one-offoutlays on marketing, which will bearfruit over the longer term.Operations in Russia also showedfavourable development. Deliveries increasedby a third and the local companieswere doing business at a goodclip. Finncolor, which has firmly establishedits position in Northwest Russia,reported good growth, especiallythanks to its own production facilities:already half of the litres sold are manufacturedin St Petersburg. The activitiesof the painting school were continuedand a modern test paintingshop was built in the warehouse.The Kraski Tikkurila plant nearMoscow started its own paint productionin the spring. Product developmentis steered from the Vantaa site,whilst the greatest possible use of localraw materials is made in producing48
TIKKURILAEUR million<strong>2000</strong> 1999 1998 1997 1996Net sales 345 357 361 349 255Cost of sales –301 –316 –312 –288 –208Depreciation –17 –18 –16 –13 –10Operating income 27 23 33 48 37Net financing expenses –1 –4 –5 –4 –4Income before extraordinary items 26 19 28 44 33Capital invested (average) 252 234 211 181 170Return on capital invested % 13 10 16 27 22Capital expenditure 13 23 23 47 25Personnel (average) 2,049 2,301 2,214 1,902 1,520the paints. For this product group,Tikkurila is seeking to find its own distributionchannels so that it can competewith Russian manufacturers. Inthe spring a regional warehouse wasopened in Novosibirsk to serve Siberiandistributors.Marketing of the Benetton conceptcontinued in continental Europe,where it has performed well. Ultramodernproducts were brought out onthe market, for example, Iridescent, apearlescent effect finish. At the turn ofthe year there were about 500 Benettonstores selling paint around theworld.The sales trend in Hungary was favourable.The relocation to new facilitiesin November <strong>2000</strong> will improvecustomer service further.The situation in the Baltic countriesnormalized following the Russian crisis,and Baltic Color’s sales showed apositive trend. Vivacolor, the leadingtrademark in the Baltic countries,strengthened its position further.TIKKURILA COATINGS GOESEUROPEANIn <strong>2000</strong> the remake of Tikkurila Coatings’profile into a company with aclear European focus was seen tocompletion. To underline the commonidentity, the name of all the companiesis now Tikkurila Coatings, and theproduct names too are for the mostpart the same. The objective is that regardlessof the country or locality, customerswill perceive Tikkurila Coatingsas being a company that offers customizedsurface treatment solutions forindustry’s needs.Additional Temaspeed service outletswere established in Finland andabroad. Temaspeed is the leading tintingand distribution system for industrialcoatings across Europe. TikkurilaCoatings has its own production, asales company or an importer in 20countries, and there are already about200 authorized Temaspeed distributors.As the result of a nearly three-yearlong project, Tikkurila Coatings setup an extensive customer servicecentre in Vantaa for the woodworkingindustry. The centre employsthe latest technology and offers customersservices such as the possibilityof testing their products withnew equipment before taking theirown capital expenditure decisions.Within the product developmentfor the metal industry, majoroutlays have been made on environmentallycompliant products.These include water-borne paintsas well as paints having a highsolids content. The most importantdevelopment effort withinpaints for the woodworking industryis water-borne and UVcuredproducts. Research in thecoil coating area is centered onthe development of high-buildcoatings and chromate-free primers.EXPORTS UP SHARPLYThe competitiveness of industrialcoatings has improved in both theNordic countries and elsewhere inEurope. In its chosen areas, TikkurilaCoatings now ranks amongst Europe’sleading manufacturers of industrialcoatings.Within protective coatings the companyis one of the six largest produc-49
ers and in OEM product finishes itranks among the top ten. TikkurilaCoatings’ paints for the woodworkingindustry are the market leaders in Finlandand the Baltic countries. Coilcoating has landed new export customersin addition to its establishedcustomer base in the Nordic countries.Thanks to the favourable trend inthe economy, the consumption of industrialcoatings headed upwards a bitin Finland and Sweden.Especially in export markets, paintsales were buoyant. Deliveries to theCIS market nearly doubled. Tostrengthen operations in the Balticcountries, a service centre was set upin Latvia. In Hungary, Tikkurila movedinto new premises which will serve asa base for managing paint deliveries toall parts for eastern Central Europe.Positions within the metal industrywere strengthened in the UK by purchasingthe industrial coatings businessof Mason Coatings PLC. Manufactureof the products will be transferredgradually to the plants in Bury andWest Bromwich.The concentration on selected areasof operations also moved ahead inthe UK when Tikkurila sold its 50 %stake in Becker Acroma Ltd. At thesame time, the Goldspeed chain ofdistributors was sold off, though it willcontinue marketing Tikkurila Coatings’products for the metal industry.WHAT ARE PAINTS FOR?The purpose of paints is to protect andbeautify surfaces. This means that theyhave a considerable importance fromthe standpoint of sustainable development.Properly protected buildingsand structures last longer and therebyconserve nature and various materials.Nor should one belittle the importanceof aesthetics and colours. Abuilding that is in harmony with its environmentis a joy to behold, and atastefully chosen interior makes for amore pleasant working or living environment.In the area of industrialpainting too, colours now figure prominently.CUSTOMER-DRIVEN OPERATIONSTikkurila’s operations have alwaysbeen centred on the customer’s needs.Tikkurilan Viesti (the Tikkurila Messenger),which first came out in 1929,is one of Finland’s oldest customermagazines, and advisory services forprofessional painters date back just asfar. Also, the Paintline telephone servicethat was introduced in the autumn<strong>2000</strong> put consumers directly in touchwith the paint plant.Tikkurila is one of the world’sleading companies in the utilization oftinting systems in marketing paintproducts to consumers, the paintingtrade and industry alike.A few years ago Tikkurila Paintsbecame the world’s first company tointroduce environmentally compliantcolourants and a tinting system comprisingonly two base paints. The colourantsof Tikkurila Coatings’ two basepaint system are in compliance withthe stringent quality, occupationalsafety and environmental requirementsset for industrial painting.Production efficiency at Tikkurila istop-flight. The new operations controlsystem that was introduced at theMonicolor plant in January <strong>2000</strong> willfurther increase cost effectiveness andimprove the plant’s ability to meetquality standards.All subareas of operations undergocontinuous improvement by means ofbenchmarking. Delivery reliability hasreached a very good level.E-COMMERCE MOVES AHEADSeveral projects connected with e-commerce were launched in <strong>2000</strong>.Tikkurila signed up as a shareholder inthe BuildForum e-commerce site,which seeks to be a neutral marketplaceand a vehicle for guiding logisticschains in the construction industry.The company’s own website is beingdeveloped with the aim of providinga capability for receiving ordersover the Internet. Electronic orders alreadyrepresent a significant share ofnew business, and the possibilities ofe-commerce are also being studied bythe Purchasing Department.A PACESETTER WITHINENVIRONMENTAL AFFAIRSWithin environmental affairs, Tikkurilahas been a pacesetter in its fieldworldwide. Back in 1994 the company’senvironmental system earned itaccreditation according to the BS 7750standard, which was subsequentlychanged to the ISO 14001 certificate.All Tikkurila’s plants have either existingor pending environmental andquality assurance systems according tothe ISO series of standards.EU regulations governing the quantitiesof organic solvents which arepermissible in paints will enter intoforce in April 2001. For years nowTikkurila has anticipated forthcomingchanges in the legislation and other areasand guided its product developmentand marketing along these lines.In the autumn <strong>2000</strong>, Tikkurila Coatingsorganized training in environmentalaffairs and new technologies for itscustomers. This initiative yielded agood deal of positive feedback.PERSONNELAt the end of <strong>2000</strong> the Tikkurila Groupemployed 1,506 people, or 777 employeesless than a year ago. Of theseemployees, 769 worked in Finland.The inclusion of Alcro-Beckers fromthe beginning of 2001 will raise thenumber of personnel by about 1,100.OUTLOOK FOR THE FUTUREThe clearly defined objective withinboth decorative paints and industrialcoatings is growth and the strengtheningof Tikkurila’s chosen product areas.In the established markets this willtake place via acquisitions and also organicallyin the fast-growing marketsin Finland’s nearby areas.Tikkurila’s particular strength is itsflexibility - the ability to adjust to thedevelopments of the markets and tochanging customer structures fromtime to time. This ability will be neededin the face of ever-tougher competition,in which only the best companieswill come out on top.Tikkurila has always wanted to introducenew ways of working wheneverthese have been available. E-commerceis another area in whichTikkurila wants to be number one.The objective is to develop systemswith built-in simplicity, which are capableof serving both the companyand its customers in the best possibleway.Alcro-Beckers will strengthenTikkurila’s competitiveness even moreand this joining of forces will makethe Tikkurila Group a top-notch playerin the paint market. Both companiesare pioneers in the management of environmentalaffairs and customer relationships.This is the first step towardsthe creation of a strong Nordic paintcompany.50
Net salesNet sales%129630–3–6Operating margin, %EURmillion12001000800600400<strong>2000</strong>Capital expenditureEURmillion806040Net sales bymarket area<strong>Kemira</strong>AgroEU85 %96 97 98 99 0096 97 98 99 00200Othercountries3 %Asia 6 %Other Europe 6 %KEMIRA AGROEUR millionPRICES FINALLY HEAD UPWARDS<strong>2000</strong> 1999 1998 1997 1996Net sales 1,116 1,015 1,030 1,079 1,056Cost of sales –1,029 –990 –954 –941 –871Depreciation –64 –64 –57 –53 –59Operating income 23 –39 19 85 126Net financing expenses –17 –20 –17 –21 –23Income before extraordinary items 6 –59 2 64 103Capital invested (average) 605 663 645 602 595Return on capital invested % 5 –5 5 14 21Capital expenditure 66 47 62 48 40Personnel (average) 2,833 2,951 3,071 3,117 3,415In <strong>2000</strong> the use of plant nutrientsworldwide grew by about 2%. Theworld’s crop harvest is forecast to fallshort of the previous year’s harvest bynearly 2%. In Western Europe, <strong>Kemira</strong>Agro’s main market area, the fertilizerindustry saw major structural changes.Nearly 3 million tonnes of nitrogenfertilizer capacity and 1 million tonnesof NPK fertilizer capacity were closed.Owing to the reduced demand forproducts and to cheap imports, theWest European fertilizer industry hasclosed 30 plants over the last coupleof years. <strong>Kemira</strong> Agro closed thePernis plant in the Netherlands inJune and the Rozenburg plant, also inthe Netherlands, in December, bringingabout a total reduction of 560,000tonnes of NPK/DAP capacity andclose to 1 million tonnes of nitrogenfertilizer capacity. All these moves arebelieved to improve the health of thesector and to enable the fertilizer industryto develop as part of WesternEurope’s high quality and competitivefood supply chain.Fertilizer prices headed upwards inWestern Europe in the first quarter of<strong>2000</strong> and kept rising throughout thelatter part of the year. Prices of nitrogenfertilizers were 40-90% higher indifferent markets at the end of theyear and prices of NPK fertilizers 20-35% higher than they were a year earlier.By contrast, prices of PK fertilizersremained virtually unchanged. Competitiongot tougher in the export market,particularly for NPK products.Within raw materials, the price ofnatural gas rose sharply and this inturn lifted the price of ammonia,which is manufactured from it. In Decemberammonia cost over 80% morethan it did a year ago. All year longthe price of potassium raw materialheld fairly steady. Of phosphorus rawmaterials, the dollar price of phosphoricacid fell by 15% in the first half ofthe year.THE NEW TWO-UNIT STRATEGYImplementation of <strong>Kemira</strong>’s new strategy,in which specialty fertilizers arethe priority area for Agro, waslaunched right from the start of theyear by dividing Agro into two newstrategic business units: <strong>Kemira</strong> AgroSpecialties (KAS) and <strong>Kemira</strong> Agro Nitrogen(KAN).<strong>Kemira</strong> Agro Specialties’ objectiveis to be a preferred partner and a supplierof total solutions within the foodchain. To implement the new strategy,the parts of <strong>Kemira</strong> Chemicals whichoperate as part of the food supplychain were transferred to Agro. Animalfeed phosphates, phosphoric acid andpotassium sulphate were the businessestransferred.<strong>Kemira</strong> Agro Nitrogen operates forthe time being as part of <strong>Kemira</strong> Agroand its planning and control systems.In line with its strategy, <strong>Kemira</strong> isseeking to get out of the nitrogen fertilizerbusiness.51
KEMIRA AGRO SPECIALTIESThe strategy of KAS is to grow by offeringnovel solutions and integratedservices- for agriculture in the Baltic areaand in eastern Central Europe- for selected high value crop marketsworldwide- for selected animal nutrition marketsworldwide.This implies a clear shift from commodityfertilizers to specialty products:we are seeking to move away frommarkets where producers compete onprice alone towards markets wherecustomers and consumers have greaterpurchasing power. We also offer customizedproducts and grow-how programmesin which services form animportant part of our overall solution.We supply mainly multinutrientNPK fertilizers and fully water-solublespecialty fertilizers to global markets.Our production facilities are located inFinland, Denmark, Lithuania, China, theUnited Arab Emirates and Malaysia.The KAS unit had net sales of EUR563 million. Sales volumes remained atnearly the same level as in the previousyear. The clear improvement ofNPK prices in Western Europe did notcompensate for the price rise of themain raw material, ammonia. Therewas noticeable improvement in theBaltic markets and Poland. A factorthat lifted earnings was exports tomarkets outside Europe thanks to thestrong dollar. Sales volumes of fullywater-soluble specialty fertilizers wereup and profitability remained at agood level even though the stronggrowth in the supply of potassium nitratedepressed prices somewhat.KEMIRA AGRO NITROGENThe KAN unit is primarily a producerof nitrogen fertilizers for the West Europeanmarket and its production facilitiesare located in the Netherlands,Belgium, France and Great Britain.The unit had net sales of EUR 662million. Earnings improved stronglycompared with the previous yearthanks to the rise in nitrogen fertilizerprices. The higher price of natural gas- up 70% on the previous year - neverthelesstook a big bite out of this upside.The process chemicals business ranon an even keel. Prices rose in lockstepwith raw material costs. The businesswas developed further and in thewake of the closure of the Rozenburgplant, new purchase agreements werenegotiated.BUSINESS DEVELOPMENT ANDR&DThe bulk of the capital expenditurefunds was spent on developing thesafety and reliability of existing plantsand on reinforcing the specialty fertilizersstrategy we have chosen. Thejoint ventures that produce NPK fertilizersboth in Lithuania and in Malaysiagot up to speed and the NPK plant inZhanjiang, China, was completed inDecember, when it started up trial production.A plant that will manufacturewater-soluble urea phosphate wentinto operation in the United ArabEmirates in February 2001. The jointproject that was started together withArab Potash Company to produce potassiumnitrate and dicalcium phosphatein Jordan has moved ahead accordingto plans and production willstart up in the summer 2002.<strong>Kemira</strong> Agro’s total capital expendituresduring the past year amountedto EUR 66 million.The year saw the expansion of FarmitWebsite Oy, an Internet service developedby KAS jointly with other inputproviders. The comprehensive agriculturalportal has built up a wideuser base, and the 9,000 farmers whohad registered as club members by theend of the year represent 20% of Finland’scultivated acreage. The possibilityof utilizing this newly developedInternet product in KAS’s other marketareas will be explored during 2001.Research efforts centred on subjectsthat support the specializationstrategy. The research revolved aroundthe development of services connectedwith cultivation programmes and precisionfarming as well as specialty fertilizersfor specific crops and areas.The design of a new pilot plant thatcan be flexibly adapted to different requirementswas started. The facilitywill be completed at the Espoo researchcentre in 2001 and provide bettermeans of offering our customersfast and customized service.Research expenditure amounted toEUR 12 million, or 1.1% of net sales.NPK in Germany (15-15-15)EUR/100kg201816141290 91 93 94 95 96 97 98 99 00Ammonium nitratein the U.K.90 91 93 94 95 96 97 98 99 00GBP/t1501401301201101009080AmmoniaFOB Black Sea portC&F NWEurope95 96 97 98 99 00USD/t3002502001501005052
PERSONNEL<strong>Kemira</strong> Agro’s number of personnelhas contracted considerably in stepwith the structural transformation andoperational efficiency-boosting thathave been carried out. The headcounthas been reduced by about 200 in thespace of two years. In <strong>2000</strong> the averagenumber of personnel was 2,833.Apart from pushing ahead with thestructural transformation, we havecontinuously developed our operationstowards a process-oriented wayof working with the aim of increasingour customer focus, the personal responsibilityof all <strong>Kemira</strong> staff and thecompany’s agility in a fast-changingbusiness environment. Developing aprocess organization including relatedtraining for the personnel will be highpriorityprojects over the next fewyears.As the new strategic orientationtakes hold, we will develop skills andexpertise that support change.Global grain stocks were smaller at theend of <strong>2000</strong> than at the end of 1999.The seeded acreage for autumn cropsin the northern hemisphere was smallerthan usual owing to the poorweather. Due to the prohibition on theuse of meat and bone meal (MBM),the need for soya and cheap feedgrain in Europe is likely to increase. Itis difficult to forecast the global pricetrend of grain and other cultivatedproducts, but prices will probably holdsteady.According to an estimate by the InternationalFertilizer Association, IFA,the worldwide agricultural situationbodes well for the fertilizer business,and the demand for nutrients is set togrow by 1%. In Western Europe volumesare still declining but thanks toclosures of capacity by local fertilizerproducers and restrictions on cheapimports, supply and demand for fertilizersare in better balance than theyhave been for a long time. The prospectsfor the fertilizer business arethus favourable in our main markets.Positive expectations are alsostrengthened by the agreement betweenChina and the World TradeOrganization, WTO, which willlead to a clearer and more certainfuture for NPK exports.The biggest of the factors ofuncertainty is the trend in theUnited States economy, with itsrepercussions on the exchangerate of the dollar, as well as thetrend in energy prices aroundthe world.SAFETY AND RELIABILITYA strategic cornerstone for us is safeand reliable operations. Thanks to ongoingdevelopment projects and newworking methods that have been putinto use, the number of accidents hasdeclined steadily over the past fouryears. We are continuing to implementour new safety policy and to improveour operations further. In addition,starting new joint ventures and liftingthe reliability of their operations quicklyto the target level are challengesthat we have taken up.OUTLOOK FOR THE FUTURE53
<strong>Kemira</strong>Metalkat<strong>Kemira</strong> Metalkat posted good earnings.Both net sales and operating incomewere above budget. This was attributableto the better than forecast demandfor models that are being droppedfrom the production programme aswell as to the fast start-up ofdeliveries for new carmodels.Net sales consistedmainly of deliveriesof catalyticconvertersto the Europeanautomotive industry.Deliveriesoutside theautomotive industryfor motorcycles,chain sawsand other smallcombustion enginesare continuing to grow,and products are also being deliveredto North America and Asia. Metalkathas a share of about 20% of the worldmarket for metallic catalytic converters.During the year <strong>Kemira</strong> Metalkatestablished a joint venture in Romaniato improve its service for the local automotiveindustry. A joint venture wasalso set up in Germany with the objectiveof starting and developing e-commerce.Towards the end of the year,rights to the metallic ECOCAT catalyticconverter substrate were purchased.With the start-up of production in2001, this purchase will furtherstrengthen <strong>Kemira</strong> Metalkat’s positionas a supplier of metallic catalytic converters.Demand for products that improvethe state of the environment will increaseas emission norms become globalin scope. <strong>Kemira</strong> Metalkat has anextensive product range and knowhow,making it well placed to developthe business in coming years. Net salesand earnings in 2001 are expected tobe at a slightly lower lever.<strong>Kemira</strong> Oyj<strong>Kemira</strong> Oyj comprises Group managementand administration as well ascertain service functions. <strong>Kemira</strong> Oyj’snet sales consist of the saleof electricity to theGroup’s companies inFinland and to outsidecompanies.Net sales for <strong>2000</strong>were EUR 21 million(27 million),of which 40%came from outsidethe Group.The parent company’s paramounttask is the Group’s strategic management.It sets objectives for the Groupand the subsidiaries, defines operatingprinciples and contributes to exploitingthe Group’s internal synergies. Inaddition to the energy business, theparent company handles the Group’sfinancing and certain other headquartersservice functions.<strong>Kemira</strong> Oyj employed 120 (132)people in the average.54
An evolving corporate cultureMajor changes took place in <strong>Kemira</strong>’stop management at the beginning of<strong>2000</strong>: a new non-executive Board ofDirectors and a new CEO took over.This led to major decisions that willhave a significant bearing not only onthe structure of the Group’s business areasbut also on its corporate culture.During the year <strong>Kemira</strong>’s vision and itsGroup-wide values and key competencieswere defined (p. 4). Virtually everymember of the <strong>Kemira</strong> team had an opportunityto take part in this process,mainly by way of intranet dialogue pagesand discussions that were arrangedin small groups at different sites.KEMIRA’S CORE VALUESRESPECT FOR INDIVIDUALSAll our interpersonal dealings arebased on a respect for fairness, honesty,openness and trust. We encourageparticipation, networking and communicating.INNOVATIONWe seek innovative solutions, productsand services and combine them in anew way. We encourage individualthinking.TEAMWORKCooperation with our customers andwithin <strong>Kemira</strong> underpins our operations.We foster cooperation that goesbeyond organizational and culturalboundaries. We encourage the sharingof information and adopting the bestworking practices.FOCUSED ON RESULTSOur efforts are directed at achievingever-improving financial performance.We set high goals in everything we doand strive for a win-win relationship inour dealings with customers.THE KEMIRA SCORECARDAt the beginning of <strong>2000</strong> <strong>Kemira</strong> decidedto go over, step by step, to a strategicmanagement system based on theBalanced Scorecard method. The newsystem was named the <strong>Kemira</strong> Scorecard.During <strong>2000</strong> the Group and itsstrategic business units have developedtheir own scorecards, drawing on thestrategic objectives of the Group and itsbusiness units. Use of the managementmethod based on the <strong>Kemira</strong> Scorecardwill be expanded and amplified acrossGroup units during 2001.The <strong>Kemira</strong> Scorecard is a strategicmanagement system whose aim is todescribe the path we must take to fulfil<strong>Kemira</strong>’s strategy and to realize thecompany’s vision. The scorecard is aneffective tool for communicating thecompany’s vision and strategy to theentire organization. It enables the objectivesand efforts of the Group andthe strategic business units to be unitedand aligned, whilst also integrating theannual plans into the long-term plans.The <strong>Kemira</strong> Scorecard provides ameans of ensuring the company’s balanceddevelopment by defining the keyfactors of success for the four subareasof prime importance for the Group’s future,by formulating the practical actionplans needed to implement the strategy,by selecting the benchmarks thatwill be used in tracking the developmentand by agreeing on challengingtarget values for them. The <strong>Kemira</strong>Scorecard embodies four critical perspectives:finance, customers, operationalprocesses and human resources.The key success factors that havebeen singled out for the Group fromthe financial perspective are profitablegrowth, the efficiency of capitalemployed and the capital structure.The financial benchmarks used in the<strong>Kemira</strong> Scorecard are presented ingreater detail on page 4. From thecustomer perspective, the Group’scentral success factors are renewal ofthe Group’s business and developmentof the environmental business.At the Group level, the key successfactors that have been identified fromthe process viewpoint are occupationalsafety, excellence in daily operationsand a far-reaching overhaulof our organizations. The keysuccess factors that have beenselected from the human resourcesperspective are thedevelopment of interactionand management, a revitalizedcorporate cultureand a recasting of theGroup’s external profile.HUMAN RESOURCESDEVELOPMENTBy the end of last year, 170 supervisorsor experts from different parts ofthe <strong>Kemira</strong> organization were participatingin the <strong>Kemira</strong> Excellence byYou (KEY) management developmentprogramme, which was launched in1998. The programme is a flexible developmentsyllabus comprising ninestudy weeks. In addition to commonmodules that promote internal networking,the programme comprises asection based on an individual developmentplan. At the same time, theprogramme reinforces a culture oflearning in which each and every employeebears responsibility for theirown development, drawing on thecompany’s resources.At the top management level, theGroup started up a developmentproject comprising both individual developmentfor the target group as awhole and specific elements for managementteams.<strong>Kemira</strong> is carrying out a Groupwideshift to a process-based organization,and this change is also beingsupported through training initiatives.By means of development discussions,we ensure that every employeereceives feedback on his or her performance,knows their objectives andfollows a planned course of development.The objective over the next fewyears is to improve the quality of thediscussions and to involve the entirepersonnel in them.55
<strong>Kemira</strong> group environmental report <strong>2000</strong>INTRODUCTION AND PURPOSEThe eighth annual environmental reportby <strong>Kemira</strong> reviews the most importantdevelopments in <strong>2000</strong>. The reportalso contains information on safety,energy, and social responsibility.The report has been prepared inaccordance with the relevant Europeanreporting and accounting guidelines1 and deals with <strong>Kemira</strong> Groupcompanies in line with financial reporting.SUMMARYPortfolio changes resulted in substantialreductions in most of the Group’senvironmental releases. The declinewas particularly prominent in wastewater discharges. Amounts of hazardouswaste dropped, while non-hazardouswaste generation increased slightly.There was increased activity in thearea of environmental site assessmentsand remedial planning.Capital expenditures on environmentalprotection declined further, byabout 30% from the previous year.Even more significant was the reductionin environmental operating costs,dropping by about 25%, mainly due todivestments of businesses.Sales of environmental productsand services totaled EUR 340 million,up 10% on a comparable basis. Decisive,long-term efforts have doubledthis business across <strong>Kemira</strong> in less than10 years.There were no major industrial accidentsor environmental spills, althoughone regrettable fatal accidentoccurred.<strong>Kemira</strong> published its new visionand values. The Group’s redefinedcore competencies sharpen the environmentalstrategy. A new BalancedScorecard system was adopted formeasuring progress also in HSE issues.Many new sites obtained ISO 14001certificates or were actively developingenvironmental and safety managementsystems. In Finland, <strong>Kemira</strong> again receivedan award for good public environmentalreporting.ENVIRONMENTAL STRATEGYImplementation of the new corporatestrategy was the dominant theme of<strong>Kemira</strong> during the year. <strong>Kemira</strong>’s redefinedcore businesses include many environmentalproducts and services, especiallyto the pulp and paper, watertreatment and paint and coating sectors.<strong>Kemira</strong> aims to be a leading serviceprovider in these fields, and has ambitiousgrowth targets. The selected corebusinesses are based on key competencies,among which water chemistry andtechnology, environmental expertiseand recycling play a crucial role.As anticipated last year, the divestmentof part of the titanium dioxidebusiness and the pending divestmentof nitrogen fertilizers are changing theGroup portfolio, giving it an environmentallylighter orientation. Further reductionsin various releases, energy intensityand costs are thus expected.ENVIRONMENTAL POLICY ANDMANAGEMENT SYSTEMSTo respond to external and internaldevelopments, <strong>Kemira</strong> strengthenedresources in safety and chemicals management.The Group also introduced anew Balanced Scorecard system whichincludes management targets for safetyand environment.Within <strong>Kemira</strong> Chemicals, the Ouluplant obtained an ISO 14001 certificatein November. The Industrial Chemicalsbusiness unit received similar approvalcovering its operations in Helsingborg.The Siilinjärvi and Kokkola plantsin Finland are getting ready with ISO14001 in 2001. Building of the ISRS InternationalSafety Rating System waslaunched at the Vaasa and Ouluplants.Kemwater made progress withsafety rating systems and ISO 14001preparations of several units. <strong>Kemira</strong>Pigments conducted a baseline ISRSaudit in Pori, Finland. Many sites werecompleting the procedures accordingto the Seveso regulations.<strong>Kemira</strong> Agro’s Tertre plant obtainedISO 14001 certification inMarch. All the Finnish units continuedtheir preparations for gaining certificationin 2001 and for finalizing the safetydeclarations based on the Sevesoregulations.Alcro-Beckers, the paints businessrecently integrated into Tikkurila, haslong been active in environmental managementand has adopted a challengingenvironmental policy. The company alreadyhas ISO 14001 in place at themain Lövsholm site in Stockholm, aswell as one of the first EMAS schemesin the paints business at the smallerunit at Ansbach, Germany.ENVIRONMENT PROTECTION ATTHE PRODUCTION PLANTS<strong>Kemira</strong> Chemicals. The Helsingborgplant in Sweden reduced odorousemissions from dicalcium phosphateproduction and improved acid storagesafety. The company also conductedextensive investigations on the unexpectedlydiscovered releases of chlorinatedorganic compounds, including1CEFIC (European Chemical Industry Council): Health, Safety and Environmental <strong>Report</strong>ing Guidelines. November 1998.“Communication on the Interpretation of Certain Articles in the Fourth and Seventh Accounting directives.” European Commission, 98/C 16/04.Environmental load and net salesThe environment index consists of seven different releases and of nonhazardouswaste.Net sales indexEnvironment index%12010080604020090 91 92 93 94 95 96 97 98 99 00Energy consumptiondivided by net salestoe/EUR million100090080070060050040030020010001995 1996 1997 1998 1999 <strong>2000</strong>Greenhouse gas emissionsN 2OCO 1000 tonnes CO 2 eq.280001995 1996 1997 1998 1999 <strong>2000</strong>70006000500040003000<strong>2000</strong>1000056
dioxins and hexachlorobenzene, fromthe inorganic process. After clarifyingthe sources and formation of thesecompounds, an activated carbon filtrationsystem is being installed to eliminatethe impurities. In addition, rawmaterials were changed and a temporaryactivated carbon filter was placedin use to purify hydrochloric acid andwaste water. An external expert assessmentconfirmed that the releases havenot caused significant risk to public oroccupational health. The public wasinformed in an open manner as soonas reliable data was available.Within hydrogen peroxide production,the Ulsan plant in South Koreareduced hazardous waste from aromaticsolvent use by making operationalimprovements, and assessed the odoursituation at the site. The Maitland plantin Canada had no major environmentalchanges, but passed a waste managementaudit. The Rozenburg peroxideplant improved waste water treatmentand noise control. Preparations werealso made to reduce VOC emissionsfurther to meet the regulatory requirementsand to recycle aluminium oxidewaste to the supplier.The Kemwater business unit furtherreduced filtrate waste at Närke, Sweden.The Prerov plant in the Czech Republicexpanded production based onsecondary raw materials. Complete rebuildingof the Rheinberg plant includedinstallation of modern environmentaltechnology. At the Police plant inPoland, the hydrochloric acid scrubberwas modernized. At Goole, UK, a newdust extraction system was installedand the scrubber efficiency was testedfor SO 2 and particles. The Yixing plantin China carried out improvements inscrubbing systems, water recycling andfiltrate waste reduction.In Finland, production increases atthe Vaasa plants coincided with a reductionin VOC emissions by replacingmethanol as a solvent. A minor occasionalrelease of sulphur dioxide andhydrochloric acid occurred in November.Surveys of the contamination inthe sediment of the nearby small lakewere completed, as well as an evaluationof alternative remediation technologies.A detailed remediation plan isin preparation.The Oulu plants investigated soottreatment methods and possibilities ofco-incineration with peat. In addition,a risk assessment of the soot storageareas was conducted. At the Siilinjärviplants, record production wasachieved in mining and phosphoricacid production without major changesin the releases into the environment.The frequency of occupationalincidents was the lowest observed.The Kokkola plant completed extensiveinvestigations of the releases ofchlorinated organics from the productionof potassium sulphate and calciumchloride, simultaneously withthose reported for Helsingborg above.An activated carbon filtration system isbeing installed to remove the impuritiesfrom the acid and all subsequentenvironmental mass streams (mainlyair emissions). The investment cost isapproximately EUR 1.3 million.In addition, external expert studiesconfirmed that the impurity releaseshave not caused significant risk topublic or occupational health, and thatthe concentrations of organochlorinecompounds are not significantly elevatedin the sea sediment outside theKokkola plant area. Further investigationsare pending for the on-site storageareas of the inorganic sludge.The <strong>Kemira</strong> Fine Chemicals plant,located at the same Kokkola site, investedin additional continuous monitoringinstruments for the on-site incinerator,with the aim of meeting toughnew regulations. VOC releases from ascrubber, caused by recent processchanges, will be eliminated by thermaltreatment in the incinerator. Tests werealso made for developing a new methodof monitoring the eco-toxicity ofthe plant’s waste water.<strong>Kemira</strong> Pigments. The Pori plantfocused on safety management andenergy efficiency. The specific energyconsumption decreased by 6%, andthe plant started supplying distric heatto nearby residential areas. The wastewater treatment systems performed excellently,and an application to movethe discharge point closer to the shoreis pending. The plant also solved theNOx non-compliance issues by investingin technical modifications of thePyroflow power plant. Construction ofthe new gypsum landfill was continued.<strong>Kemira</strong> Agro. The Uusikaupunkiplant invested in energy efficiency togetherwith a local district heatingcompany in order to expand the utilizationof process energy from the nitricacid plant. This reduces the localuse of heavy fuel oil substantially. Theplant also investigated nitrous oxidemonitoring techniques and made plansfor increased recycling of nitrogen-richwaste waters.The Harjavalta plant further reducedwaste from off-spec productsand packaging. A soil survey was conductedfor the whole site, partly inconnection with the sale of a parcel ofundeveloped land. Emergency containmentwas built for the aluminiumsulphate plant.The Kedainiai plant in Lithuania in-Sulphur emissionsAll sulphur compounds calculated as SO 2 .Other countriesFinland80 90 91 92 93 94 95 96 97 98 99 00Tonnes4500040000350003000025000<strong>2000</strong>0150001000050000Heavy metal dischargesSum of five different heavy metals, mostly chromium.Tonnes5040302010090 91 92 93 94 95 96 97 98 99 00Phosphorus dischargesOther countriesFinland94 95 96 97 98 99 00Tonnes2500<strong>2000</strong>15001000500057
stalled a monitoring system for hydrogenfluoride and hydrogen chlorideemissions. The plant also increased therecycling of silicofluoric acid and water,as well as the use of recycled rawmaterials. A sulphuric acid storagetank was equipped with new safetycontainment.Investment to improve the evaporationand crystallization systems ofthe potassium nitrate plant in Fredericia,Denmark, will boost energy efficiencyand reduce associated releases.The site also investigated the potentialimpacts of cooling water discharges,and possibilities of minimizing anycadmium impurity releases into themunicipal sewage system and sludge.Closing of the two major Agro sitesin the Netherlands in July (Pernis) andDecember (Rozenburg) also reducedsubstantially corporate totals for manyreleases, although this will be fully reflectedin the figures of year 2001.There were no major incidents at thesesites, and environment-related demolitionactivities will be continued.In Belgium, the Tertre plant installednon-catalytic equipment to reducenitrogen oxide emissions of theammonia plant by one half. Surveyswere made of noise levels at the siteand of ground water contaminationdue to past activities of several companiesin the whole industrial area.In the UK, the Ince plant had a relativelystable year in environmentalprotection and safety, apart from majormaintenance shutdowns which reducedannual releases to some extent.A new unit was installed to removeNOx from the flue gases of the ammoniaplant’s primary reformer.Tikkurila. Divestment of the CPSbusiness reduced the number of productionunits, but did not essentiallychange the overall environmental situation.The new plant in Moscow employstechnology comparable toTikkurila’s other modern plants.At Vantaa, Finland, Tikkurila completeddevelopment of washing watertreatment to remove zinc, and continuedwith the optimization of raw materialuse in milling. In the UK, VOCemissions were reduced at the twocoating plants, together with improvementsin washing systems. Minor remedialactivities were conducted atthree Tikkurila sites to eliminate solventcontamination in the soil.PRODUCT DEVELOPMENT ANDENVIRONMENT BUSINESSNet sales of environment-related productswere boosted to EUR 340 million,despite the divestment of the safetybusiness which had been partly includedin this category. A good 10% annualgrowth curve was maintained on acomparable basis. The biggest stepswere taken in water treatment, pulp &paper chemicals, environmental equipment,and by introducing new environmentalchemicals onto the market.At <strong>Kemira</strong> Chemicals, the sales ofhydrogen peroxide and its environmentallybenign derivatives grewmarkedly. The production of sodiumpercarbonate increased, and sales ofthe recently launched Freezium andMeltium products had a promisingstart. All these products are environmentallysound alternatives to existingapplications.The geographical expansion ofKemwater continued on all continents,resulting in 7% growth in net sales onthe previous year. New competencecentres were established for recyclingin Helsingborg and for water researchin Oulu. Furthermore, Kemwater ServicesOy was established as a joint venturetogether with Helsingin Vesi, thewater research company of the city, fordeveloping municipal water services.<strong>Kemira</strong> Metalkat boosted sales ofmetallic catalytic converters by about14%, both to cars and off-road applications.However, due to the divestmentof the safety business, the overall salesof environmental equipment declinedby approximately 17%.Sales of co-products and productsdeveloped from waste decreased byabout 11% mainly due to business divestmentsand the closing of smallscaleproduction. Meanwhile, <strong>Kemira</strong>Agro stepped up its sales of biocontrolproducts and increased the use of recycledfertilizer raw materials.Tikkurila Paints continued R&D effortson low-emission, safe interiorpaints, as well as on durable, waterborneexterior applications. TikkurilaCoatings concentrated on high-solidsapplications for the metal industry andestablished a customer service centrefor the wood working industry, wherewater-based UV-hardening productsare becoming an increasingly attractivealternative. Alcro-Beckers has for along time been the market leader inenvironmental applications in Sweden.Notably, it offers an extensive range ofeco-labelled products.DATA 2 ON ENVIRONMENTALRELEASES, WASTE, ENERGY ANDSAFETYThe overall production volumes declinedby more than 10% from the previousyear due to business divestmentsand plant closures in the titanium dioxideand fertilizer businesses. Twomajor plants were sold and two2The data in this report have been compiled from statistics from many sites and sources. Whilst every effort has been made to ensure that theinformation is neither incomplete nor misleading, it cannot be considered as reliable as the financial data published in the <strong>Annual</strong> <strong>Report</strong>.Lost time accidentsNumber of accidents per millionworking hours302520151050Non-hazardous wasteHazardous waste treatment in <strong>2000</strong>On-siteOff-siteIncinerationTonnes25000<strong>2000</strong>0150001000095 96 97 98 99 00Other countriesFinland1000By-product/waste*, Finlandtonnes2500<strong>2000</strong>15001000500090 91 92 93 94 95 96 97 98 99 00* Comprises two (90-99 three) material streams, which are piled on site inFinland. The classification as waste is a matter of interpretation.Final disposalRecyclingOthertreatmentOn-site incineration is not reported in the data table aswaste which is finally disposed of.5000058
closed. The sold sites have been excludedfrom the environmental datafor <strong>2000</strong>, and half-year estimates havebeen made for the Pernis plant. Onemedium-sized plant and a number ofsmall plants are included in the figuresfor the first time. These changes explainmost of the variations in Groupleveltotals, since big environmentalprojects were not carried out.Total energy consumption decreasedby about 11%. This mainly reflectsthe Group’s move towards a lessenergy intensive portfolio, since thenet sales of the Group only declinedby less than two percent.A drastic reduction was experiencedin the waste water volumes andpractically all measured discharges.This is explained by the divestmentsand closures of plants with relativelyhigh waste water loads.The changes were more moderatein air pollution control. Emission reductionsof 5-25% were typical, notablythose of sulphur dioxide. Volatileorganics, originating mainly from thepaint businesses, also diminished further.Hazardous waste generationdropped to record low levels becauseof business divestments and the completionof two bigger remedialprojects. These changes are shown especiallyin the amounts of landfilling.Non-hazardous waste generation increasedslightly. Here the effect of divestmentsand closures was counterbalancedby high production levels atkey sites with large-scale piling of coproductsand waste.To summarize, the environment indexof the Group went down to an alltime-low,by dropping 5 percentagepoints from the previous year. Anoverall improvement of close to 60%has thus taken place since 1990. Furtherimprovement is expected nextyear, depending mainly on plannedbusiness transactions.ENVIRONMENTAL INVESTMENTSAND OPERATING COSTSCapital spending on environmentalprotection declined further, by about30% to EUR 9 million, or about 4% ofall investments. No significant investmentprojects were carried out.More importantly, the environmentaloperating costs dropped by 25% toEUR 39 million largely due to businessdivestments. The situation was fairlystable at most sites.Environmental costs totalled EUR48 million, down one quarter from theprevious year. These costs correspondto 1.9% (2.6%) of Group net sales, asignificantly lower figure than thoseobserved throughout the 90s. Thechange was expected, and is a sign ofprogress in the Group’s portfolio restructuring.ENVIRONMENTAL RISKS,LIABILITIES AND LEGAL ISSUESCompliance and permits. Overall compliancewith site-level permit conditionswas satisfactory in <strong>2000</strong>. A noncompliancesituation was observed atfive sites. The authorities have beeninformed and corrective actions havebeen taken.The number of significant new environmentalpermits issued by the authoritieswas lower than last year. Twosites submitted new permits due to essentialchanges in information on releases,and all sites in Finland aremaking preparations for permit applicationsin accordance with the newEnvironmental Protection Act. At Fredericia,Denmark, conditions in the finalpermit obtained require investments innoise control. No significant difficultieswere encountered in obtaining thenecessary environmental permits fornew production, or to expand or continueexisting industrial operations.The waste management permit forthe Siilinjärvi plant in Finland is stillsubject to an appeal in the SupremeAdministrative Court. The permit specifiessignificant requirements concerningfuture measures in the piling andrehabilitation of by-products andwaste. The outcome of this case cannotyet be fully predicted. The correspondingpermit of the Pori plant alsorequires future rehabilitation measures,for which plans will be submitted later.Accidents, occasional releases andenvironmental impacts. The frequencyof industrial accidents and major environmentalincidents decreased fromthe previous year.Lost-time accidents were at thesame level as the last years best annualrecord obtained so far, but considerablytighter internal targets have beenset. One regrettable fatal accident occurredon 11 January <strong>2000</strong> at the<strong>Kemira</strong> Agro Uusikaupunki plant inFinland (see the 1999 report for details),and investigations by the authoritiesare still pending.The following cases caused somelocal impacts or concern:- Occasional stack releases of yellowsmoke and dust caused some localcomplaints at Fredericia, Denmark.- Two occasional releases, consistingof gypsum dust and sulphuric aciddroplets caused some nuisance anddamage to cars at the Pori plant.- Limited fires at Siilinjärvi, Ouluand Helsingborg caused some materialEnvironmental capitalspending and operating costsOperating costsEUR millionCapital spending605040302010090 91 92 93 94 95 96 97 98 99 00Growth of environmental businessEUR million35030025020015010050093 94 95 96 97 98 99 00Sales of environment relatedproducts in <strong>2000</strong>Eco-productsWaste recyclingEquipmentEnvironmentalchemicals1 %4 %12 %83 %Total caEUR 340 million59
damage and short production interruptions.- Contamination of cooling watertowers with bacteria (Legionella) wasobserved at Rozenburg, leading to immediatecorrective action and occupationalsafety measures. The episodecaused no local health effects, butsome public discussion followed.- A shock wave and minor fire inone of the Uusikaupunki plant unitsinjured one employee, and causedsmoke formation and minor materialdamage.The reported spills and accidentsdid not cause significant environmentalimpacts outside the plant areas. Allaccidents were investigated in detailand reported to the authorities, andappropriate insurance procedures havebeen undertaken.The Group companies paid approximatelyEUR 0.8 million in compensationfor environment-relateddamage, mainly as specific water protectioncompensations defined by theEnvironmental Permit Agencies in Finland.Environmental liabilities. Soil andground water contamination and otherrisks associated with past activitieshave been assessed at all majorGroup-owned properties. Several complementaryinvestigations were conducted,mainly to support the increasedM&A activities.The divestment of the titanium dioxidebusiness, including one majorsite in the USA and one in the Netherlands,was subject to detailed due diligenceinvestigations. As defined in therelevant agreements, <strong>Kemira</strong>’s risk offuture environmental liabilities fromthese activities is limited, and appropriateprovisions have been made.Other completed business divestmentswere also subject to environmentaldue diligence, but no material issueswere identified. Preparations connectedwith the pending divestment of nitrogenfertilizer operations includedenvironmental site assessments of 12industrial properties in Europe.Completed business acquisitions orplant closures did not change environmentalliabilities significantly in <strong>2000</strong>. Adetailed environmental assessment ofthe paint businesses which were acquiredat the end of the year is pending.At present, there is a requirementor commitment to undertake a limitedclean-up at four sites, and appropriateprovisions have been made. The totalamount provided for future remedialaction was increased due to developmentsat Tertre and Willebroek, Belgium.Remedial action or demolitionwere carried out at five sites. The costsof current clean-up activities are reportedas environmental operatingcosts (see above). The Group alsocontinued to build up a reserve for unforeseenremediation costs.Investigations of arsenic and otherimpurities in the sediment of the smalllake near the Vaasa plants were completed,followed by an evaluation of alternativeremedial technologies. Afterpreliminary discussions with the competentauthorities, an action plan willbe finalized in early 2001, includinglimited dredging operations and landfilling.Final estimates of the costs to<strong>Kemira</strong> and of the schedule are not yetavailable.Unexpected detection of chlorinatedorganic compounds at Kokkola andHelsingborg were dealt with by carryingout extensive investigations (seeabove). Investment projects, totallingc. EUR 2.6 million, are in progresswith the aim of eliminating the impurities.The releases have not caused significantrisk to public health or environmentaldamage close to the plants.Investigations of on-site landfilling ofwaste are continuing.At Tertre, Belgium, ground watercontamination with inorganic compoundswas observed in a survey conductedby external experts. The contaminationis of historic origin andmany potentially responsible partiesexist. The contamination has notcaused significant damage to third parties,and at present there are no detailedplans or requirements for remedialaction. The eventual costs to<strong>Kemira</strong> cannot yet be estimated.Legal cases. There were no significantenvironmental legal cases pendingagainst Group companies. A finewas set by the authorities in Dordrecht,the Netherlands, to improvethe plant’s chemical storage safety.Environmental taxes and fees. Environment-basedtaxes totaled EUR 11million calculated on a net basis, withno practical change from 1999.VALUES, SOCIAL RESPONSIBILITY,PUBLIC COMMUNICATIONFollowing extensive value discussionswithin the Group, <strong>Kemira</strong> preparedand launched a new set of companyvalues and the Group’s vision. Thenew values emphasize respect for people,increased networking across organizationaland cultural borders, andinnovation to improve the quality oflife. We believe these values are wellin line with the recent discussions onthe transparency and social responsibilityof multinational corporations.The commitment to implement the valueswill be a long-term, global challengefor us. Steps are being taken tomodify the corporate code of conductand management manuals in accordancewith the principles published recently,notably by the OECD 3 .As described above, the Group alreadyhas a strong position in environmentalbusinesses. Our products andservices bring direct benefits to customersand the environment. <strong>Kemira</strong>’squality products also serve the foodsupply chain, where consumer safetyand health are of the utmost importance,as highlighted by the recentfood crises, especially in the EU.<strong>Kemira</strong> is committed to the internationalResponsible Care (RC) programmeof the international chemicalindustry. This voluntary programmealso includes indicators for measuringand improving site-level performancein respect of some aspects of social responsibility,such as occupationalhealth and safety, and training. TheGroup’s new internal training programmefor key managers also includesspecial sessions on the environment,health and safety.<strong>Kemira</strong>’s environmental managementobtained a good rating by anumber of ethical investment bodies.Nevertheless, <strong>Kemira</strong> was removedfrom the Dow Jones SustainabilityGroup index, solely on the basis of thesize of market capitalization. In thefield of public environmental communication,<strong>Kemira</strong> achieved again aaward for good annual environmentalreporting in Finland in a comparisonof publicly listed companies. In connectionwith <strong>Kemira</strong>’s 80th anniversary,the company donated a professorshipin water treatment to the Universityof Oulu, Finland.The following web pages of<strong>Kemira</strong> Group companies contain additional,business-specific environmentalinformation:http://kc.kemira.comwww.tikkurila.fiwww.kemira-agro.com3Principles of Corporate Governance. OECD1999.60
ENVIRONMENTAL DATA FOR THE KEMIRA GROUP1990 1997 1998 1999 <strong>2000</strong>Releases into water, tonnesChemical Oxygen Demand (COD) 1 •• 5,616 5,694 5,397 749Nitrogen (N) 2,500 1,121 1,163 1,019 948Phosphorus (P) 2 4,952 1,993 1,933 1,967 1,176Suspended solids, 1,000 tonnes 2 934 841 799 773 403Metals (Hg+Cd+Pb+Cr+As) 49 12 10 5,3 0,9Metals (Hg+Cd+Pb+Cr+As+Cu+Ni+Zn) 12 48 66,8 6,8Releases into air, tonnesParticulates 1,950 1,364 896 936 895Sulphur dioxide (SO 2) 3 23,138 5,765 5,630 5,687 4,359Nitrogen oxide (NO 2) 4 8,546 6,202 5,840 5,951 5,455Carbon dioxide (CO 2), 1,000 tonnes 3,508 3,326 3,344 2,992Volatile organics (VOC) 5 •• 369 374 321 298Volatile inorganics (VIC) 6 •• 3,508 3,152 2,594 2,663Waste 7, tonnesHazardous waste, total 8,669 8,153 8,795 26,092 5,719– Off-site landfill •• 4,274 5,117 19,479 518– Off-site incinertion •• 1,845 2,926 5,630 4,292– On-site landfill •• 362 375 118 0– other treatment •• 1,672 377 864 909Non-hazardous, 1,000 tonnes 2,254 2,308 2,278 2,170 2,277Natural resourcesFuel consumption, ktoe 8 1,791 1,777 1,773 1,571Purchased electricity, TJ 5,500 5,700 5,800 5,300Total, ktoe 2,148 2,146 2,150 1,913Cooling water volume, million m 3 , appr. 399 393 398 387Waste water volume, million m 3 , appr. 78 82 76 34SafetyNumber of incidents 9 permillion working hours 18.2 16.3 12.7 12.7Reference data, EUR millionGroup net sales 2,087 2,420 2,413 2,526 2,486Environmental capital expenditure 31.1 18.5 15.0 12.6 8.9Environmental operating costs 32.3 49.8 48.8 52.6 39.3Total environmental costs, % of net sales 3.0 2.8 2.6 2.6 1.9*1Estimate. In this case, mainly caused by inorganic discharges,and hence not a very relevant parameter for the Group.2Originates mostly from phosphogypsum.3All sulphur compounds calculated as SO 2.4Nitric oxide and nitrogen dioxide calculated as NO 2.5VOC is a sum of volatile organic compounds.6Sum of ammonia, hydrogen chloride and six other simpleinorganic compounds, mostly ammonia in this case.7Waste as defined in EU legislation. <strong>Report</strong>ed figures do not includemining by-products, on-site incineration, waste which isfurther processed into products at the sites, or sold as a coproductto external recycling. Figures are on wet basis.81,000 tonnes of oil equivalent. Includes fuel as a raw material.9Accidents causing an employee absence of at least one day(LTA1).Includes half year estimates from one major site.*61
VERIFICATION STATEMENTAt the request of <strong>Kemira</strong>, we have reviewed the basis of the “<strong>Kemira</strong> Group Environmental <strong>Report</strong><strong>2000</strong>”. The report is the responsibility of and has been approved by the Board of Directors of <strong>Kemira</strong>Oyj. The inherent limitations of completeness and the accuracy of the data are set out in the report.Our review has consisted of the following procedures:– making enquiries of management responsible for compiling the report;– an examination of relevant supporting information;– review in more detail of the systems for gathering and reporting environmental data atoperating level at one site outside Finland and two sites in Finland, selected by us.Based on our review we are assured that:– the statements made in the report are supported by underlying information;– the data has been properly collated from information provided by the sites;– for the three sites visited, data has been properly extracted from their information systems.The report has been prepared in line with the CEFIC Health, Safety and Environmental <strong>Report</strong>ingGuidelines, excluding information on occupational illnesses and distribution incidents. <strong>Kemira</strong>’sapproach to reporting continues to be in line with the European Commission interpretativecommunication concerning certain articles of the fourth and seventh Council Directives on accountingand, where appropriate, meets the requirements of International Accounting Standard IAS 37Provisions, Contingent Liabilities and Contingent Assets. It is our opinion that the <strong>Kemira</strong> GroupEnvironmental <strong>Report</strong> <strong>2000</strong> gives, in all material respects, a fair and balanced view on the group’senvironmental performance.Helsinki, 12 February 2001KPMG WIDERI OY ABHannu NiilekseläAuthorized Public AccountantMikael NiskalaManager, Sustainability AssuranceInvestment analysisThe following banks and brokerage firms are known tohave prepared an investment analysis of <strong>Kemira</strong> in <strong>2000</strong>:Mandatum Pankkiiriliike Oywww.mandatum.fiTel. +358 9 166 721Alfred Berg Suomi Oywww.alfredberg.fiTel. +358 9 228 321ArosMaizels Equities Oywww.arossecurities.comTel. +358 9 173 371Conventum Securities Ltdwww.conventum.fiTel. +358 9 549 9300Credit Suisse First Boston (Europe) Ltdwww.csfb.comTel. +44 20 7888 8888D. Carnegie Ab Finlandwww.carnegie.fiTel. +358 9 6187 1200Commerzbankwww.commerzbankib.comTel. +49 69 1362 4341Deutsche Bank Ag Londonwww.db.comTel. +44 20 7545 8000Dresdner Kleinwort Bensonwww.dresdnerkb.com+44 20 7475 2431Enskilda Researchwww.equities.enskilda.seTel. +358 9 6162 8716Evli Securities Plcwww.elvi.netTel. +358 9 476 690Goldman Sachs Internationalwww.gs.comTel. +44 20 7774 1103Handelsbanken Marketswww.handelsbanken.seTel. +358 10 444 2425Merita Pankkiiriliike Oywww.merita.fiTel. +358 9 1651Merrill Lynch International Ltdwww.ml.comTel. +44 20 7772 2094Opstock Oy Pankkiiriliikewww.opstock.fiTel. +358 9 404 2669Rabobankwww.rabobank.comTel. +31 20 460 4707Schroder Salomon Smith Barneywww.ssmb.comTel. +44 20 7986 4000WestLB Research GmbHwww.westlb.comTel. +49 211 826 412662
Press releasesJANUARYThe changeover to the year <strong>2000</strong> at <strong>Kemira</strong>’ssites went according to plans. A large numberof the plants continued production withoutinterruption. Production at some of the plantscame to a halt over the turn of the year in orderto maximize safety.An internal Management Board was set upwith the task of assisting <strong>Kemira</strong>’s Board ofDirectors by carrying out preparatory work.The members are the Group division presidentsand senior vice presidents withinGroup management.<strong>Kemira</strong> announced it was exploring new cooperationmodels or ownership arrangementsfor its nitrogen fertilizer business. To this end,<strong>Kemira</strong> Agro was divided into two units:<strong>Kemira</strong> Agro Specialties and <strong>Kemira</strong> Agro Nitrogen.A plant that will manufacture components fortinting systems will be built in Shanghai, China.Start-up is scheduled for the first part of2001.FEBRUARYTop management launched a reassessment of<strong>Kemira</strong>’s core values. The entire personnelwas invited to participate in defining a set ofvalues underpinning <strong>Kemira</strong>’s operations andto sharpen the focus on future objectives.<strong>Kemira</strong> sold its titanium dioxide pigmentplants in the United States and the Netherlandsto Kerr-Mcgee Chemical Corporation ofthe United States for EUR 400 million. Thedeal generated a capital gain of EUR 149 millionbefore taxes.<strong>Kemira</strong> brought out on the market its newlydeveloped de-icing substance. MELTIUM TMdoes not contain chloride which is harmful tothe environment and it is well suited to demandingde-icing applications: at airports, onbridges, in tunnels and on roads runningthrough groundwater areas.MARCHIt was decided to increase production ofECOX sodium percarbonate at the plant inHelsingborg, Sweden. ECOX is an environmentallyfriendly bleaching agent which isused in detergents and washing-up liquids.The OOO Kraski Tikkurila paint plant thatwas built near Moscow started operations.The facility is the second paint plant in Russiathat operates according to the western model.The first is Tikkurila’s plant in St Petersburg.The entire shares outstanding in <strong>Kemira</strong> SafetyOy, which manufactures respiratory protectivedevices, were sold to the American companyScott Technologies for a price of almostEUR 17 million.To celebrate <strong>Kemira</strong>’s 80th anniversary, theGroup donated FIM 3.5 million to the Universityof Oulu to establish a new professorshipin chemical water treatment.The <strong>Kemira</strong> Group acquired a 100 % interestin the Polish paint plant Tikkurila Baltcolor,which has up to now operated as a joint venture.<strong>Kemira</strong> signed an agreement with the Russiancompany JSC Acron concerning a strategicpartnership within the fertilizer business inthe CIS countries and the Baltic Rim.MAY<strong>Kemira</strong> launched a programme to reduce environmentalreleases at its potassium sulphateplants in Helsingborg, Sweden, and Kokkola,Finland.<strong>Kemira</strong> announced its intention to wind upthe manufacture of nitrogen fertilizers in Rozenburg,the Netherlands, by the end of <strong>2000</strong>.The reason for the closure was productionovercapacity in the industry and the resultingprofitability problems.<strong>Kemira</strong> began purchasing its own shares onHelsinki Exchanges with the aim of buyingback a maximum of 4.2 % of <strong>Kemira</strong> Oyj’sentire shares outstanding. The shares can beused to pay profit and incentive bonuses oras consideration in acquisitions.JUNE<strong>Kemira</strong> bought Neste Chemicals’ paper chemicalsbusiness, which comprised Krems PaperChemicals of Austria, part of CN-Paper Chemicalsand the paper sizing business of OyChemec Ab. The purchase price was EUR 34million, and the units have aggregate netsales of EUR 35 million.Tikkurila Coatings opened a customer servicecentre and warehouse in Riga, Latvia.AUGUST<strong>Kemira</strong> acquired a 15 % interest in KemironCompanies, Inc, of the USA. The deal gave<strong>Kemira</strong> access to the world’s largest singlemarket area for water treatment chemicals.<strong>Kemira</strong> sold the Tikkurila CPS Oy tinting systembusiness. The deal was part of <strong>Kemira</strong>’slong-term strategy. The purchase price wasEUR 200 million and the divested operationsgenerate net sales of EUR 130 million.<strong>Kemira</strong> established a Recycling CompetenceCenter at the <strong>Kemira</strong> Kemi AB facility in Helsingborg.The staff at the centre will be madeup of experts in biochemistry, process technologyand logistics, and it will furthermoremaintain close contacts with technical andother universities.SEPTEMBERThe Kemwater unit acquired an aluminiumsulphate plant in the Czech Republic. Thedeal will strengthen Kemwater’s position as asupplier of coagulants for the treatment ofdrinking and waste water in the Czech Republicand its neighbouring countries.In line with its strategy, <strong>Kemira</strong> sold off itssodium tripolyphosphate business. In the detergentmarket <strong>Kemira</strong> is specializing aboveall on sodium percarbonate, which is an environmentallysound bleaching agent for use inlaundry detergents and washing-up fluids.NOVEMBER<strong>Kemira</strong> bought the business operations of Alcro-BeckersAB, Sweden’s largest decorativepaints company. Alcro-Beckers had net salesin <strong>2000</strong> of about EUR 190 million and employedabout 1,100 people. The purchaseprice was about EUR 180 million. Alcro-Beckes’main plants are located in Sweden andPoland. In addition, it has operations in Denmark,Norway, Germany and Finland.Tikkurila Coatings acquired the industrialcoatings business of Mason Coatings of theUK for about EUR 3 million.Kemwater Services Oy concluded an agreementon the development of Kosovo’s waterand sewage facilities, including training. Theobjective is to raise the level of the country’swater treatment plants and to organize follow-uptraining in the water managementfield at the university of Pristina and abroad.<strong>Kemira</strong> increased its holding in a Chinese waterchemicals joint venture and it now has a60 % stake in Kemwater (Yixing) Co. Ltd.DECEMBER<strong>Kemira</strong> purchased from Solvay Quimica a watertreatment chemicals plant located in Torrelavega,Spain.<strong>Kemira</strong>’s joint venture <strong>Kemira</strong> CompoundFertilizer began production of NPK compoundfertilizer in the city of Zhanjiang inSouthern China near the country’s importantcash crop lands.The press releases can be read in full on<strong>Kemira</strong>’s Internet pages at www.kemira.com.63
AdministrationAccording to the Articles of Associationof <strong>Kemira</strong> Oyj, the company’s affairsare managed by a SupervisoryBoard, a Board of Directors and amanaging director. One or more deputymanaging directors can be namedfor the company. The SupervisoryBoard is composed of a minimum ofeight and a maximum of ten members,all of whom are elected by the <strong>Annual</strong>General Meeting for one year at atime, counting from the <strong>Annual</strong> GeneralMeeting at which the election washeld. The <strong>Annual</strong> General Meetingelects one member as chairman and amaximum of two vice chairmen.The Board of Directors, which iselected by the Supervisory Board,comprises a minimum of four and amaximum of six members. The SupervisoryBoard elects one member aschairman and one member as vicechairman.SUPERVISORY BOARDThe task of the Supervisory Board is tooversee that the company’s affairs aremanaged according to sound businessprinciples and with a view to profitability,in observance of the regulationsof the Articles of Association, resolutionsof meetings of shareholders andother confirmed standing rules. It isthe task of the Supervisory Board todecide, within the limits indicated bythe Articles of Association, on thenumber of members of the Board ofDirectors, to appoint and dismiss themembers of the Board of Directorsand, after first hearing the Board of Directors,the managing director and executivevice presidents as well as todetermine their compensation. It alsodecides on instructions to be given tothe Board of Directors concerning mattersof wide-ranging import or whichare important in principle. A matter ofwide-ranging import is deemed to bethe opening of a new core businessarea or the complete withdrawal fromsuch an area. The Supervisory Boardgives its statement to the <strong>Annual</strong> GeneralMeeting concerning the parentcompany and consolidated financialstatements and the Auditors’ <strong>Report</strong>.The emoluments of the SupervisoryBoard are decided by the <strong>Annual</strong> GeneralMeeting.During the past financial year theSupervisory Board met six times.BOARD OF DIRECTORSThe task of the Board of Directors isto prepare matters that will be dealtwith at meetings of shareholders andmeetings of the Supervisory Board, todecide on calling a general meeting ofthe shareholders as well as to see tothe implementation of decisions of themeetings of shareholders and the SupervisoryBoard. Its task is also to appointand dismiss other officers upona proposal by the managing directorand to determine their compensation.The Board of Directors handles thoseadministrative tasks that do not belongto the Supervisory Board or whichhave not been assigned to the managingdirector or to other individuals.The Board of Directors grants andcancels authorizations to sign the company’sbusiness name. The Board ofDirectors also handles the other tasksin its competence under the CompaniesAct.The Board of Directors is responsiblefor duly organizing the company’saccounting and overseeing the managementof its funds. The Board of Directorsis also responsible for seeing toit that the company’s financial statementsgive correct and sufficient informationand that the income statementand balance sheet have been preparedin conformity with the acts and regulationsin force in Finland and followingthe Group’s uniform accounting practices,which are based on the InternationalAccounting Standards (IAS). Atits meetings the Board of Directorsdeals monthly with the reports thattrack the Company’s earnings trendand the managing director discussesthem in detail.The non-executive Board membersas a rule meet together once a yearwithout representatives of the Company’smanagement and provide an opportunityfor the auditor to discuss theCompany’s audit.The company maintains an internalcontrol system for the purpose of ensuringthe reliability of financial reportingand to provide protectionagainst significant misuse or loss ofcompany assets. The internal controlsystem is supported by approved policiesand procedures which are observedat all Group companies as wellas by an internal audit departmentwhose staff operate in accordancewith the procedures and principlesconfirmed by the Board of Directorsand in accordance with the annualplan. The department’s staff consists oftwo auditors in addition to which externalproject personnel are used. Theinternal audit staff discuss their auditprogramme and observations on arunning basis with the auditors.The Board of Directors of <strong>Kemira</strong>Oyj met 17 times during the financialyear.MANAGING DIRECTORAccording to the Articles of Association,the task of the managing directoris to manage and develop the Companyand the Group in accordance withthe instructions and regulations issuedby the Board of Directors. The managingdirector is responsible for ensuringthat the interests of the company andthe Group are taken into account atsubsidiaries and associated companiesthat are owned by the parent company.The managing director likewiseimplements the decisions of the Boardof Directors. The managing director,who is called Chief Executive Officer,of <strong>Kemira</strong> Oyj has been Tauno Pihlavasince 1 January <strong>2000</strong>. The managingdirector’s deputy has been Esa Tirkkonenfrom the same date.Persons belonging to the Company’smanagement, including partiesclosely associated with them, are notinvolved in substantial business relationshipswith the Company.The members of the <strong>Kemira</strong> Oyj Board ofDirectors in 2001 are (from the left) Sten-Olof Hansén, Ritva Hainari, Anssi Soila,Tauno Pihlava, Eija Malmivirta and NiiloPellonmaa.64
AUDITORSThe <strong>Annual</strong> General Meeting elects asauditors a minimum of one and amaximum of three auditors. One ofthe auditors must be a firm of independentpublic accountants approvedby the Central Chamber of Commerce.The auditor of <strong>Kemira</strong> Oyj is the firmof public accountants KPMG WideriOy Ab, with Hannu Niilekselä actingas chief auditor.SUPERVISORY BOARDChairman Timo Kalli, b. 1947, farmer.Member of Parliament. No <strong>Kemira</strong>shares.I Vice Chairman Kari Rajamäki, b.1948, M.Sc.(Admin.). Member of Parliament.No <strong>Kemira</strong> shares.II Vice Chairman Hanna Markkula-Kivisilta, b. 1965, M.Sc.(Pol.Sc.).Member of Parliament. No <strong>Kemira</strong>shares.Risto Ranki, b. 1948, Licentiate in PoliticalScience, B.Sc. Deputy DirectorGeneral of the Ministry of Trade andIndustry. No <strong>Kemira</strong> shares.Sirpa Hertell, b. 1955, horticulturist.Secretary General of the InternationalCouncil of Women in Finland. No<strong>Kemira</strong> shares.Pekka Kainulainen, b. 1941, Lic.Tech.Managing Director: Oy Liikkeenjohdonkoulutuskeskus Ab. Chairman of theBoard: Amer Group Plc. Vice Chairmanof the Board: YleiselektroniikkaOy. Member of the Board: Oy TalentumAb. 600 <strong>Kemira</strong> shares.Mikko Långström, b. 1940,M.Sc.(Econ.), B.Sc.(Eng.). ManagingDirector: Longinvest Oy. 11,100<strong>Kemira</strong> shares.Marjaana Koskinen, b. 1962. Memberof Parliament. No <strong>Kemira</strong> shares.Employee representatives (right of attendanceand expression of views, novoting rights):Pertti Kautto, b. 1945, safety manager.Represents managerial employees. 815<strong>Kemira</strong> shares.Jorma Luukkonen, b. 1945, work planner.Represents technical employees.500 <strong>Kemira</strong> shares.Marja-Leena Tuominen, b. 1949, headof purchasing. Salaried industrial employees’representative. No <strong>Kemira</strong>shares.Jukka Virta, b. 1942, operator. Representsworkers. 165 <strong>Kemira</strong> shares.Tauno Korhonen, b. 1946, operator.Represents workers. No <strong>Kemira</strong> shares.BOARD OF DIRECTORSChairman Sten-Olof Hansén, b. 1939,D.Sc.(Econ.). Chairman of the Board atMedinet International Oy, Vetcare Oy,Innomedica Oy. Member of the Boardat Perlos Oyj, Liikesivistysrahasto, TurunSeudun Osuuspankki. 2,605<strong>Kemira</strong> shares.Vice Chairman Niilo Pellonmaa, b.1941, M.Sc.(Econ.). Chairman of theBoard at PMJ-Automec Oyj, Rocla Oyj.Member of the Board at Finvest Oyj,Asko Oyj, Uponor Oyj, Menire Oyj.12,500 <strong>Kemira</strong> shares.Ritva Hainari, b. 1948, M.Sc.(Eng. &Econ.). Industrial Counsellor: Ministryof Trade and Industry. Member of theBoard: Patria Industries Oyj. No<strong>Kemira</strong> shares.Eija Malmivirta, b. 1941, M.Sc.(Eng.).Chairman of the Board at Merei EnergyOy Ltd. Member of the Board atVR-Group Ltd, Tosco Corporation. 500<strong>Kemira</strong> shares.Tauno Pihlava, b. 1946, M.Sc.(Eng.).Chief Executuve Officer of <strong>Kemira</strong> Oyj.3,200 <strong>Kemira</strong> shares and 80,000 shareoptions.Anssi Soila, b. 1949, M.Sc.(Eng.&Econ.). Chairman of the Board atSponda Oyj, Årcarton AB, Normet Oy,Castrum Oyj. Member of the Board atEimo Oyj, Lindström Oy. 6,000 <strong>Kemira</strong>shares.MANAGEMENT BOARDChairman Tauno Pihlava, b. 1946,M.Sc.(Eng.). Oversees Business Development,Corporate Planning, Personneland Group Communications. CEOof <strong>Kemira</strong> Group.Vice Chairman Esa Tirkkonen, b. 1949,M.Sc.(Eng.). Oversees Finance, Treasury,Information Management and Energy.Executive Vice President of<strong>Kemira</strong> Group.Anne Haggrén, b. 1951, M.Sc.(Econ.).Senior Vice President, Human Resourcesof <strong>Kemira</strong> Group from April 2001.Juhani Kari, b. 1944, LL.M. OverseesLegal Affairs, Internal Audit, Risk Managementand Environmental Management.Senior Vice President of <strong>Kemira</strong>Oyj.Timo Leppä, b. 1957, M.Sc.(Eng.),CEFA. Senior Vice President, GroupCommunications from March 2001.Visa Pekkarinen, b. 1951, M.Sc.(Econ.).Oversees Tikkurila Oy (President).Yrjö Sipilä, b. 1949, B.Sc.(Econ.). Oversees<strong>Kemira</strong> Chemicals Oy (President).Heikki Sirviö, b. 1955, M.Sc.(Eng.).Oversees <strong>Kemira</strong> Agro Oy (President).Hannu Toivonen, b. 1947, D.Sc.(Tech).Senior Vice President, Research andTechnology of <strong>Kemira</strong> Group.<strong>Kemira</strong> Oyj’s Management Board inFebruary 2001. In front, Tauno Pihlava(left) and Esa Tirkkonen, in the rear, JuhaniKari, Yrjö Sipilä, Visa Pekkarinen,Hannu Toivonen and Heikki Sirviö. Absentfrom the picture are Timo Leppä andAnne Haggrén. Mr Leppä became a memberin March 2001 and Ms Haggrén inApril.65
OTHER GROUP ADMINISTRATIONRaija Arasjärvi, b. 1957, M.Sc.(Econ.)FinanceKari Autio, b. 1945, M.Sc.(Eng.)Business DevelopmentKaj Friman, b. 1953, LL.M.,B.Sc. (Econ.)Secretary to the Supervisory Board,Board of Directors and ManagementBoardTreasuryEsa Karhula, b. 1954, M.Sc. (Econ.), M.A.Internal AuditLeena Laakso, b. 1943, M.Sc.(Eng.)Risk ManagementJukka Liimatainen b. 1946, M.Sc. (Eng.)EnergyTauno Lovén, b. 1944, M.Sc. (Econ.)Information ManagementAarno Salminen, b. 1956, M.A.Environmental ManagementCORE BUSINESSESPulp & Paper ChemicalsJuhani Lindholm, b. 1956, M.Sc. (Eng.)KemwaterLennart Johansson, b. 1960, M.Sc.(Eng.)Paints & CoatingsVisa Pekkarinen, b. 1951, M.Sc. (Econ.)Agro SpecialtiesHeikki Sirviö, b. 1955, M.Sc. (Eng.)Industrial ChemicalsHarri Kerminen, b. 1951, M.Sc. (Eng.)INSIDERSThe statutory insiders of <strong>Kemira</strong> Oyjinclude the members of the SupervisoryBoard and of the Board of Directors(see above) as well as the Chief ExecutiveOfficer (see above) and his deputy,Esa Tirkkonen (1,075 <strong>Kemira</strong>shares and 120,000 share options). Thenumbers of shares owned by insidersare according to the situation at theclose of <strong>2000</strong>.In addition, the following persons areregarded as insiders:Arasjärvi Raija, Group Controller(660 shares)Friman Kaj, Group Treasurer(1,702 shares)Juutinen Anneli, Secretary (0 shares)Kari Juhani, Senior Vice President(1,075 shares)Karonen Liisa, Secretary (0 shares)Korhonen Arja, Secretary (0 shares)Laakso Kirsti, Administrative Assistant(0 shares)Pekkarinen Visa, President(588 shares)Sipilä Yrjö, President (1,575 shares)Sirviö Heikki, President (0 shares)Toivonen Hannu, Senior Vice President,Research and Technology(1,203 shares)QUARTERLY FINANCIAL DEVELOPMENT (The figures are unaudited)EUR millionI/<strong>2000</strong> II/<strong>2000</strong> III/<strong>2000</strong> IV/<strong>2000</strong> I/1999 II/1999 III/1999 IV/1999Net sales<strong>Kemira</strong> Chemicals 182.0 183.2 191.3 210.4 172.5 172.8 169.2 182.5Tikkurila 90.1 105.8 98.1 51.3 79.0 97.1 101.7 79.7<strong>Kemira</strong> Agro 305.6 285.5 242.6 281.8 289.9 268.7 215.4 240.6<strong>Kemira</strong> Pigments 133.0 66.9 53.7 53.2 107.6 121.3 131.0 128.6Other includingeliminations –3.5 –7.6 –12.2 –25.2 –9.3 –7.5 –2.3 –12.3Total 707.2 633.8 573.5 571.5 639.7 652.4 615.0 619.1Operating income<strong>Kemira</strong> Chemicals 21.5 16.0 7.7 24.2 19.4 21.1 19.4 23.3Tikkurila 7.4 13.2 10.8 –4.3 1.9 11.2 15.3 –5.3<strong>Kemira</strong> Agro 0.4 10.6 –1.9 13.8 5.1 2.1 –14.3 –31.7<strong>Kemira</strong> Pigments 7.2 14.4 17.4 14.8 5.4 9.6 3.3 16.6Other includingeliminations –0.5 12.8 –0.3 –10.4 –2.2 –0.2 1.2 9.8Total 36.0 67.0 33.7 38.1 29.6 43.8 24.9 12.7Financing expenses 12.5 8.6 3.1 6.3 12.6 12.1 12.3 15.4Income before nonrecurringitems and taxes 23.5 58.4 30.6 31.8 17.0 31.7 12.6 –2.7Net income 16.0 82.6 76.2 33.0 11.8 19.6 8.8 –10.3Earnings per share 0.13 0.33 0.03 0.24 0.09 0.15 0.07 –0.0866
ProductionSalesAddresses<strong>Kemira</strong> OyjPorkkalankatu 3P.O. Box 330FI-00101 HelsinkiFinlandTel. +358 10 8611Fax +358 10 862 1119www.kemira.com<strong>Kemira</strong> Chemicals OyPorkkalankatu 3P.O. Box 330FI-00101 HelsinkiFinlandTel. +358 10 861 211Fax +358 10 862 1124http://kc.kemira.com/Pulp & Paper ChemicalsPorkkalankatu 3P.O. Box 330FI-00101 HelsinkiFinlandTel. +358 10 861 211Fax +358 10 862 1694http://ppc.kemira.comKemwaterIndustrigatan 83P.O. Box 902S-251 09 HelsingborgSwedenTel. +46 42 171 000Fax +46 42 130 570http://kw.kemira.comIndustrial ChemicalsPorkkalankatu 3P.O. Box 330FI-00101 HelsinkiFinlandTel. +358 10 861 211Fax +358 10 862 1124http://ic.kemira.comTikkurila OyKuninkaalantie 1P.O. Box 53FI-01301 VantaaFinlandTel. +358 9 857 721Fax +358 9 8577 6900www.tikkurila.fiTikkurila PaintsKuninkaalantie 1P.O. Box 53FI-01301 VantaaFinlandTel. +358 9 857 731Fax +358 9 8577 6902Tikkurila CoatingsKuninkaalantie 1P.O. Box 53FI-01301 VantaaFinlandTel. +358 9 857 741Fax +358 9 8577 6911Alcro-Beckers ABLövholmsgränd 12S-117 83 StockholmSwedenTel. +46 8 775 6000Fax +46 8 744 1468www.alcro-beckers.com<strong>Kemira</strong> Agro OyPorkkalankatu 3P.O. Box 330FI-00101 HelsinkiFinlandTel. 358 10 861 511Fax 358 10 862 1126www.kemira-agro.com<strong>Kemira</strong> Agro SpecialtiesPorkkalankatu 3P.O. Box 330FI-00101 HelsinkiFinlandTel. 358 10 861 511Fax 358 10 862 1126<strong>Kemira</strong> Agro NitrogenAvenue Einstein 11B-1300 WavreBelgiumTel. +32 10 232 711Fax +32 10 228 988A more complete address list can beseen on <strong>Kemira</strong>’s Internet pages atwww.kemira.com/contact_information67
GlossaryACEAgricultural, construction and earthmoving(equipment).AKD waxThe active ingredient in AKD sizing usedin paper manufacture. Sizing makes paperless water absorbing and controls its printingproperties. AKD = alkylketenedimer.Alkyd paintAn outdoor or indoor paint that is basedon an air-drying alkyd binder. Alkyd is anoil-modified polyester resin. Alkyd paintdries faster than conventional oil paint.Aluminium sulphateMainly used in the paper industry. Alsoused as a coagulant in water purification. Itis generally made from aluminium hydroxideusing sulphuric acid.AmmoniaA basic chemical that is produced fromnatural gas and is mainly a nitrogen-containingraw material in fertilizers.Ammonium nitrate (AN)A nitrogen fertilizer.AnataseA certain type of titanium dioxide pigmentused by the paper industry in particular.AuditA systematic, independent and documentedinspection or evaluation in which operationsare compared with given requirementsor guidelines. An audit can be performedby an external party or by an internalexpert.Calcium ammonium nitrate (CAN)A nitrogen fertilizer. Ammoniumnitrate into which powdered limestone ismixed as part of the production process.Calcium chlorideAn industrial salt that is made from limestoneusing hydrochloric acid. It has a varietyof uses such as in dust binding onroads, oil drilling and applications in thefood-processing industry.Can coatingsCan coatings for the beverage and food industry.The coating acts as an insulatinglayer between the food product and thecan or cap.Carbon sinkA part of the earth that permanently removescarbon dioxide from the atmosphereand binds it in organic compounds.The most important carbon sinks are theworld’s oceans and forests.CEFICThe umbrella organization of the EuropeanChemical industry (Confédération Européennedes Fédérations de l’IndustrieChimique).Chemical Oxygen Demand (COD)A quantity connected with waste waters. Itmainly serves to measure the ability of organicsubstances to consume oxygen inwater.CoagulantPrecipitates impurities in water.Coil coatingA method of coating metal sheets.Compound fertilizerA fertilizer that contains in every granule anumber of elements that are essential forplants.CPSColour Processing Systems.Diammonium phosphate (DAP)A nitrogen and phosphorus fertilizer forcrops and horticulture.Dicalcium phosphate (DCP)A raw material for animal feed, manufacturedfrom raw phosphate and limestone.ECF bleachingElemental chlorine free pulp bleaching.ECOXProduct name for sodium percarbonate.Used as detergent bleach.EHSEnvironment, Health and Safety.EMAS(Eco-Management and Audit Scheme)An environmental management system thatis based on a European Community regulation.Industrial companies can register forit voluntarily.Environmental businessThe sale of products and services that areused directly for environmental protectionor are closely related to it.Environmental chemicalA chemical that is used for environmentalprotection purposes or closely connectedto it. For example, chemicals used in treatingwaste water.Environmental disclosureA yearly report by a company on the releasescaused by its operations as well astheir environmental impacts, liabilities,costs, legislative compliance and other relatedenvironmental issues of major importance.It is becoming an increasingly integralpart of the financial reporting.Environmentalmanagement systemA company’s regular, documented descriptionof how it acts in managing environmentalaffairs. The main components arethe drawing up of an environmental policy,the setting and measuring of objectivesas well as auditing.Environmental reportA company’s public report that is free-formin terms of its content and deals with environmentalissues connected with the company’soperations. It is published eitherseparately or as part of the <strong>Annual</strong> <strong>Report</strong>at discretionary intervals.Environmental technologyEquipment used for environmental protectionpurposes.FerixProduct name. Granular ferrisulphate,a water treatment chemical.FerrichlorideAn iron-based water treatment chemical.Ferrous sulphateAn iron-based water treatment chemical ora raw material used in such chemicals. It isgenerated as a byproduct in the manufactureof titanium dioxide pigment. Alsoused in feeds.FinnTiProduct name for titanium dioxide pigment.FormamideA solvent and raw material used in thechemical and pharmaceutical industries, aderivative of formic acid.Formic acidManufactured from carbon monoxide andmethanol. Mainly used in silage additivesas well as in the textile, pharmaceuticaland rubber industries.Greenhouse gasesGases that promote heating of the atmosphere,the most important of which arecarbon dioxide, methane and laughing gas(nitrous oxide).HAZOPA risk analysis method that is used in theprocess industry to improve working methodsand the technical safety of equipment.Hydrogen peroxideA reactive oxygen chemical that is used especiallyin the environmentally soundbleaching of pulp, and also as a disinfectantand in environmental applications. Itsraw materials are hydrogen and the oxygenfound in air.Hydrophobation agentAn additive used in paper manufacture toregulate the water absorption of paper.IFAInternational Fertilizer Industry Association.IlmeniteThe raw material of titanium dioxide pigment,an ore which has a relatively lowconcentration of titanium.ISOThe International StandardsOrganization.ISO 14001An International standard that defines therequirements of an environmental managementsystem. A company or institution thatcomplies with the requirements can obtaina certificate according to the standard.KREPROThe Kemwater Recycling Process separatesmetals, heavy metals, phosphorus and carbonout from waste water sludge and recirculatesthem for useful purposes.68
LORIS (KEMIRA LORIS)(Local Resource Information System)A satellite-controlled precision farming system.Methylene ureaA slow-acting nitrogen fertilizer.Monocalcium phosphate (MCP)A feed raw material that is manufacturedusing limestone and pure phosphoric acid.Nitric acidA basic chemical that is made from ammoniaby catalytic combustion. An importantintermediale in fertilizer manufacture.Nitrogen (N)An element that is essential for the growthof plants.Nitrogen oxidesMainly nitrogen monoxide (NO) and nitrogendioxide (NO 2). Nitrogen gases that areformed as emissions in combustion and,for example, in the manufacture of nitricacid. Nitric oxides cause acidification andimpair air quality.NK fertilizerFertilizer containing nitrogen and potassium.NPK fertilizerA compound fertilizer containing nitrogen,phosphorus and potassium as its main nutrients.A number of trace elements canalso be added to it.Organic mineral fertilizerComposed of both organic substances (e.g.peat) and inorganic salts.Peracetic acidA reactive acid chemical that is used in theenvironmentally sound bleaching of pulp.PhosphateA phosphorus compound which occurs innatural ores and is used as a raw materialin fertilizers, animal feeds and detergents.PhosphogypsumA gypsum that is formed as a byproduct inthe manufacture of phosphoric acid.Phosphoric acidAn acid that is manufactured from phosphateconcentrate using sulphuric acid andis used as a raw material in products suchas compound fertilizers, feed phosphates,detergents and processed foods.Phosphorus (P)An element that is essential for life. One ofthe three main nutrients in fertilizers. It isobtained by processing phosphate-containingores.Pickling liquorAn acidic solution that is used to surfacecoat metals.PK fertilizerFertilizer containing phosphorus and potassium.PlastisolPrecoated thin sheet for roofing.Polyaluminium chlorideA chemical coagulant that is used in thetreatment of drinking water and waste water.POPPersistent Organic Pollutant.Potassium (K)An element. One of the three main nutrientsin compound fertilizers. It is excavatedmainly in salt mines in the form of potassiumchloride.Potassium nitrateA nitrogen and potassium fertilizer that isused in horticulture.Potassium sulphateA sulphur and potassium fertilizer used inhorticulture, or the raw material for fertilizer.Process chemicalsProducts that are primarily sold to theprocess industry, such as nitric acid, ammoniaand technical urea.ProGipsProduct name. Gypsum raw material usedby the construction industry.Responsible Care (RC)The chemical industry’s voluntary, worldwideenvironmental and safety programme.Rutile oreA raw material in titanium dioxide pigment.It contains a large amount of titaniumdioxide.SizeAdditives used in paper manufacture to improvethe strength or to lower the waterabsorption of paper.Sodium percarbonateA raw material in detergents. It is madefrom soda using hydrogen peroxide.Sodium tripolyphosphate (STPP)Used in detergents as builder to soften thewater. Prevents dirt particles from adheringback to the garment.Straight fertilizerA fertilizer containing one plant nutrient.Sulphur dioxideAn industrial gas which is used mainly bythe forest industry and is manufactured, forexample, by burning elementary sulphuror by means of its recovery from processgases. It is also an acidification-causingemission that is produced when sulphurcontainingfuels are burnt.Sulphuric acidA widely used basic chemical that is producedfrom sulphur dioxide gas. The rawgas is obtained from the roasting of certainores, or by burning elementary sulphur.StabilizationBringing to a permanent state. For example,the chemical composition of a hazardouswaste can be changed or the solubilityin water of the waste can be lowered bymeans of various treatment techniquesTinting systemA method of producing coloured paint.The system comprises (base paints,) tintingcolourants, tinting formulae, dispensingmachines, shakers, colour matching systems,PC software, and colour cards.TiO 2Titanium dioxide.Titanium dioxide pigmentA white pigment. An important raw materialin the manufacture of paint, paper, plasticsand printing ink. It is manufacturedfrom titanium-containing ores and slag in acomplex process involving the use of sulphuricacid or chlorine and numerous auxiliarychemicals. The methods of manufactureare the sulphate process and the chlorideprocess.UC cured productLacquer or paint cured by ultra-violet radiation.Ultrafine TiO 2A very fine crystal titanium dioxide that isinvisible in the product application andprotects against UV radiation.UreaA single-nutrient fertilizer that contains alarge amount of nitrogen and is manufacturedfrom ammonia and carbon dioxide. Itis also used in resin adhesives.Water chemicalA chemical used in treating water.VIC(Volatile Inorganic Compounds)These compounds include ammonia, chlorineand fluorine that are formed as emissionsmainly from the processes of the basicinorganic industries.VOC(Volatile Organic Compounds)These compounds are mainly solventswhich in normal conditions evaporate intothe air, notably with effects on the generationof ozone.69
Group companies1.1.2001CompanyGroup holding%LocationCompany<strong>Kemira</strong> OyjFinland, Helsinki<strong>Kemira</strong> Chemicals<strong>Kemira</strong> Chemicals Oy 100 Finland, Helsinki <strong>Kemira</strong> Kemi AB 100 Sweden, Helsingborg <strong>Kemira</strong> Chimie S.A. 100 France, Lauterbourg <strong>Kemira</strong> Chemicals AS 100 Norway, Gamle Fredrikstad Kemwater Cristal S.A. 95 Rumania, Bucharest Alchim S.R.L. 95 Rumania, Tulcea Kemwater Chimbis S.A. 58 Rumania, Bistrita Scandinavian Silver Eel AB 100 Sweden, Helsingborg Aliada Quimica S.A. 100 Spain, Barcelona <strong>Kemira</strong> Ibérica S.A. 100 Spain, Barcelona <strong>Kemira</strong> Ibérica Internacional S.L. 100 Spain, Barcelona Aliada Quimica de Portugal Lda. 74 Portugal, Estarreja <strong>Kemira</strong> Chimica S.p.A. 100 Italy, Ossona Kemifloc a.s. 51 Czech Republic, Prerov Kemwater Närke AB 92 Sweden, Kumla Kemipol Sp. z o.o. 51 Poland, Police <strong>Kemira</strong> Kopparverket KB 100 Sweden, Helsingborg Ahlbo Kemi AB 100 Sweden, Helsingborg Kemwater Brasil S.A. 51 Brazil, São Paulo Kemwater de México, S.A. de C.V. 51 Mexico, Tlaxcala Kemwater ProChemie s.r.o. 60 Czech Republic, Bakov nad Jizerou Kemwater Diper Environmental Chemicals Inc. 51 Turkey, Izmir <strong>Kemira</strong> Fine Chemicals Oy 100 Finland, Kokkola <strong>Kemira</strong> Chemicals (UK) Ltd 100 United Kingdom, Harrogate <strong>Kemira</strong> Chemie GmbH 100 Germany, Hanau <strong>Kemira</strong> Chemie Ges.mbH 100 Austria, Krems PCS Paper Chemicals Systems Vertriebges.mbH 55 Austria, Krems PCS Paper Chemicals Systems Vertriebges.mbH 55 Germany, Brühl <strong>Kemira</strong>-Swiecie Sp. z o.o 65 Poland, Swiecie ZAO Novo<strong>Kemira</strong> 47 Russia, Novodvisk <strong>Kemira</strong> Cell Sp. z o.o 55 Poland, Ostroleka <strong>Kemira</strong> Kimya Sanayi ve Ticaret A.S. 51 Turkey, Istanbul <strong>Kemira</strong> Chem Holding B.V. 100 Netherlands, Rotterdam <strong>Kemira</strong> Chemicals B.V. 100 Netherlands, Rozenburg <strong>Kemira</strong> Kemax B.V. 100 Netherlands, Rozenburg <strong>Kemira</strong> Chemicals S.A./N.V. 100 Belgium, Wavre <strong>Kemira</strong> Chemicals Korea Corporation 100 South Korea, Ulsan <strong>Kemira</strong> Chemicals Canada Inc. 100 Canada, Maitland <strong>Kemira</strong> Chemicals U.S. Inc. 100 United States, Philadelphia, PA <strong>Kemira</strong> Chemicals Inc. 100 United States, Savannah, GA <strong>Kemira</strong> Chemicals Canada NRO, Inc. 100 Canada, Maitland <strong>Kemira</strong> Chemicals Hungaria KFT 100 Hungary, Budapest AS Kemivesi 50 Estonia, Tallinn Kemwater (Thailand) Ltd 49 Thailand, Bangkok Kemwater Services Oy 51 Finland, Helsinki <strong>Kemira</strong> Chemicals Brasil Ltda 100 Brazil, Telemaco Borba Kemwater (Yixing) Co., Ltd 60 China, Yixing City <strong>Kemira</strong> Miljö A/S 100 Denmark, Esbjerg <strong>Kemira</strong> Pigments Oy 100 Finland, Pori <strong>Kemira</strong> Pigments AB 100 Sweden, Helsingborg <strong>Kemira</strong> Pigments Kereskedelmi KFT 100 Hungary, Budapest <strong>Kemira</strong> Pigments Holding B.V. 100 Netherlands, Rotterdam <strong>Kemira</strong> Pigments S.A. 100 Belgium, Wavre <strong>Kemira</strong> Pigments Asia Pacific Pte. Ltd. 100 Singapore, Singapore <strong>Kemira</strong> Pigments Latin America Comercial Ltda. 100 Chile, Santiago TikkurilaTikkurila OyTikkurila Paints OyTikkurila ABAS Baltic Color 1)UAB Baltic ColorZAO FinncolorOOO Kraski TikkurilaTikkurila Festék KFTImagica LtdA/S Baltic Color 1)Tikkurila Polska Sp. z o.o. 2)Spetra S.r.l.Tikkurila Coatings OyTikkurila Coatings B.V.Tikkurila Coatings (Ireland) LtdTikkurila Coatings LtdTikkurila ABAS Tikkurila CoatingsTikkurila Coatings KFTZAO Tikkurila CoatingsSiA Tikkurila CoatingsTikkurila Services OyTikkurila Finance OyAlcro-Beckers ABAlcro-Beckers Norge A/SAlcro-Beckers Poland LtdAlcro-Beckers Danmark A/SPolifarb Becker Debica SANokian Laatumaalit OyPigrol Farben GmbHHolmbergs Färg i Skövde ABFärghuset i Bollnäs ABSundsvalls Färghandel ABTapetlagret Öbergs Färghus i Västerås ABGemptus ABFärgmästaren J E Englund ABHässleholms Färg & Miljö ABRF Golventreprenader ABRunes Färger ABGamol Försäljnings ABFärghuset i Malmö ABFärgservice i Malmö ABFärghuset i Kristinehamn ABBilldals Färghus ABGolv & Färghuset Peter Alvefelt AB<strong>Kemira</strong> Agro<strong>Kemira</strong> Agro Oy<strong>Kemira</strong> Agro Holdings Ltd<strong>Kemira</strong> Agro U.K. Ltd<strong>Kemira</strong> Ltd<strong>Kemira</strong> Ireland Ltd<strong>Kemira</strong> S.A./N.V.Battaille S.A.Engrais Battaille S.A.<strong>Kemira</strong> Engrais S.A.<strong>Kemira</strong> Agro Holding B.V.70
= production = marketing = holding = serviceGroup holding%LocationCompanyGroup holding%Location100 Finland, Vantaa 100 Finland, Vantaa 100 Sweden, Spånga 100 Estonia, Tallinn 50 Lithuania, Vilnius 100 Russia, St. Petersburg 100 Russia, Moscow 100 Hungary, Budapest 100 United Kingdom, Uxbridge 100 Latvia, Riga 100 Poland, Sczcecin 100 Italy, Modena 100 Finland, Vantaa 100 Netherlands, Dordrecht 100 Ireland, Cork 100 United Kingdom, Bury 100 Sweden, Spånga 100 Estonia, Tallinn 100 Hungary, Budapest 100 Russia, St. Petersburg 100 Latvia, Riga 100 Finland, Vantaa 100 Finland, Vantaa 100 Sweden, Stockholm 100 Norway, Oslo 100 Poland, Warsaw 100 Denmark, Copenhagen 91 Poland, Debica 100 Finland, Nokia 100 Germany, Ansbach 91 Sweden, Skövde 91 Sweden, Bollnäs 91 Sweden, Sundsvall 91 Sweden, Västerås 100 Sweden, Västerås 91 Sweden, Eskilstuna 91 Sweden, Hässleholm 91 Sweden, Västerås 100 Sweden, Västerås 100 Sweden, Uddevalla 91 Sweden, Malmö 91 Sweden, Malmö 91 Sweden, Kristinehamn 91 Sweden, Göteborg 91 Sweden, Göteborg <strong>Kemira</strong> B.V. 100 Netherlands, Rotterdam <strong>Kemira</strong> Pernis B.V. 100 Netherlands, Rotterdam Kencica Speciaalmeststoffen B.V. 100 Netherlands, Maastricht <strong>Kemira</strong> Deutschland GmbH 100 Germany, Hannover Comercial de Fertilizantes Liquidos S.A. 50 Spain, Valencia Viljavuuspalvelu Oy 80 Finland, Mikkeli Mykora Oy 100 Finland, Kiukainen A. Jalander Oy 100 Finland, Muurla A. Jalander Eesti Oü 100 Estonia, Tallinn SiA <strong>Kemira</strong> Agro Latvija 100 Latvia, Riga ZAO <strong>Kemira</strong> Agro 100 Russia, Moscow <strong>Kemira</strong> Agro Poland Sp. z o.o. 100 Poland, Gdynia <strong>Kemira</strong> Agro Sdn. Bhd. 100 Malaysia, Kuala Lumpur<strong>Kemira</strong> Agro Hungary Ltd Co. 100 Hungary, Hódmezóvásárhely AS <strong>Kemira</strong> Agro Eesti 100 Estonia, Tallinn UAB <strong>Kemira</strong> Agro Vilnius 100 Lithuania, Vilnius UAB <strong>Kemira</strong> Lifosa 51 Lithuania, Kedainiai AS Fertimix 100 Estonia, Tallinn Biolchim S.p.A. 50 Italy, Bologna Vitalba S.r.l. 98 Italy, Bologna <strong>Kemira</strong> Agro Rozenburg B.V. 100 Netherlands, Rotterdam <strong>Kemira</strong> Agro Pernis B.V. 100 Netherlands, Rotterdam <strong>Kemira</strong> Danmark A/S 100 Denmark, Fredericia <strong>Kemira</strong> Metalkat<strong>Kemira</strong> Metalkat Oy 100 Finland, Laukaa Metpela Oy 100 Finland, Laitila Convertitori Catalitici Europa S.r.l. 100 Italy, Genova <strong>Kemira</strong> Katalysatoren GmbH 100 Germany, Wiesbaden Metalkat Romania S.A. 80 Romania, Craiova Other<strong>Kemira</strong> Services Holland B.V. 100 Netherlands, Rotterdam <strong>Kemira</strong> International Finance B.V. 100 Netherlands, Rotterdam <strong>Kemira</strong> Finance B.V. 100 Netherlands, Rozenburg <strong>Kemira</strong> Danmark Holding A/S 100 Denmark, Fredericia <strong>Kemira</strong> Engineering Oy 3) 100 Finland, Helsinki Multirange B.V. 100 Netherlands, Rotterdam 1)Owned in equal shares by Tikkurila Coatings Oy and Alcro-Beckers AB2)Owned in egual shares by Tikkurila Coatings Oy and Tikkurila Paints Oy3)Owned in equal shares by <strong>Kemira</strong> Chemicals Oy, <strong>Kemira</strong> Pigments Oy and <strong>Kemira</strong> Agro OyCompanies not operative in <strong>2000</strong> are excluded.100 Finland, Helsinki 100 United Kingdom, Ince 100 United Kingdom, Ince 100 United Kingdom, Ince 100 Ireland, Dublin 100 Belgium, Wavre 100 Belgium, Basècles 100 France, Fresnes s/ Escaut 100 France, Ribécourt 100 Netherlands, Rotterdam Graphic design and layout by Matti Savimaa, printed by Sävypaino ISO 9002 2001