Full text - PDF - The National Cancer Institute
Full text - PDF - The National Cancer Institute
Full text - PDF - The National Cancer Institute

Create successful ePaper yourself
Turn your PDF publications into a flip-book with our unique Google optimized e-Paper software.
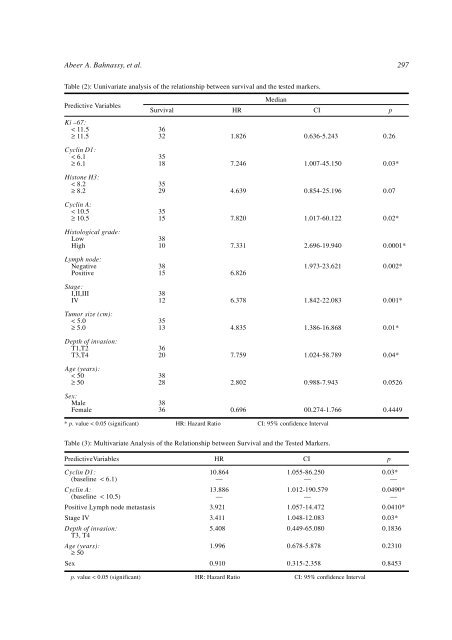
Abeer A. Bahnassy, et al. 297Table (2): Uunivariate analysis of the relationship between survival and the tested markers.Predictive VariablesKi –67:< 11.5≥ 11.5MedianSurvival HR CI p36321.8260.636-5.2430.26Cyclin D1:< 6.1≥ 6.135187.2461.007-45.1500.03*Histone H3:< 8.2≥ 8.235294.6390.854-25.1960.07Cyclin A:< 10.5≥ 10.535157.8201.017-60.1220.02*Histological grade:LowHigh38107.3312.696-19.9400.0001*Lymph node:NegativePositive38156.8261.973-23.6210.002*Stage:I,II,IIIIV38126.3781.842-22.0830.001*Tumor size (cm):< 5.0≥ 5.035134.8351.386-16.8680.01*Depth of invasion:T1,T2T3,T436207.7591.024-58.7890.04*Age (years):< 50≥ 5038282.8020.988-7.9430.0526Sex:MaleFemale38360.69600.274-1.7660.4449* p. value < 0.05 (significant) HR: Hazard Ratio CI: 95% confidence IntervalTable (3): Multivariate Analysis of the Relationship between Survival and the Tested Markers.PredictiveVariables HR CI pCyclin D1:(baseline < 6.1)Cyclin A:(baseline < 10.5)Positive Lymph node metastasisStage IVDepth of invasion:T3, T4Age (years):≥ 50Sex10.864—13.886—3.9213.4115.4081.9960.9101.055-86.250—1.012-190.579—1.057-14.4721.048-12.0830.449-65.0800.678-5.8780.315-2.3580.03*—0.0490*—0.0410*0.03*0.18360.23100.8453p. value < 0.05 (significant) HR: Hazard Ratio CI: 95% confidence Interval