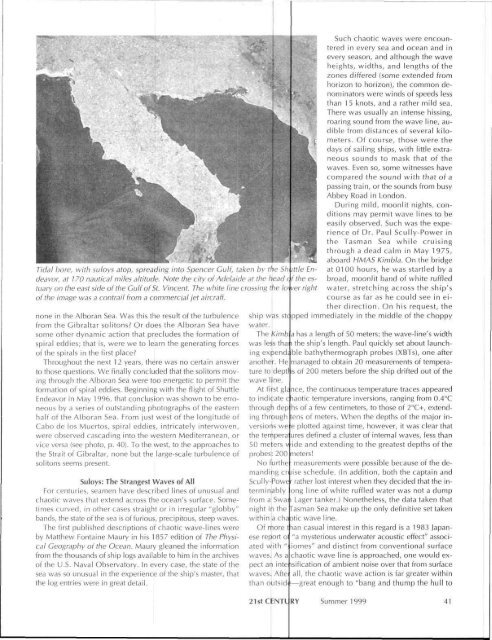
Tidal bore, <strong>with</strong> suloys a<strong>to</strong>p, spreading in<strong>to</strong> Spencer Gulf, taken by <strong>the</strong> Shuttle Endeavor,at 170 nautical miles altitude. Note <strong>the</strong> city of Adelaide at <strong>the</strong> head c f<strong>the</strong> estuaryon <strong>the</strong> east side of <strong>the</strong> Gulf of St. Vincent. The white line crossing <strong>the</strong> /o ver righ<strong>to</strong>f <strong>the</strong> image was a contrail from a commercial jet aircraft.none in <strong>the</strong> Alboran Sea. Was this <strong>the</strong> result of <strong>the</strong> turbulencefrom <strong>the</strong> Gibraltar soli<strong>to</strong>ns? Or does <strong>the</strong> Alboran Sea havesome o<strong>the</strong>r dynamic action that precludes <strong>the</strong> formation ofspiral eddies; that is, were we <strong>to</strong> learn <strong>the</strong> generating forcesof <strong>the</strong> spirals in <strong>the</strong> first place?Throughout <strong>the</strong> next 12 years, <strong>the</strong>re was no certain answer<strong>to</strong> those questions. We finally concluded that <strong>the</strong> soli<strong>to</strong>ns movingthrough <strong>the</strong> Alboran Sea were <strong>to</strong>o energetic <strong>to</strong> permit <strong>the</strong>formation of spiral eddies. Beginning <strong>with</strong> <strong>the</strong> flight of ShuttleEndeavor in May 1996, that conclusion was shown <strong>to</strong> be erroneousby a series of outstanding pho<strong>to</strong>graphs of <strong>the</strong> easternhalf of <strong>the</strong> Alboran Sea. From just west of <strong>the</strong> longitude ofCabo de los Muer<strong>to</strong>s, spiral eddies, intricately interwoven,were observed cascading in<strong>to</strong> <strong>the</strong> western Mediterranean, orvice versa (see pho<strong>to</strong>, p. 40). To <strong>the</strong> west, <strong>to</strong> <strong>the</strong> approaches <strong>to</strong><strong>the</strong> Strait of Gibraltar, none but <strong>the</strong> large-scale turbulence ofsoli<strong>to</strong>ns seems present.Suloys: The Strangest Waves of AllFor centuries, seamen have described lines of unusual andchaotic waves that extend across <strong>the</strong> ocean's surface. Sometimescurved, in o<strong>the</strong>r cases straight or in irregular "globby"bands, <strong>the</strong> state of <strong>the</strong> sea is of furious, precipi<strong>to</strong>us, steep waves.The first published descriptions of chaotic wave-lines wereby Mat<strong>the</strong>w Fontaine Maury in his 1857 edition of The PhysicalGeography of <strong>the</strong> Ocean. Maury gleaned <strong>the</strong> informationfrom <strong>the</strong> thousands of ship logs available <strong>to</strong> him in <strong>the</strong> archivesof <strong>the</strong> U.S. Naval Observa<strong>to</strong>ry. In every case, <strong>the</strong> state of <strong>the</strong>sea was so unusual in <strong>the</strong> experience of <strong>the</strong> ship's master, that<strong>the</strong> log entries were in great detail.Such chaotic waves were encounteredin every sea and ocean and inevery season, and although <strong>the</strong> waveheights, widths, and lengths of <strong>the</strong>zones differed (some extended fromhorizon <strong>to</strong> horizon), <strong>the</strong> common denomina<strong>to</strong>rswere winds of speeds lessthan 1 5 knots, and a ra<strong>the</strong>r mild sea.There was usually an intense hissing,roaring sound from <strong>the</strong> wave line, audiblefrom distances of several kilometers.Of course, those were <strong>the</strong>days of sailing ships, <strong>with</strong> little extraneoussounds <strong>to</strong> mask that of <strong>the</strong>waves. Even so, some witnesses havecompared <strong>the</strong> sound <strong>with</strong> that of apassing train, or <strong>the</strong> sounds from busyAbbey Road in London.During mild, moonlit nights, conditionsmay permit wave lines <strong>to</strong> beeasily observed. Such was <strong>the</strong> experienceof Dr. Paul Scully-Power in<strong>the</strong> Tasman Sea while cruisingthrough a dead calm in May 1975,aboard HMAS Kimbla. On <strong>the</strong> bridgeat 0100 hours, he was startled by abroad, moonlit band of white ruffledwater, stretching across <strong>the</strong> ship'scourse as far as he could see in ei<strong>the</strong>rdirection. On his request, <strong>the</strong>ship was stcjpped immediately in <strong>the</strong> middle of <strong>the</strong> choppywater.The Kimb a has a length of 50 meters; <strong>the</strong> wave-line's widthwas less tha i <strong>the</strong> ship's length. Paul quickly set about launchingexpend; ble bathy<strong>the</strong>rmograph probes (XBTs), one afterano<strong>the</strong>r. He managed <strong>to</strong> obtain 20 measurements of temperature<strong>to</strong> deptl is of 200 meters before <strong>the</strong> ship drifted out of <strong>the</strong>wave line.At first git nee, <strong>the</strong> continuous temperature traces appeared<strong>to</strong> indicate ciaotic temperature inversions, ranging from 0.4°Cthrough dep hs of a few centimeters, <strong>to</strong> those of 2°C+, extendingthrough tens of meters. When <strong>the</strong> depths of <strong>the</strong> major inversionswe e plotted against time, however, it was clear that<strong>the</strong> tempera ures defined a cluster of internal waves, less than50 meters v ide and extending <strong>to</strong> <strong>the</strong> greatest depths of <strong>the</strong>probes: 200 meters!No fur<strong>the</strong> measurements were possible because of <strong>the</strong> demandingcruise schedule. (In addition, both <strong>the</strong> captain andScully-Powc ' ra<strong>the</strong>r lost interest when <strong>the</strong>y decided that <strong>the</strong> interminablyong line of white ruffled water was not a dumpfrom a Swan Lager tanker.) None<strong>the</strong>less, <strong>the</strong> data taken thatnight in <strong>the</strong> Tasman Sea make up <strong>the</strong> only definitive set taken<strong>with</strong>in a cha Dtic wave line.Of more tian casual interest in this regard is a 1983 Japanesereport o "a mysterious underwater acoustic effect" associated<strong>with</strong> " iomes" and distinct from conventional surfacewaves. As a chaotic wave line is approached, one would expectan inte isification of ambient noise over that from surfacewaves. Afte all, <strong>the</strong> chaotic wave action is far greater <strong>with</strong>inthan outsid !—great enough <strong>to</strong> "bang and thump <strong>the</strong> hull <strong>to</strong>21stCENTL RY Summer 1999 41
Shearing suloy on <strong>the</strong> boundary of <strong>the</strong> sou<strong>the</strong>rly flowing curren<strong>to</strong>f Mozambique Channel, from <strong>the</strong> Shuttle Discovery,Aug. 16, 1985, at 190 nautical miles.where I feared for <strong>the</strong> planks," as stated in more than one of<strong>the</strong> log books in Maury's hands.If <strong>the</strong> chaotic "siomes" in <strong>the</strong> open ocean extend <strong>to</strong> depthsof 200 meters, <strong>with</strong> <strong>the</strong> degree of turbulence measured byScully-Power from <strong>the</strong> Kimbla, <strong>the</strong>y possibly represent acousticdiscontinuities as substantial as those in meso-scale eddies.Any knowledge of <strong>the</strong>ir generation, distribution, and life his<strong>to</strong>riesis clearly more than academic.Actually, little more is unders<strong>to</strong>od about <strong>the</strong> nature ofchaotic wave-lines than was known in <strong>the</strong> early 1 980s, o<strong>the</strong>rthan <strong>the</strong>ir distribution. Russian oceanographers have done <strong>the</strong>most work on this strange state of <strong>the</strong> sea, giving it <strong>the</strong> name of"suloy." The fullest description of suloys was made by <strong>the</strong> lateDr. Konstantin Fedorov in his 1983 book on The Physical Natureand Structure of Oceanic Fronts. In it, Fedorov documents<strong>the</strong> regions of <strong>the</strong> oceans in which suloys are most often encountered,and <strong>the</strong> variety of ocean conditions under whichsuloys may occur, such as tides, a convergence of currents, a<strong>to</strong>ceanic fronts, or a<strong>to</strong>p internal waves. "Wherever," he notes,"<strong>the</strong> dynamics of <strong>the</strong> near-surface ocean cause a convergence,<strong>the</strong>re is a suloy."Tidal suloys are readily explained, because <strong>the</strong>y occur whenstrong tidal currents enter <strong>the</strong> shallow water of narrow straits.A line of precipi<strong>to</strong>us waves, a suloy, is formed at <strong>the</strong> front of<strong>the</strong> tidal surge as it meets, and converges <strong>with</strong>, <strong>the</strong> surfacewind waves. The precipi<strong>to</strong>us chaotic waves in suloys mayattain heights of 5 m (see pho<strong>to</strong>, p. 41). West of San Francisco'sGolden Gate, waves in <strong>the</strong> Point Bonita suloy can becomeso intense that even moderate-size ships have requiredmore than one attempt <strong>to</strong> sail through <strong>the</strong> roaring wave line.Suloys arise also where <strong>the</strong> strong discharge from majorrivers converge on waters of <strong>the</strong> coastal ocean. Such featureshave been observed on several occasions by astronauts inContinued from page 39lands are bright and sharp. In <strong>the</strong> next instant, <strong>the</strong>y recognizewhitecaps and foam streaks on <strong>the</strong> sea.Visual observations and pho<strong>to</strong>graphy of whitecaps areclearly not suitable <strong>to</strong> learn <strong>the</strong> extent <strong>to</strong> which <strong>the</strong>ycover <strong>the</strong> world's sea surface at any given time. Yet, thatknowledge is key <strong>to</strong> <strong>the</strong> determination of wind speedsand directions from Earth-orbiting, satellite-bornemicrowave scatterometers. Whitecaps and foam greatlyinfluence <strong>the</strong> microwave emissivity of <strong>the</strong> ocean. Themagnitude and variability of this emissivity change is notyet resolved."We continue <strong>to</strong> observe 'corduroy' and 'herringbone'seas in every part of <strong>the</strong> ocean where <strong>the</strong> Sun's glitter givesus a good look at <strong>the</strong> surface," reported Skylab astronauts,Cols. Gerald Carr and William Pogue, and Dr. Edward Gibson,in January 1974, indicating <strong>the</strong>ir ease in observing majorocean swell patterns. The "corduroy" seas are <strong>the</strong> resul<strong>to</strong>f parallel swell, while <strong>the</strong> "herringbone" seas are <strong>the</strong> resul<strong>to</strong>f swell crossing each o<strong>the</strong>r at oblique angles.Ocean Swell. When wind waves leave <strong>the</strong> area of generation,<strong>the</strong> sea ceases <strong>to</strong> be random and <strong>the</strong> dominant waveperiod and direction of propagation take over. The sharppeaks of wind-waves flatten, <strong>the</strong> height decreases, and aregular pattern of parallel crests appears as <strong>the</strong> waves aretransformed in<strong>to</strong> swell. As <strong>the</strong> swell travel onward—throughthousands of kilometers of ocean if no land intervenes—<strong>the</strong>longest lengths and greatest periods, predominate. Crestlengths may grow <strong>to</strong> thousands of meters and become extraordinarilyparallel <strong>to</strong> each o<strong>the</strong>r. These are <strong>the</strong> corduroyseas visible from space in <strong>the</strong> great expanses of <strong>the</strong> oceans(see pho<strong>to</strong>, p. 43, bot<strong>to</strong>m left).Swell from more than one s<strong>to</strong>rm-generating region, ororiginating simultaneously from s<strong>to</strong>rmy oceans in <strong>the</strong> Nor<strong>the</strong>rnand Sou<strong>the</strong>rn hemispheres, may eventually intersecteach o<strong>the</strong>r. In such parts of <strong>the</strong> ocean, commonly near <strong>the</strong>Equa<strong>to</strong>r, <strong>the</strong> intersecting swell form <strong>the</strong> "herringbone seas"that were observed first by <strong>the</strong> Skylab-4 crew, but subsequentlyon innumerable occasions by astronauts aboard <strong>the</strong>Space Shuttle (see pho<strong>to</strong>, p. 43, <strong>to</strong>p right).Breakers, Surf, and Refraction. When a wave approaches<strong>the</strong> shore, its crest moves faster than <strong>the</strong> trough, responding<strong>to</strong> <strong>the</strong> friction exerted by <strong>the</strong> sea floor. At <strong>the</strong> moment when<strong>the</strong> velocity of water particles in <strong>the</strong> crest exceeds <strong>the</strong> forwardspeed of <strong>the</strong> wave form, <strong>the</strong> wave "breaks." The cres<strong>to</strong>vertakes <strong>the</strong> trough at this stage, <strong>the</strong> leading slope of <strong>the</strong>wave becomes steeper than <strong>the</strong> trailing side, and <strong>the</strong> <strong>to</strong>p of<strong>the</strong> wave cascades down <strong>the</strong> steep slope, forming <strong>the</strong> "surfzone."Waves tend <strong>to</strong> form "plunging breakers" where bot<strong>to</strong>mslopes <strong>to</strong> <strong>the</strong> beach are relatively steep. These are <strong>the</strong> spectacular"curling" breakers, in which <strong>the</strong> crests literally collapseon<strong>to</strong> <strong>the</strong> steep, forward slope of <strong>the</strong> breaking wave.Where better <strong>to</strong> see <strong>the</strong>se crashing giants than at SunsetBeach on <strong>the</strong> north shore of Oahu in winter? They are <strong>the</strong>professional surfers' joy; <strong>the</strong> amateurs' continuous "hangten" disasters (see pho<strong>to</strong>, p. 43, bot<strong>to</strong>m right).Continued on page 4542 Summer 1 999 21st CENTURY