Statistical Yearbook for Southern Sudan (2009) - Government of ...
Statistical Yearbook for Southern Sudan (2009) - Government of ...
Statistical Yearbook for Southern Sudan (2009) - Government of ...
- No tags were found...

You also want an ePaper? Increase the reach of your titles
YUMPU automatically turns print PDFs into web optimized ePapers that Google loves.
This <strong>Statistical</strong> <strong>Yearbook</strong> was produced by the <strong>Southern</strong> <strong>Sudan</strong> Centre <strong>for</strong> Census Statistics and Evaluation in collaboration with various data providers including GOSSMinistries and agencies whose cooperation we greatly appreciate. The source <strong>for</strong> all in<strong>for</strong>mation is attributed in the <strong>Yearbook</strong>; readers are encouraged to contact us <strong>for</strong>any assistance required.Responsibility <strong>for</strong> the authenticity <strong>of</strong> the data lies with the source organization.We appreciate the support <strong>of</strong> UNDP in facilitating the publication <strong>of</strong> this document.
I. Chairperson’s Foreword ________________________________________________________________________________________________ ixII. <strong>Southern</strong> <strong>Sudan</strong> Centre <strong>for</strong> Census Statistics and Evaluation: Functions and Organization _________________________________________________ xiIII. Population and Demography _____________________________________________________________________________________________ 11 Population by State <strong>of</strong> Enumeration: <strong>Southern</strong> <strong>Sudan</strong> ................................................................................................................................................................................................................................ 22 Population by County <strong>of</strong> Enumeration: Upper Nile State ........................................................................................................................................................................................................................ 33 Population by County <strong>of</strong> Enumeration: Jonglei State ................................................................................................................................................................................................................................... 34 Population by County <strong>of</strong> Enumeration: Unity State ..................................................................................................................................................................................................................................... 45 Population by County <strong>of</strong> Enumeration: Warrap State ................................................................................................................................................................................................................................. 46 Population by County <strong>of</strong> Enumeration: Northern Bahr El Ghazal State .......................................................................................................................................................................................... 57 Population by County <strong>of</strong> Enumeration: Western Bahr El Ghazal State ............................................................................................................................................................................................. 58 Population by County <strong>of</strong> Enumeration: Lakes State ..................................................................................................................................................................................................................................... 59 Population by County <strong>of</strong> Enumeration: Western Equatoria State ........................................................................................................................................................................................................ 610 Population by County <strong>of</strong> Enumeration: Central Equatoria State .......................................................................................................................................................................................................... 611 Population by County <strong>of</strong> Enumeration: Eastern Equatoria State .......................................................................................................................................................................................................... 712 Population Distribution by Age, Sex and State <strong>of</strong> Enumeration ............................................................................................................................................................................................................ 713 Population Pyramid <strong>for</strong> <strong>Southern</strong> <strong>Sudan</strong> ............................................................................................................................................................................................................................................................ 814 Population by Region <strong>of</strong> Origin ................................................................................................................................................................................................................................................................................ 915 Area and Population Density by State ................................................................................................................................................................................................................................................................. 916 Changes in Population by State since 1983 ...................................................................................................................................................................................................................................................... 10IV. Maps _____________________________________________________________________________________________________________ 111 Overview <strong>of</strong> States ......................................................................................................................................................................................................................................................................................................... 122 Overview <strong>of</strong> States and Counties .......................................................................................................................................................................................................................................................................... 133 Total Population ................................................................................................................................................................................................................................................................................................................. 144 Population Distribution ................................................................................................................................................................................................................................................................................................. 155 Population Density (persons per sq km) ............................................................................................................................................................................................................................................................ 166 Children Under 5 Years Old ....................................................................................................................................................................................................................................................................................... 177 Young Population between 5 and 19 years old .............................................................................................................................................................................................................................................. 188 Population Growth by State since 1983 ............................................................................................................................................................................................................................................................. 199 Major Operational Airfields ........................................................................................................................................................................................................................................................................................ 2010 Major Motorable Roads ................................................................................................................................................................................................................................................................................................ 2011 Major Rivers and Water Bodies ............................................................................................................................................................................................................................................................................... 2212 <strong>Southern</strong> <strong>Sudan</strong> Topography ...................................................................................................................................................................................................................................................................................... 23v
V. Health and Nutrition ___________________________________________________________________________________________________ 251 Neonatal Mortality Rate by State (2006) .......................................................................................................................................................................................................................................................... 262 Post neonatal Mortality Rate by State (2006) ................................................................................................................................................................................................................................................. 273 Infant Mortality Rate (2006) ...................................................................................................................................................................................................................................................................................... 284 Under-five Mortality Rate (2006) ........................................................................................................................................................................................................................................................................... 295 Children Less than 1 year old fully immunized (2006) ............................................................................................................................................................................................................................... 306 Maternal Mortality Rate (2006) ............................................................................................................................................................................................................................................................................. 317 Contraceptive Prevalence Rate (2006) ............................................................................................................................................................................................................................................................... 328 Percentage <strong>of</strong> Women who have heard <strong>of</strong> AIDS (2006) .......................................................................................................................................................................................................................... 339 Prevalence <strong>of</strong> Stunting (2006) .................................................................................................................................................................................................................................................................................. 3410 Prevalence <strong>of</strong> Underweight (2006) ....................................................................................................................................................................................................................................................................... 3511 Prevalence <strong>of</strong> Wasting (2006) ................................................................................................................................................................................................................................................................................... 36VI. Education __________________________________________________________________________________________________________ 371 Net Intake in Primary Education (2006) ............................................................................................................................................................................................................................................................ 382 Net Attendance Ratio in Primary Education (2006) ................................................................................................................................................................................................................................... 393 Net Attendance Ratio in Primary Education by sex (2006) ................................................................................................................................................................................................................... 404 Secondary School Net Attendance Ratio (2006) ......................................................................................................................................................................................................................................... 415 Secondary School Net Attendance Ratio by sex (2006) ......................................................................................................................................................................................................................... 426 Primary Completion Rate (2006) ........................................................................................................................................................................................................................................................................... 437 School attendance Rates <strong>of</strong> orphans and non-orphans ............................................................................................................................................................................................................................. 44VII. Gender ___________________________________________________________________________________________________________ 451 Gender Composition <strong>of</strong> <strong>Southern</strong> <strong>Sudan</strong> Legislative Assembly ............................................................................................................................................................................................................ 462 Gender Composition <strong>of</strong> SSLA (Graph) .............................................................................................................................................................................................................................................................. 473 Gender Composition <strong>of</strong> State Legislative Assemblies ................................................................................................................................................................................................................................. 484 Gender Composition <strong>of</strong> State Legislative Assemblies (Graph) ............................................................................................................................................................................................................. 495 Gender Composition <strong>of</strong> Council <strong>of</strong> Ministers (GOSS) .............................................................................................................................................................................................................................. 506 Gender Composition <strong>of</strong> Chairpersons in GOSS ........................................................................................................................................................................................................................................... 507 Gender Distribution <strong>of</strong> Governors ........................................................................................................................................................................................................................................................................ 518 Gender Distribution <strong>of</strong> Speakers <strong>of</strong> State Assemblies ................................................................................................................................................................................................................................ 51VIII. Forestry __________________________________________________________________________________________________________ 531 Area under Forest Reserves, National Parks and Game Reserves in <strong>Southern</strong> <strong>Sudan</strong> ............................................................................................................................................................ 542 Game Reserves in <strong>Southern</strong> <strong>Sudan</strong> ....................................................................................................................................................................................................................................................................... 54IX. Tourism ____________________________________________________________________________________________________________ 551 Room capacity <strong>of</strong> selected hotels in Juba ........................................................................................................................................................................................................................................................... 56vi
X. Displacement ________________________________________________________________________________________________________ 571 Voluntary Repatriation (2006-<strong>2009</strong>) ..................................................................................................................................................................................................................................................................... 582 Voluntary Repatriation <strong>of</strong> Individuals (2006-<strong>2009</strong>) ....................................................................................................................................................................................................................................... 593 Assisted Voluntary Repatriation since 2005 ...................................................................................................................................................................................................................................................... 604 Assisted Voluntary Repatriation since 2005 (Graph) ................................................................................................................................................................................................................................... 615 Cumulative Returns <strong>of</strong> IDPs/Refugees (2004-2008) .................................................................................................................................................................................................................................... 626 Cumulative Returns <strong>of</strong> IDPs/Refugees (2004-2008) Graph .................................................................................................................................................................................................................... 63XI. Demining __________________________________________________________________________________________________________ 651 Number <strong>of</strong> hazards per state .................................................................................................................................................................................................................................................................................... 662 Area cleared (square metres) per state .............................................................................................................................................................................................................................................................. 663 Area cleared (square metres) by organization ................................................................................................................................................................................................................................................ 674 Devices destroyed per region ................................................................................................................................................................................................................................................................................... 685 Mine victims by gender and age category .......................................................................................................................................................................................................................................................... 696 Number <strong>of</strong> victims per state <strong>of</strong> incident ............................................................................................................................................................................................................................................................. 697 Activities <strong>of</strong> victims at the time <strong>of</strong> the incident .............................................................................................................................................................................................................................................. 70XII. Water, Sanitation and Environment ________________________________________________________________________________________ 711 Proportion <strong>of</strong> population with access to improved water sources (2006) .................................................................................................................................................................................... 722 Percentage <strong>of</strong> population using sanitary means <strong>of</strong> excreta disposal (2006) .................................................................................................................................................................................. 733 Proportion <strong>of</strong> Households with appropriate water treatment (2006) ............................................................................................................................................................................................. 744 Mean time to source <strong>of</strong> drinking water (2006) .............................................................................................................................................................................................................................................. 755 Proportion <strong>of</strong> population using solid fuels <strong>for</strong> cooking(2006) ............................................................................................................................................................................................................... 76XIII. Money and Banking _ _________________________________________________________________________________________________ 771 Money Supply – 2007 and 2008 ............................................................................................................................................................................................................................................................................. 782 Factors Affecting Money Supply (2008) .............................................................................................................................................................................................................................................................. 783 Consolidated Commercial banks Balance Sheets (2007-2008) ............................................................................................................................................................................................................ 794 Consolidated Commercial banks Balance Sheets (2007-2008), continued .................................................................................................................................................................................... 795 Position <strong>of</strong> Commercial Banks financing by economic activities (2008) ........................................................................................................................................................................................... 806 Details <strong>of</strong> deposits (2007-2008) .............................................................................................................................................................................................................................................................................. 807 Bank <strong>of</strong> <strong>Southern</strong> <strong>Sudan</strong> balance Sheet Liabilities ......................................................................................................................................................................................................................................... 818 Bank <strong>of</strong> <strong>Southern</strong> <strong>Sudan</strong> Balance Sheet Assets ............................................................................................................................................................................................................................................... 819 Distribution <strong>of</strong> Banking Services by State .......................................................................................................................................................................................................................................................... 8210 Annual Inflation Rates Juba (2007-08) ................................................................................................................................................................................................................................................................. 83vii
XIV. <strong>Government</strong> Finance Statistics___________________________________________________________________________________________ 851 GOSS Budget Outturns and Budget Estimates .............................................................................................................................................................................................................................................. 862 GOSS Budget Outturns and Budget Estimates (Accountability Sector) .......................................................................................................................................................................................... 873 GOSS Budget Outturns and Budget Estimates(Economic Functions, Education and Health).............................................................................................................................................. 874 GOSS Budget Outturns and Budget Estimates (Infrastructure, Natural Resources and Rural Development Sectors) ....................................................................................... 885 GOSS Budget Outturns and Budget Estimates(Public Administration Sector) ............................................................................................................................................................................ 886 GOSS Budget Outturns and Budget Estimates (Rule <strong>of</strong> Law, Security and SHA Sectors) ................................................................................................................................................... 897 GOSS Budget Outturns and Budget Estimates (Block Transfers to the States) .......................................................................................................................................................................... 898 Average Value <strong>of</strong> Donor Projects ............................................................................................................................................................................................................................................................................ 909 Projected Funding by Sector by <strong>2009</strong> .................................................................................................................................................................................................................................................................. 9110 GOSS Oil Revenue ......................................................................................................................................................................................................................................................................................................... 9211 Total Revenue from Oil Exports ............................................................................................................................................................................................................................................................................. 92viii
Chairperson’s ForewordIt gives me great pleasure to present to you the <strong>Statistical</strong> <strong>Yearbook</strong> <strong>2009</strong>, the first such <strong>of</strong>ficial publication in <strong>Southern</strong><strong>Sudan</strong>.The <strong>Southern</strong> <strong>Sudan</strong> Centre <strong>for</strong> Census Statistics and Evaluation (SSCCSE) was established in 2004 with a mandate as the<strong>of</strong>ficial statistical agency <strong>of</strong> the <strong>Government</strong> <strong>of</strong> <strong>Southern</strong> <strong>Sudan</strong>. In particular, under the provisions <strong>of</strong> the CPA and the InterimConstitution <strong>of</strong> <strong>Southern</strong> <strong>Sudan</strong>, it was assigned responsibility <strong>for</strong> conducting the 5th <strong>Sudan</strong> Population and Housing Censusin 2008. The 5th SPHC has been the single most important statistical activity in <strong>Southern</strong> <strong>Sudan</strong> because it is a benchmark inthe transition period and provides critical inputs <strong>for</strong> implementation <strong>of</strong> the CPA. Besides, it has provided a sampling frame <strong>for</strong>the Centre’s future surveys enabling sophisticated sample surveys to be carried out in the future with scientific precision.However, the Centre’s mandate extends much beyond the implementation and analysis <strong>of</strong> the Census to the collectionand compilation, analysis and dissemination <strong>of</strong> statistics on a broad range <strong>of</strong> subjects. In this regard, the Centre has alreadyembarked on an ambitious programme to produce extensive economic and socio-demographic data. It has held two majornational sample surveys – the <strong>Sudan</strong> Household Health Survey (2006) and the National Baseline Household Survey (<strong>2009</strong>)– the latter based on the sampling frame from the Census and focusing especially on estimation <strong>of</strong> poverty incidence andmonitoring some <strong>of</strong> the Millennium Development Goals.This <strong>Statistical</strong> <strong>Yearbook</strong> attempts to bring together the available in<strong>for</strong>mation on different aspects <strong>of</strong> <strong>Southern</strong> <strong>Sudan</strong>esedevelopment. Apart from compiling statistics collected in primary data-gathering activities <strong>of</strong> the Centre, it also draws heavilyon in<strong>for</strong>mation provided by other producers <strong>of</strong> statistics including other GOSS institutions and UN agencies; it is our firstattempt at drawing on the reservoir <strong>of</strong> in<strong>for</strong>mation available with other partners and presenting it in an accessible andeasily understandable reference. I would like to thank the many contributing agencies <strong>for</strong> their unhesitating support in thisendeavour.Being the first publication <strong>of</strong> its type in <strong>Southern</strong> <strong>Sudan</strong>, the <strong>Yearbook</strong> <strong>2009</strong> includes also in<strong>for</strong>mation collected in previousyears and covers in<strong>for</strong>mation from 2005 onwards i.e. the post-CPA period, as this in<strong>for</strong>mation has not previously beenpresented in a single reference book. The <strong>Yearbook</strong> is envisaged to be an important source <strong>of</strong> social, economic anddemographic data/in<strong>for</strong>mation <strong>for</strong> the <strong>Southern</strong> <strong>Sudan</strong> statistical system; and successive yearly issues will provide updates onkey findings resulting from the Centre’s most recent work involving surveys, censuses and administrative data sources fromix
other statistical producers in <strong>Southern</strong> <strong>Sudan</strong>. In particular, I would like to encourage all agencies collecting comprehensivein<strong>for</strong>mation in their area <strong>of</strong> work to share it with us so that we can assist them in reaching the broadest audience possible.We have also tried to provide here a brief introduction to the Centre’s administrative structure and functions to familiarizeusers and partners with our organization. We endeavour to be a helpful and approachable organization which can both assistin providing in<strong>for</strong>mation and in designing appropriate methods to collect such in<strong>for</strong>mation where unavailable. We also look<strong>for</strong>ward to collaborating on a range <strong>of</strong> activities with partners and encourage you to contact us <strong>for</strong> any assistance that wemay be able to provide.Finally I would like to thank the many development partners who have assisted SSCCSE in fulfilling its mandate towards<strong>Southern</strong> <strong>Sudan</strong> through much assistance – financial, logistical and technical – and also our staff members <strong>for</strong> their untiringef<strong>for</strong>ts without which it would not have been possible to successfully complete any <strong>of</strong> our major activities.I sincerely hope that this publication will be <strong>of</strong> use to all those who wish to know about <strong>Southern</strong> <strong>Sudan</strong>; we will, as always,appreciate any comments aimed at improving the quality <strong>of</strong> this and future issues <strong>of</strong> the <strong>Statistical</strong> <strong>Yearbook</strong>.Isaiah Chol Aruaix
The <strong>Southern</strong> <strong>Sudan</strong> Centre <strong>for</strong> Census Statistics and EvaluationFunctions and OrganizationIntroductionThe origins <strong>of</strong> the <strong>Southern</strong> <strong>Sudan</strong> Centre <strong>for</strong> Census Statistics and Evaluation (SSCCSE) date back to 1995 when it served as a Database and Monitoring Unit under the<strong>Sudan</strong> Relief and Rehabilitation Association (SRRA).In 2005, following the signing <strong>of</strong> the Comprehensive Peace Agreement (CPA) and the promulgation <strong>of</strong> the <strong>Southern</strong> <strong>Sudan</strong> Interim Constitution, the Centre was legalisedand has since assumed the roles specified in the SSCCSE Act, 2004.The same Act defines the governing bodies, the guiding principles, goals, objectives and functions <strong>of</strong> the Centre.The Management <strong>of</strong> the Centre is under the direct responsibility <strong>of</strong> the Chairperson as Chief Executive. The chairperson is assisted in his/her day to day managementresponsibilities and duties by the Deputy Chairperson.The Deputy Chairperson is responsible <strong>for</strong> the day to day implementation <strong>of</strong> the decisions <strong>of</strong> the Board and supervision <strong>of</strong> staff.The Guiding Principles.The Centre has some guiding principles including:• Impartiality• Fulfillment <strong>of</strong> citizens’ entitlement to public in<strong>for</strong>mation.• Decisions made strictly on pr<strong>of</strong>essional considerations, scientific principles and pr<strong>of</strong>essional ethics regarding the methods and procedures <strong>for</strong> collection, processing,storage and dissemination <strong>of</strong> statistical data• Choice <strong>of</strong> the right sources <strong>of</strong> statistical data drawn from various sources such as surveys or administrative records on the basis <strong>of</strong> quality, timeliness, costs and theburden on respondents.• Ensuring that individual data collected <strong>for</strong> statistical compilation shall be strictly confidential and used exclusively <strong>for</strong> statistical purposes• Adhering to the use <strong>of</strong> international statistical concepts, standards and methods so as to promote consistency and efficiency <strong>of</strong> the statistical system.The Overall Goals and objectives <strong>of</strong> the Centre are to:• Collect, compile, analyze and publish all <strong>of</strong>ficial statistics on economic, social, demographic, environmental and general activities and conditions <strong>of</strong> the people <strong>of</strong><strong>Southern</strong> <strong>Sudan</strong>• Conduct all censuses and surveys that are carried out throughout <strong>Southern</strong> <strong>Sudan</strong>• Monitor and evaluate social impacts <strong>of</strong> public policies, projects and programs• Monitor the progress <strong>of</strong> poverty eradication and the attainment <strong>of</strong> the Millennium Development Goals, andxi
• Establish statistical standards and ensure adherence by all producers <strong>of</strong> statisticsThe Specific Functions <strong>of</strong> the CentreThe functions <strong>of</strong> the Centre are spelt out in the Act, 2004 and are:• Carry out Censuses and relevant surveys in the <strong>Southern</strong> <strong>Sudan</strong>• Promote and develop integrated socio-economic statistics pertaining to <strong>Southern</strong> <strong>Sudan</strong> and each region there<strong>of</strong> and co-ordinate plans <strong>for</strong> the integration <strong>of</strong> thosestatistics and keep these plans under review.• Establish statistical standards and their use by all producers <strong>of</strong> statistics so as to facilitate integration and comparison.• Co-ordinate statistics and data collection activities so as to avoid duplication, ensure economic use <strong>of</strong> resources and reduce the burden on respondents.• Collect, compile, analyse and disseminate statistics and related in<strong>for</strong>mation on social, economic, demographic and environmental activities.• Maintain an inventory <strong>of</strong> available and relevant in<strong>for</strong>mation in the <strong>Southern</strong> <strong>Sudan</strong>.• Assist users <strong>of</strong> statistical in<strong>for</strong>mation in obtaining international statistics and in<strong>for</strong>mation.• Provide statistical, monitoring and evaluation services and pr<strong>of</strong>essional assistance to <strong>of</strong>ficial bodies, civil society, researchers and international institutions and thepublic in general.• Provide the contact point <strong>for</strong> international organizations and researchers in need <strong>of</strong> statistics and in<strong>for</strong>mation on <strong>Southern</strong> <strong>Sudan</strong>.• Act as a contact point <strong>for</strong> international organizations and <strong>for</strong>eign institutions in the need <strong>of</strong> statistics on matters relating to <strong>Southern</strong> <strong>Sudan</strong>.Organization <strong>of</strong> the SSCCSETo reflect the main goals and objectives <strong>of</strong> the Centre and to make sure that its work is carried out in a cost effective way, the SSCCSE has:• An Organizational Chart• A number <strong>of</strong> subject matter specialists to be recruited consistent with the Organizational Chart <strong>of</strong> the Centre.• A data collection system <strong>for</strong> vital records, surveys and censuses, with the corresponding specialized functions like questionnaire design, sampling, field management,cartography etcIn order to be able to carry out the principal functions, a number <strong>of</strong> support functions have also been put in place.Thus the Head Office in Juba has four main technical departments viz. Census and Surveys Department, Economic Statistics Department, Social and DemographicStatistics Department and Geographical In<strong>for</strong>mation Systems (GIS) Department. Additionally, there are three support departments – Finance Department, AdministrationDepartment and In<strong>for</strong>mation Technology (IT) Department.xii
The Juba and Rumbek OfficesThe SSCCSE has its headquarters in Juba where most <strong>of</strong> its activities are supervised from. It also has a data processing centre in Rumbek whereall census and other data processing is executed.Additionally, State <strong>Statistical</strong> <strong>of</strong>fices have been established in every one <strong>of</strong> the ten (10) states. These <strong>of</strong>fices are central to the Centre’s ability to mount large-scale South-<strong>Sudan</strong>-wide statistical activities; they are also our focal communication links with various State and local authorities in different states.Contact addresses <strong>of</strong> <strong>of</strong>ficials <strong>of</strong> the Centre are provided at the back <strong>of</strong> this <strong>Yearbook</strong> <strong>for</strong> ease <strong>of</strong> future collaboration.xiii
Population and Demography1
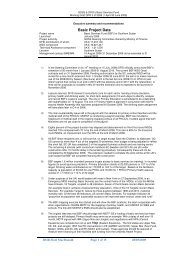
Population by State <strong>of</strong> Enumeration <strong>Southern</strong> <strong>Sudan</strong>State <strong>of</strong> EnumerationPopulation enumeratedUpper Nile 964,353Jonglei 1,358,602Unity 585,801Warrap 972,928Northern Bahr-El-Ghazal 720,898Western Bahr-El-Ghazal 333,431Lakes 695,730Western Equatoria 619,029Central Equatoria 1,103,592Eastern Equatoria 906,126<strong>Southern</strong> <strong>Sudan</strong> 8,260,490Source: <strong>Sudan</strong> Population and Housing Census, 20082
Population by County <strong>of</strong> Enumeration Upper Nile StateState and County <strong>of</strong> EnumerationTotal Number <strong>of</strong> People EnumeratedUPPER NILE STATE 964,353Renk 137,751Manyo 38,010Fashoda 36,518Melut 49,242Maban 45,238Maiwut 79,462Luakpiny/Nasir 210,002Longochuk 63,166Ulang 85,044Baliet 48,010Malakal 126,483Panyikang 45,427Source: <strong>Sudan</strong> Population and Housing Census, 2008Population by County <strong>of</strong> Enumeration Jonglei StateState and County <strong>of</strong> EnumerationTotal Number <strong>of</strong> People EnumeratedJONGLEI STATE 1,358,602Old Fangak 110,130Khorflus 99,068Ayod 139,282Duk 65,588Wuror 178,519Nyirol 108,674Akobo 136,210Pochalla 66,201Pibor 148,475Twic East 85,349Bor South 221,106Source: <strong>Sudan</strong> Population and Housing Census, 20083
Population by County <strong>of</strong> Enumeration Unity StateState and County <strong>of</strong> EnumerationTotal Number <strong>of</strong> People EnumeratedUNITY STATE 585,801Pariang 82,443Abiemnhom 17,012Mayom 120,715Rubkona 100,236Guit 33,004Koch 74,863Leer 53,022Mayendit 53,783Payinjar 50,723Source: <strong>Sudan</strong> Population and Housing Census, 2008Population by County <strong>of</strong> Enumeration Warrap StateState and County <strong>of</strong> EnumerationTotal Number <strong>of</strong> People EnumeratedWARRAP 972,928Abyei 52,883Twic 204,905Gogrial West 243,921Gogrial Eest 103,283Tonj North 165,222Tonj East 116,122Tonj South 86,592Source: <strong>Sudan</strong> Population and Housing Census, 20084
Population by County <strong>of</strong> Enumeration Northern Bahr El Ghazal StateState and County <strong>of</strong> EnumerationTotal Number <strong>of</strong> People EnumeratedNORTHERN BAHR EL GHAZAL 720,898Aweil North 129,127Aweil East 309,921Aweil South 73,806Aweil West 166,217Aweil Centre 41,827Source: <strong>Sudan</strong> Population and Housing Census, 2008Population by County <strong>of</strong> Enumeration Western Bahr El Ghazal StateState and County <strong>of</strong> EnumerationTotal Number <strong>of</strong> People EnumeratedWESTERN BAHR EL GHAZAL 333,431Raga 54,340Jur River 127,771Wau 151,320Population by County <strong>of</strong> Enumeration Lakes StateState and County <strong>of</strong> EnumerationSource: <strong>Sudan</strong> Population and Housing Census, 2008Total Number <strong>of</strong> People EnumeratedLAKES 695,730Cueibit 117,755Rumbek North 43,410Rumbek Centre 153,550Wulu 40,550Rumbek East 122,832Yirol West 103,190Yirol East 67,402Awerial 47,041Source: <strong>Sudan</strong> Population and Housing Census, 20085
Population by County <strong>of</strong> Enumeration Western Equatoria StateState and County <strong>of</strong> EnumerationTotal Number <strong>of</strong> People EnumeratedWESTERN EQUATORIA 619,029Tambura 55,365Nagero 10,077Nzara 65,712Ezo 80,861Yambio 152,257Ibba 41,869Maridi 82,461Mvolo 48,134Mundri West 33,975Mundri East 48,318Source: <strong>Sudan</strong> Population and Housing Census, 2008Population by County <strong>of</strong> Enumeration Central Equatoria StateState and County <strong>of</strong> EnumerationTotal Number <strong>of</strong> People EnumeratedCENTRAL EQUATORIA 1,103,592Terekeka 140,396Juba 372,413Lainya 89,315Yei 201,443Morobo 103,603Kajo Keji 196,422Source: <strong>Sudan</strong> Population and Housing Census, 20086
Population Distribution by County <strong>of</strong> Enumeration Eastern Equatoria StateState and County <strong>of</strong> EnumerationTotal Number <strong>of</strong> People EnumeratedEASTERN EQUATORIA 906,126Magwi 169,826Torit 99,740Lafon 106,161Kapoeta North 103,084Kapoeta East 163,997Kapoeta South 79,470Budi 99,199Ikotos 84,649Population Distribution by Age, Sex and State <strong>of</strong> EnumerationSource: <strong>Sudan</strong> Population and Housing Census, 2008StateAll Ages 00 - 16 17 and aboveTotal Male Female Total Male Female Total Male FemaleUpper Nile 964,353 525,430 438,923 475,419 263,930 211,489 488,934 261,500 227,434Jonglei 1,358,602 734,327 624,275 665,521 373,801 291,720 693,081 360,526 332,555Unity 585,801 300,247 285,554 311,477 162,516 148,961 274,324 137,731 136,593Warrap 972,928 470,734 502,194 496,041 250,582 245,459 476,887 220,152 256,735Northern Bahr-El-Ghazal 720,898 348,290 372,608 371,586 188,322 183,264 349,312 159,968 189,344Western Bahr-El-Ghazal 333,431 176,895 156,536 155,474 81,512 73,962 177,957 95,383 82,574Lakes 695,730 365,999 329,731 334,352 176,777 157,575 361,378 189,222 172,156Western Equtoria 619,029 318,469 300,560 266,744 140,903 125,841 352,285 177,566 174,719Central Equatoria 1,103,592 581,544 522,048 517,385 269,748 247,637 586,207 311,796 274,411Eastern Equatoria 906,126 465,365 440,761 453,450 240,539 212,911 452,676 224,826 227,850Source: <strong>Sudan</strong> Population and Housing Census, 20087
Population Pyramid <strong>for</strong> <strong>Southern</strong> <strong>Sudan</strong>Male95-0090-9485-8980-7975-7970-7465-6960-6455-5950-5445-4940-4435-3930-3425-2920-2415-1910-145-90-4Female80000070000060000050000040000030000020000010000000100000200000300000400000500000600000700000Source: <strong>Sudan</strong> Population and Housing Census, 20088
Population by Region <strong>of</strong> OriginRegions Total Male FemaleAll <strong>Sudan</strong> 39,154,490 20,073,977 19,080,513Northern 3,112,334 1,568,676 1,543,658Eastern 3,999,322 2,190,699 1,808,623Khartoum 1,405,772 713,925 691,847Central 7,466,567 3,697,279 3,769,288Kordufan 5,686,337 2,820,921 2,865,416Darfur 8,505,564 4,423,479 4,082,085Upper Nile 2,990,840 1,592,495 1,398,345Bahr El Ghazal 2,879,482 1,449,743 1,429,739Equatoria 2,563,779 1,314,250 1,249,529Not <strong>Sudan</strong> 177,042 105,714 7 1,328No Response 4,359 2,559 1,800Not Reported 363,092 194,237 168,855Area and Population Density by StateSource: <strong>Sudan</strong> Population and Housing Census, 2008STATE Population Area (sq km) % Area South DensityCentral Equatoria 1,103,592 43,033.00 6.68 25.65Northern Bahr el Ghazal 720,898 30,543.34 4.74 23.60Warrap 972,928 45,566.32 7.07 21.35Lakes 695,730 43,595.06 6.77 15.96Unity 585,801 37,836.69 5.87 15.48Upper Nile 964,353 77,283.41 11.99 12.48Eastern Equatoria 906,126 73,472.01 11.40 12.33Jonglei 1,358,602 122,580.83 19.02 11.08Western Equatoria 619,029 79,342.65 12.31 7.80Western Bahr el Ghazal 333,431 91,076.06 14.14 3.66Total 8,260,490 644,329.38 100.00 14.94Source: <strong>Sudan</strong> Population and Housing Census, 2008; SSCCSE9
Changes in Population by State Since 1983State Composite Area Councils (1983) 1983 2008 Growth RateNorthern Bahr El Ghazal Aweil Area Council 746,358 720,898 -3.41%Western Bahr El Ghazal Raga and Wau Area Council 220,453 333,431 51.25%Warrap Western Area Council 794,231 972,928 22.50%Lakes Central Area Council 504,468 695,730 37.91%Unity Western Area Council 311,042 585,801 88.34%Upper Nile West Central, Central, Northern, Eastern Area Council 549,283 964,353 75.57%Jonglei Pibor, Bor, Fangak 797,251 1,358,602 70.41%Western Equatoria Tambura, Yambio, Maridi 359,056 619,029 72.40%Central Equatoria 565,442 1,103,592 95.17%Eastern Equatoria 81,683 4906,126 88.12%<strong>Southern</strong> <strong>Sudan</strong> 5,329,267 8,260,490 55.00%Source: <strong>Sudan</strong> Population and Housing Census, 200810
Maps11
Health and Nutrition25
Neonatal Mortality Rate by state (2006)807066.0 67.069.0Deaths per 1000live births6050403054.038.030.037.049.056.040.020100Upper NileJongleiUnityWarrapNorthern Bahr El GhazalWestern Bahr El GhazalLakesWestern EquatoriaCentral EquatoriaEastern EquatoriaSource: <strong>Sudan</strong> Household Health Survey, 200626
Post neonatal mortality rate by state (2006)9082.08072.0Deaths per 1000live births706050403029.035.0 34.062.060.040.051.043.020100Upper NileJongleiUnityWarrapNorthern Bahr El GhazalWestern Bahr El GhazalLakesWestern EquatoriaCentral EquatoriaEastern EquatoriaSource: <strong>Sudan</strong> Household Health Survey, 200627
Infant Mortality Rate (2006)160151.0140139.0129.0120107.0Deaths per 1000 live births10080604082.074.064.097.090.083.0200UpperNileJonglei Unity Warrap NorthernBahr ElGhazalWesternBahr ElGhazalLakesWesternEquatoriaCentralEquatoriaEasternEquatoriaSource: <strong>Sudan</strong> Household Health Survey, 200628
Under-five Mortality Rate (2006)250Deaths per 1000 live births20015010050110.0 108.082.0176.0165.0134.0114.0192.0141.0118.00Upper NileJongleiUnityWarrapNorthern Bahr El GhazalWestern Bahr El GhazalLakesWestern EquatoriaCentral EquatoriaEastern EquatoriaSource: <strong>Sudan</strong> Household Health Survey, 200629
Children less than 1 year old fully immunized (2006) (BCG,DPT1-3,OPV1-3, and measles)504543.64035Percentage30252028.523.51511.812.213.8105.9 5.57.18.250Upper NileJongleiUnityWarrapNorthern Bahr El GhazalWestern Bahr El GhazalLakesWestern EquatoriaCentral EquatoriaEastern EquatoriaSource: <strong>Sudan</strong> Household Health Survey, 200630
Maternal Mortality Rate (2006)250020942173 2182 2216 22432327Deaths per 100,000 live births200015001000500186117321867 18440Upper NileJongleiUnityWarrapNorthern Bahr El GhazalWestern Bahr El GhazalLakesWestern EquatoriaCentral EquatoriaEastern EquatoriaSource: <strong>Sudan</strong> Household Health Survey, 200631
Contraceptive Prevalence Rate (2006)8.07.57.0Percentage6.05.04.03.04.52.52.95.33.62.84.82.01.41.00.0Upper Nile0.1JongleiUnityWarrapNorthern Bahr El GhazalWestern Bahr El GhazalLakesWestern EquatoriaCentral EquatoriaEastern EquatoriaSource: <strong>Sudan</strong> Household Health Survey, 200632
Percentage <strong>of</strong> women who have heard <strong>of</strong> AIDS (2006)1009087.48072.9706056.5Percentage504045.445.334.650.648.53024.827.820100UpperJonglei Unity Warrap NorthernWesternLakesWesternCentralEasternNileBahr ElBahr ElEquatoriaEquatoriaEquatoriaGhazalGhazalSource: <strong>Sudan</strong> Household Health Survey, 200633
Prevalence <strong>of</strong> stunting (2006)45403530Percentage252015105Prevalence <strong>of</strong> stunting (moderateand severe)Prevalence <strong>of</strong> stunting (severe)0Upper NileJongleiUnityWarrapNorthern Bahr El GhazalWestern Bahr El GhazalLakesWestern EquatoriaCentral EquatoriaEastern EquatoriaSource: <strong>Sudan</strong> Household Health Survey, 200634
Prevalence <strong>of</strong> underweight (2006)50454035Percentage30252015105Prevalence <strong>of</strong> underweight(moderate and severe)Prevalence <strong>of</strong> underweight (severe)0Upper NileJongleiUnityWarrapNorthern Bahr El GhazalWestern Bahr El GhazalLakesWestern EquatoriaCentral EquatoriaEastern EquatoriaSource: <strong>Sudan</strong> Household Health Survey, 200635
Prevalence <strong>of</strong> Wasting (2006)353025Percentage201510Prevalence <strong>of</strong> wasting (moderateand severe)5Prevalence <strong>of</strong> wasting (severe)0Upper NileJongleiUnityWarrapNorthern Bahr El GhazalWestern Bahr El GhazalLakesWestern EquatoriaCentral EquatoriaEastern EquatoriaSource: <strong>Sudan</strong> Household Health Survey, 200636
Education37
Net Intake in Primary Education (2006)25202015.4Percentages15108.156.64.83.95.61.9 210UpperNileJonglei Unity Warrap NorthernBahr ElGhazalWesternBahr ElGhazalLakesWesternEquatoriaCentralEquatoriaEasternEquatoriaSource: <strong>Sudan</strong> Household Health Survey, 200638
Net attendance ratio in primary education (2006)504544.9434035Percentage30252022.8151059.74.37.75.78.711.313.90UpperNileJonglei Unity Warrap NorthernBahr ElGhazalWesternBahr ElGhazalLakesWesternEquatoriaCentralEquatoriaEasternEquatoriaSource: <strong>Sudan</strong> Household Health Survey, 200639
Net attendance ratio in primary education by sex (2006)50454035Percentage30252015Net attendance ratio in primary education(Female)Net attendance ratio in primary education(Male)1050Upper NileJongleiUnityWarrapNorthern BahrEl GhazalWestern Bahr ElGhazalLakesWesternEquatoriaCentralEquatoriaEasternEquatoriaSource: <strong>Sudan</strong> Household Health Survey, 200640
Secondary School Net Attendance Rate (2006)141210Percentage86420UpperNileJonglei Unity Warrap NorthernBahr ElGhazalWesternBahr ElGhazalLakesWesternEquatoriaCentralEquatoriaEasternEquatoriaSource: <strong>Sudan</strong> Household Health Survey, 200641
Secondary School Net Attendance Rate by sex (2006)18161412Percentage10864Secondary school net attendance rate(Female)2Secondary school net attendance rate(Male)0Upper NileJongleiUnityWarrapNorthern Bahr El GhazalWestern Bahr El GhazalLakesWestern EquatoriaCentral EquatoriaEastern EquatoriaSource: <strong>Sudan</strong> Household Health Survey, 200642
Primary Completion Rate (2006)504543.3403530Percentages2520151050.44.20.41.710.452.31.60Upper Nile Jonglei Unity Warrap NorthernBahr ElGhazalWesternBahr ElGhazalLakesWesternEquatoriaCentralEquatoriaEasternEquatoriaSource: <strong>Sudan</strong> Household Health Survey, 200643
School attendance rates <strong>of</strong> orphans and non-orphans (2006)706050Percentage403020School attendance rate <strong>of</strong> childrenaged 10-14 years <strong>of</strong> whom bothparents are alive and child is livingwith at least one parent10School attendance rate <strong>of</strong> childrenaged 10-14 years whose mother0Upper NileJongleiUnityWarrapNorthern Bahr El GhazalWestern Bahr El GhazalLakesWestern EquatoriaCentral EquatoriaEastern EquatoriaSource: <strong>Sudan</strong> Household Health Survey, 200644
Gender45
Gender composition <strong>of</strong> <strong>Southern</strong> <strong>Sudan</strong> Legislative AssemblyState No. <strong>of</strong> Women No. <strong>of</strong> Men Total Percentage <strong>of</strong>WomenPercentage <strong>of</strong> MenUpper Nile 1 20 21 5% 95%Unity 3 10 13 23% 77%Jonglei 4 15 19 21% 79%Western Bahr-el-Ghazal 3 12 15 20% 80%Northern Bahr-el-Ghazal 3 11 14 21% 79%Lakes 4 11 15 27% 73%Warrap 4 15 19 21% 79%Western equatoria 3 15 17 18% 88%Central Equatoria 5 16 21 24% 76%Eastern Equatoria 3 11 14 21% 79%Total 33 136 168 20% 81%Source: SSLA Protocol Office46
Gender Composition <strong>of</strong> <strong>Southern</strong> <strong>Sudan</strong> Legislative Assembly252020151010151211 1115 1516115343 34 4353No.<strong>of</strong> Female1No. <strong>of</strong> Male0Upper NileUnityJongleiWestern Bahr-el-GhazalNorthern Bahr-el-GhazalLakesWarrapWestern equatoriaCentral EquatoriaEastern EquatoriaSource: SSLA Protocol Office47
Gender composition <strong>of</strong> States Legislative AssembliesState Female Male Total Female MaleUpper Nile 10 38 48 21% 79%Unity 9 38 47 19% 81%Jonglei 11 37 48 23% 77%Western Bahr el Ghazal 15 33 48 31% 69%Northern Bahr el Ghazal 11 37 48 23% 77%Warrap 8 40 48 17% 83%Lakes 13 35 48 27% 73%Western Equatoria 13 35 48 27% 73%Central Equatoria 10 36 46 22% 78%Eastern Equatoria 8 40 48 17% 83%Data Source: States Legislative Assemblies48
Gender composition <strong>of</strong> States Legislative Assembly45403530252015105FemaleMale0Upper NileUnityJongleiWest Bahr el GhazalNorth Bahr el GhazalWarrapLakesWest EquatoriaCentral EquatoriaEast EquatoriaData Source: States Legislative Assembly49
Gender composition <strong>of</strong> Council <strong>of</strong> Ministers (GOSS)12%Female Male Total3 23 26FemaleMale88%Source: Ministry Of Cabinet AffairsGender Composition <strong>of</strong> Chairpersons in GOSSFemale9%Female Male Total2 20 22Male91%Source: Ministry Of Cabinet Affairs50
Gender Composition <strong>of</strong> Governors10%Position Female Male TotalGovernor 1 9 10FemaleMale90%Gender distribution <strong>of</strong> Speakers <strong>of</strong> State Legislative AssembliesSource: Ministry Of Cabinet Affairs10%FemaleMaleParticular Female Male TotalSpeaker 1 9 1090%Source: SSLA Protocol Office51
Forestry53
Area under Forest Reserves, National Parks and Game Reserves in <strong>Southern</strong> <strong>Sudan</strong>Central Forest ReservesState Reserved Forest Under Reservation TotalNumber Area(Ha) Number Area(Ha) Number Area(Ha)Upper Nile 26 204,488 13 361,093 39 565,580Unity 0 0 1 2,179 1 2,179Jonglei 1 204 4 9,089 5 9,293West Bahr-el-Ghazal 12 304,730 0 0 12 304,730North Bahr-el-Ghazal 0 0 11 23,396 11 23,396Lakes 3 12,240 0 0 3 12,240Warrap 1 641 0 0 1 641West equatoria 13 61,958 5 12,364 18 74,322Central Rquatoria 12 58,353 6 21,153 18 79,506East Equatoria 4 120,165 9 13,633 13 133,798Total Forest Reserves 72 762,779 49 442,907 121 1,205,685Source: Ministry <strong>of</strong> Agriculture and ForestryGame Reserves in <strong>Southern</strong> <strong>Sudan</strong>State Game Reserves Date Location Total Area (Ha)Western Equatoria Asansa 1939 26,22E 8,54N 90,000Western Bahr el-Ghazal Celco 1975 26,22E 8,16N 550,000Jonglei Zaraf 1939 30,24E 8,44N 970,000Upper Nile Panyikango 1939 31,20>E 9,09N 48,000Western Bahr el-Ghazal Nominitina 1939 27,20>E 6,45N 21,000Western Equatoria Bangagei 1939 27,30>E 5,50N 17,000Western Equatoria Bira kabusi 1939 50,000Total Game Reserves 1,746,000Source: Ministry <strong>of</strong> Agriculture and Forestry54
Tourism55
Rooms Capacity <strong>of</strong> selected hotels in JubaS/No Hotels Rooms Capacity1 Rock City 542 South-<strong>Sudan</strong> Hotel 1 553 Jebel Lodge 354 New York Hotel 645 Green Rokon Hotel 226 Juba Grand Hotel 807 Star Hotel 458 Oasis Camp 459 White Nile Lodge 7710 Rock Shield Hotel 4411 Eden Hotel 1712 Paradiso Hotel at Thongpiny 1513 Tourists Hotel 1714 Heron Campsite 6015 Akok River Side Hotel 6316 Paradiso Hotel at Atlabara 1717 Nile Beach Hotel 5018 Sun Flower Hotel 8019 Nile Com<strong>for</strong>t Inn 4020 Mango Camp Hotel 1621 Wankoo Guest House896Data Source: Wild Life conservation and Tourism56
Displacement57
Voluntary Repatriation (2006-<strong>2009</strong>)Countries2006 2007 2008 <strong>2009</strong> Cumulative Total <strong>2009</strong>FAM IND FAM IND FAM IND FAM IND FAM INDCentral African Republic 1251 3262 2109 5154 0 0 1 3 3,361 8,419Democratic Republic <strong>of</strong> Congo 1785 5550 361 936 1 8 0 0 2,147 6,494Uganda 1561 5749 4965 17108 10805 41908 7,451 29,702 24,782 94,467Kenya 926 1,807 1865 4,767 3,239 8,423 276 587 6,306 15,584Ethiopia 1,131 4,625 4,458 17,631 2,663 10,215 259 942 8,511 33,413Eritrea 0 0 3 3 0 0 0 0 3 3Egypt 0 0 0 0 0 0 0 0 0 0Others 3 3 111 196 5 10 2 2 121 211Grand Total 6,657 20,996 13,872 45,795 16,713 60,564 7,989 31,236 45,231 158,591N.B. FAM – FamiliesIND - IndividualsData source: <strong>Southern</strong> <strong>Sudan</strong> Relief and Rehabilitation Commission58
Voluntary Repatriation <strong>of</strong> Individuals (2006-<strong>2009</strong>)4500040000350003000025000200001500010000200620072008<strong>2009</strong>50000Central AfricanDemocraticUganda Kenya Ethiopia Eritrea OthersRepublicRepublic <strong>of</strong>CongoData source: <strong>Southern</strong> <strong>Sudan</strong> Relief and Rehabilitation Commission59
Assisted Voluntary Repatriation since 2005N.B. FAM – FamiliesIND - IndividualsCountries2005 2006 2007 2008 <strong>2009</strong>Cumulative Total<strong>2009</strong>FAM IND FAM IND FAM IND FAM IND FAM IND FAM INDCentral African Republic 0 0 632 1,285 15 41 1 1 0 0 648 1327Democratic Republic <strong>of</strong> Congo 0 0 286 869 346 973 0 0 0 0 632 1842Uganda 18 31 18 86 89 226 198 736 43 127 366 1206Kenya 40 133 63 379 1 27 2 2 0 0 106 541Ethiopia 0 0 261 1,312 765 2,268 70 153 1 1 1097 3734Eritrea 0 0 0 0 0 0 0 0 0 0 0 0Egypt 24 43 560 881 884 1,602 483 954 141 269 2092 3749Others 3 5 3 3 0 0 0 0 0 0 6 8Grand Total 85 212 1823 4,815 2,100 5,137 754 1,846 185 397 4947 12407Data source: <strong>Southern</strong> <strong>Sudan</strong> Relief and Rehabilitation Commission60
Assisted Voluntary Self-Repatriation since 200525002000150010002005200620072008500<strong>2009</strong>0CentralDemocraticUganda Kenya Ethiopia Eritrea Egypt OthersAfricanRepublic <strong>of</strong>RepublicCongoData source: <strong>Southern</strong> <strong>Sudan</strong> Relief and Rehabilitation Commission61
Cumulative Returns <strong>of</strong> IDPs and Refugees (2004-2008)States Total Return 2004-2008 RemarksNorthern Bahr El Ghazal500,000 IDPs/ RefugeesCentral Equatoria 220,500 “Jonglei 210,000 “Upper Nile 165,900 “Warrap 180,000 “Western Equatoria 160,400 “Unity 135,000 “Lakes 100,500 “Eastern Equatoria 80,000 “Western Bahr El Ghazal 60,000 “Total1,812,300 IDPS and RefugeesTotalThe Three Areas<strong>Southern</strong> Kord<strong>of</strong>anAbyeiBlue NileTotal1,812,300 For <strong>Southern</strong> <strong>Sudan</strong>250,500 IDPs90,000 IDPs & Refugees50,275 IDPs & Refugees390,775 PersonsData source: <strong>Southern</strong> <strong>Sudan</strong> Relief and Rehabilitation Commission62
Cumulative Returns <strong>of</strong> IDPs and Refugees (2004-2008)600,000500,000400,000300,000200,000100,0000NorthernCentralJonglei Upper Nile Warrap WesternUnity Lakes EasternWesternBahr ElEquatoriaEquatoriaEquatoriaBahr ElGhazalGhazalData source: <strong>Southern</strong> <strong>Sudan</strong> Relief and Rehabilitation Commission63
Demining65
Number <strong>of</strong> hazards by stateStateClosed HazardsOpen HazardsDA* MF** SHA*** DA MF SHAUnity 15 0 0 11 0 2Upper Nile 34 1 0 57 11 12Warrap 285 0 2 82 0 2West Bahr El Ghazal 191 0 5 191 0 5West Equatoria 208 0 13 118 0 17Central Equatoria 734 1 81 390 4 133Eastern Equatoria 594 0 76 172 34 7Jonglei 36 0 0 63 6 21Lakes 137 0 0 33 0 1Northern Bahr el Ghazal 60 0 2 49 1 5Total 2294 2 179 1166 56 205NoteDA*: Dangerous AreaMF**: Mine FieldSHA***: Suspected Hazard AreaArea Cleared (square metres) per stateData Source: <strong>Southern</strong> <strong>Sudan</strong> Demining CommissionState Prior to <strong>2009</strong> Year <strong>2009</strong> TotalUnity 0 38,031 38,031Upper Nile 4,403,205 1,399,579 5,802,784Warrap 21,613 21,613Western Bahr El Ghazal 954,047 137,688 1,091,735Western Equatoria 312,345 312,345Central Equatoria 13252519 2067375 15319894Eastern Equatoria 1377356 179618 1556974Jonglei 357,144 0 357,144Lakes 882,910 0 882,910Northern Bahr el Ghazal 16,474 0 16,474Total 21,577,613 3,822,291 25,399,904Data Source: <strong>Southern</strong> <strong>Sudan</strong> Demining Commission66
Area cleared (square metres) by organizationArea cleared Prior to <strong>2009</strong> Year <strong>2009</strong> TotalArmour Group 3,971,827 1,071,570 5,043,397Bangladeshi military demining company 2,589,208 33,631 2,622,839Cambodian military demining company 3,018,075 165,785 3.183,860Danish church aid 173,725 202,636 376,361Danish demining group 25 0 25Egyption military demining company 99,694 78,132 177,826FSD UNOPS 2,679,270 0 2,679,270FSD WFP 400,308 0 400,308Kenyan military demining 124,136 12,785 136,921Land mine Action UK 115,333 0 115,333MECHEM 203,349 200,593 403,942Mine Advisory Group 2,043,105 368,804 2,411,909Mine Tech International 955,683 1,971,273 2,926,956Mine Wolf 71,269 72,281 143,550National Mine Action Centre 18,260,000 0 18,260,000Norwegian People Aid 3,032,453 114,923 3,147,376Pakistan military dimining company 84,661 47,696 132,357RONCO 5,565,255 408,445 5,973,700<strong>Sudan</strong> integrated mine action 38,881 2,207 41,088TDI 921,113 107,177 1,028,290Total 44,347,370 4,857,938 49,205,308N.B. Data here refer to the whole <strong>of</strong> <strong>Sudan</strong>Data Source: <strong>Southern</strong> <strong>Sudan</strong> Demining Commission67
Devices destroyed per regionPrior to <strong>2009</strong>Year <strong>2009</strong>*Total<strong>2009</strong> * includes figures till May <strong>2009</strong>SAA- Small Arms AmmunitionPeriod Type <strong>of</strong> Devices Bahr El Ghazal Equatoria Upper NileAP 722 9,037 2,564AT 491 1,209 883FRAG 0 2 0SAA* 26,029 239,783 21,402UXO 123,404 621,768 34,202AP 478 365 501AT 119 57 31FRAG 0 0 0SAA* 428,688 32,198 1500UXO 9,821 7,059 1,093AP 1,200 9,402 3,065AT 610 1,266 914FRAG 0 2 0SAA* 454,717 271,981 22,902UXO 133,225 628,827 35,295Data source: <strong>Southern</strong> <strong>Sudan</strong> Demining Commission68
Mine victims by gender and age categoryState Gender Prior Year <strong>2009</strong> Year <strong>2009</strong> TotalMale 915 3 918UnknownFemale 151 0 151Unknown 133 10 143Male 539 12 551ChildrenFemale 125 3 128Unknown 0 0 0Male 1,735 8 1743AdultsFemale 211 1 212Unknown 7 0 7Male 303 3 30645 and AboveFemale 50 1 51Unknown 1 0 1Male 3,492 26 3518TotalFemale 537 5 542Unknown 141 10 151Total 4,170 41 4211N.B. Data here refer to the whole <strong>of</strong> <strong>Sudan</strong>Number <strong>of</strong> victims per state <strong>of</strong> incident69Data Source: <strong>Southern</strong> <strong>Sudan</strong> Demining CommissionStatePrior Year <strong>2009</strong> Apr-09 May-09 Year <strong>2009</strong> TotalKilled Injured Killed Injured Killed Injured Killed Injured Killed InjuredUnity 6 15 0 0 0 0 0 3 6 18Upper Nile 56 117 0 0 0 2 1 3 57 120Warrap 24 93 0 0 0 2 0 3 24 96West Bahr El Ghazal 445 717 0 0 0 0 0 0 445 717West Equatoria 15 28 0 0 0 0 0 0 15 28Central Equatoria 297 556 0 0 0 0 0 0 297 556Eastern Equatoria 28 81 0 0 2 3 2 4 30 85Jonglei 22 69 0 0 0 0 0 1 22 70Lakes 27 31 0 0 0 0 2 9 29 40Northern Bahr el Ghazal 15 30 2 0 0 0 3 1 18 31Total 1021 1999 2 0 2 7 8 24 943 1761Data Source: <strong>Southern</strong> <strong>Sudan</strong> Demining Commission
Activities <strong>of</strong> the Victims at the time <strong>of</strong> incidentActivities Prior to <strong>2009</strong> Year-<strong>2009</strong> TotalNot Specified 914 12 926Collecting Food/Water/Wood 355 0 355Demining 12 0 12Farming 243 4 247Household work 5 0 5Hunting Fishing 60 0 60Malitary 782 3 785Other 142 3 145Passing/Standing Nearby 166 0 166Playing Recreation 145 5 150Police 29 0 29Tempering 75 10 85Tending Animals 145 0 145Travelling 1,097 4 1101Total 4170 41 4,211N.B. Data here refer to the whole <strong>of</strong> <strong>Sudan</strong>Data Source: <strong>Southern</strong> <strong>Sudan</strong> Demining Commission70
Water, Sanitation and Environment71
Proportion <strong>of</strong> the Population using improved water sources (2006)80706050Percentage403020100Upper NileJongleiUnityWarrapNorthern Bahr El GhazalWestern Bahr El GhazalLakesWestern EquatoriaCentral EquatoriaEastern EquatoriaSource: <strong>Sudan</strong> Household Health Survey, 200672
Percentage <strong>of</strong> population using sanitary means <strong>of</strong> excreta disposal (2006)161413.61211.2Percentage10867.51655.55.38.55.65421.90Upper NileJongleiUnityWarrapNorthern Bahr El GhazalWestern Bahr El GhazalLakesWestern EquatoriaCentral EquatoriaEastern EquatoriaSource: <strong>Sudan</strong> Household Health Survey, 200673
Proportion <strong>of</strong> Households with appropriate water treatment (2006)4037.5353030.4Percentage25201512.416.511.620.21078.16.452.30Upper NileJongleiUnityWarrapNorthern Bahr El GhazalWestern Bahr El GhazalLakesWestern EquatoriaCentral EquatoriaEastern EquatoriaSource: <strong>Sudan</strong> Household Health Survey, 200674
Mean time to source <strong>of</strong> drinking water (2006)4037.5353030.4Percentage25201512.416.511.620.21078.16.452.30Upper NileJongleiUnityWarrapNorthern Bahr El GhazalWestern Bahr El GhazalLakesWestern EquatoriaCentral EquatoriaEastern EquatoriaSource: <strong>Sudan</strong> Household Health Survey, 200675
Proportion <strong>of</strong> the population using solid fuels <strong>for</strong> cooking (2006)100.0090.0088.2096.593.880.592.396 94.8 99.4 97.6 97.280.0070.00Percentage60.0050.0040.0030.0020.0010.000.00Upper NileJongleiUnityWarrapNorthern Bahr El GhazalWestern Bahr El GhazalLakesWestern EquatoriaCentral EquatoriaEastern EquatoriaSource: <strong>Sudan</strong> Household Health Survey, 200676
Money and Banking77
Money supply – 2007 and 2008Money supply <strong>for</strong> the year 2007-2008 in million SDG in million SDGItem 2007 2008(1) Money (A+B) n.a 1281.2A. Currency with the public n.a 963B. Demand deposits 151 318.22> Quasi money 50 112.3Money supply =(I+G)Demand deposits includes commercial banks deposit at BOSS and public depositat Commercial banksFactors Affecting Money Supply (2008)Source: Bank <strong>of</strong> <strong>Southern</strong> <strong>Sudan</strong> Statistics DepartmentItem 2007 2008A- Money supply NA 1,281.00B- Main factors influencing money supply NA 1,281.001. Foreign assets (net) 894 118.32.Revaluation 14 -8.13. local assets (net) 114 388.5Claims on public sectorGOSS, State and local government NA 318Public corporations NA 39.1Claims on private sector 44 200Claims on commercial banks 248 176Other items (net) 0Total (B=A)Source: Bank <strong>of</strong> <strong>Southern</strong> <strong>Sudan</strong> Statistics Department78
Consolidated conventional commercial banks balance sheet (2007-2008)in million SDG in million SDGItem 2007 2008Liabilities1. Deposits 122 483.7The public 104 455<strong>Government</strong> <strong>of</strong> <strong>Southern</strong> <strong>Sudan</strong> 10.6Public corporation 18 18.12. Balance due to banks 27 58.1Bank <strong>of</strong> southern <strong>Sudan</strong> 24 51Other banks 0.9Foreign banks 3 6.23. Capital and reserves 21 48.3Other accounts 56 124.5Total (1+2+3+4) 226Sources: Commercial banks consolidated balance sheet <strong>for</strong> December 2007-2008Consolidated conventional commercial banks balance sheet (2007-2008), continuedItem in million SDG in million SDG2007 20081- Domestic cash 8 282- Balance due from banks 91 313.5A. BOSS 91 265.5B. Other banks 483- Foreign assests 10 1174- Financing 52 239Other accounts 65 17.1Total 226 714.6Sources: Commercial banks consolidated balance sheet <strong>for</strong> December 2007-200879
Position <strong>of</strong> commercial banks financing by economic activities (2007-2008)in million SDG in million SDGItem 2007 2008Agriculture NA 19.3Industry 28 34.5Construction 28 19.4Transport NA 15.1Imports NA NAExports NA NALocal trade 6 57.6Others 14 7Details <strong>of</strong> deposits (2007-2008)Sources: Commercial banks weekly returns2007 2008Deposit Saving and other deposit Current deposit Saving & other deposit Current deposit<strong>Government</strong> <strong>of</strong> <strong>Southern</strong> <strong>Sudan</strong> 195 10597Public corporation 3 18.086.0Private sector and financial institutions 30 92 83,466 286,476Grand Total 30 290 83,466.00 315.159.0Foreign currency deposit* 898 1,280.00 81,982.00*Foreign currency deposit consists <strong>of</strong> GOSS deposit at BOSS and commercial banks deposit by private sectorSource: Bank <strong>of</strong> <strong>Southern</strong> <strong>Sudan</strong>80
Bank <strong>of</strong> <strong>Southern</strong> <strong>Sudan</strong> Balance Sheet (2007-08) LiabilitiesIn million SDGIn million SDGItem 2007 2008LiabilitiesBank notes and coins in circulation 359 956Sight Liabilities:- GOSS, States and Public corporation 199 429Banks 80 260Foreign correspondentDeferred obligation 15Payment agreementsCapital reserves 21 37Other accounts 135 318other sight liabilities 339 4Others 343 1,321Total 1,491 3,321Bank <strong>of</strong> <strong>Southern</strong> <strong>Sudan</strong> Balance Sheet (2007-08) AssetsSource: Bank <strong>of</strong> <strong>Southern</strong> <strong>Sudan</strong>(in million SDG) (in million SDG)Item 2007 2008AssetsBank Notes, checks and balances 183Foreign securitiesOther <strong>for</strong>eign assets 894 1327Loans and advances to banks 24 25Temporary under article No. GOSS (48-1) 76Long term loans to GOSSLoans and advances to the public institutionsShares in local bank capitalGOSS investment certificateThe central bank <strong>of</strong> <strong>Southern</strong> <strong>Sudan</strong> Ijarah certificatesOther sharesOther accounts 562 1,710Total Assets 918 3,321.00Source: Bank <strong>of</strong> <strong>Southern</strong> <strong>Sudan</strong>81
Distribution <strong>of</strong> banking services by state (2008)BANKCentralEquatoriaEasternEquatoriaLakes Jonglei Unity Upper Nile WesternBahr ElGhazalNorthernBahr ElGhazalWarrapWesternEquatoria1. Nile Commercial Bank 4 1 1 1 1 3 2 1 1 12. Kenya Commercial Bank 1 13. Ivory Bank 2 2 1 14. Agricultural Bank 1 2 1 15. Fausial Islamic Bank 1 1 16. Omdurman National Bank 2 17. Farmers Bank 18. Islamic Development Bank 19. Equity Bank 1TOTAL 12 1 2 1 2 10 5 3 1 1Source: Bank <strong>of</strong> <strong>Southern</strong> <strong>Sudan</strong>82
Annual Inflation Rates (Juba) from June-08 to June-0930.0025.00Inflation Rate (% change)20.0015.0010.005.000.00Jun.08 Jul.08 Aug.08 Sep.08 Oct.08 Nov.08 Dec.08 Jan.09 Feb.09 Mar.09 Apr.09 May.09 Jun.09Source: <strong>Southern</strong> <strong>Sudan</strong> Centre <strong>for</strong> Census Statistics and Evaluation83
<strong>Government</strong> Finance Statistics85
GoSS Budget Outturns & Budget Estimates6,000In million SDG5,0004,0003,0002,0001,000YearOutturn2006 3,581,548,5122007 2,936,495,5522008 5,712,662,066<strong>2009</strong> 3,606,312,23902006 2007 2008 <strong>2009</strong>YearN.B. Estimates <strong>for</strong> 2006 and 2007 are SDG equivalent estimates <strong>of</strong> outturn<strong>2009</strong> are budget estimatesSource: Ministry <strong>of</strong> Finance and Economic Planning86
GoSS Budget Outturns & Budget EstimatesAccountability SectorSECTORGoSS Budget Outturns & Budget EstimatesEconomic Functions, Education and Health SectorsSECTORMINISTRYMINISTRY2006 outturn(SDG equiv)2006 outturn(SDG equiv)2007 outturn(SDG equiv)2007 outturn(SDG equiv)2008 RevisedBudget2008 RevisedBudget2008 outturn(provisional)2008 outturn(provisional)<strong>2009</strong> BudgetEstimatesAccountability Anti-Corruption Commission 1,410,955 2,892,186 7,000,000 4,866,097 5,850,000Audit Chamber 1,012,575 2,898,121 7,000,000 2,608,725 4,000,000SSCCSE 12,169,087 13,122,660 14,000,000 12,158,400 10,000,000Finance & Economic Planning 242,917,006 48,159,020 317,330,823 631,444,863 24,500,000SSFFAMC 927,310 1,458,437 2,000,000 1,823,884 1,856,800SSRDF 399,440 2,836,193 3,108,530 3,096,284 3,356,800Source: Ministry <strong>of</strong> Finance and Economic Planning<strong>2009</strong> BudgetEstimatesEconomic Commerce & Industry 6,029,664 4,572,685 12,000,000 11,074,544 11,500,000Functions Energy & Mining 4,144,908 3,657,645 16,475,000 10,083,654 9,500,000Electricity Corporation 0 13,863,748 110,000,000 90,694,682 60,000,000In<strong>for</strong>mation & Broadcasting 18,840,025 25,533,073 39,324,329 35,188,458 31,000,000Investment Authority 0 1,123,023 1,551,355 1,155,508 1,725,195Telecommunication & Postal services 16,524,063 3,961,285 46,000,000 47,084,231 8,500,000Education Education, Science & Technology 225,150,335 233,071,609 269,864,869 290,219,940 291,300,000Health Health 135,793,846 65,629,529 140,000,000 109,896,475 170,000,000HIV/Aids Commission 259,474 1,582,899 5,092,200 4,194,408 4,856,800Source: Ministry <strong>of</strong> Finance and Economic Planning87
GoSS Budget Outturns & Budget EstimatesInfrastructure, Natural Resources and Rural Development SectorsSECTORMINISTRY2006 outturn 2007 outturn 2008 Revised 2008 outturn <strong>2009</strong> Budget(SDG equiv) (SDG equiv) Budget (provisional) EstimatesInfrastructure Housing, Physical Planning &217,144,590 89,163,467 200,000,000 153,541,962 69,200,000EnvironmentTransport & Roads 126,454,476 71,079,118 686,075,755 638,371,721 460,000,000Urban Water Corporation 0 4,233,751 15,000,000 8,343,501 12,500,000Water Resources and Irrigation 17,231,832 5,857,149 13,000,000 13,650,229 52,792,255Natural Agriculture & Forestry 33,363,038 18,506,545 52,000,000 32,356,173 37,000,000Resources Animal Resources & Fisheries 13,484,451 12,129,445 27,060,920 26,353,571 30,200,000& Rural Devt Cooperatives & Rural Development 7,154,496 9,041,127 35,000,000 27,486,185 9,500,000Wildlife Conservation & Tourism 65,056,099 68,900,259 149,477,674 108,774,614 110,000,000Land Commission 725,569 789,714 2,000,000 1,484,181 1,856,800GoSS Budget Outturns & Budget EstimatesPublic Administration SectorSECTORMINISTRY2006 outturn(SDG equiv)882007 outturn(SDG equiv)2008 RevisedBudgetSource: Ministry <strong>of</strong> Finance and Economic Planning2008 outturn(provisional)<strong>2009</strong> BudgetEstimatesPublic President's Office 44,691,137 31,031,381 128,091,166 157,982,111 33,000,000Administration Vice-President's Office 4,914,808 33,634,783 39,843,499 44,112,822 10,000,000Presidential Affairs 0 52,180,301 13,808,959 11,875,250 13,000,000Cabinet Affairs 47,475,941 37,829,208 44,704,000 52,135,039 29,000,000Labour, Public Service & HRD 5,195,716 7,267,319 10,200,000 8,115,528 15,000,000Parliamentary Affairs 4,462,101 3,443,677 11,000,000 11,221,413 10,500,000Regional Cooperation 10,132,113 15,107,658 27,638,125 32,478,697 19,000,000Civil Service Commission 904,752 1,465,336 2,000,000 2,174,397 1,856,800Local <strong>Government</strong> Board 17,652,388 5,547,750 3,000,000 2,620,554 2,856,800Employees Justice Chamber 905,607 1,611,867 2,841,800 2,246,846 2,698,600Public Grievances Chamber 1,147,124 1,396,697 2,000,000 2,346,794 1,856,800Legislative Assembly 48,108,121 44,111,338 180,175,922 185,322,806 50,000,000Source: Ministry <strong>of</strong> Finance and Economic Planning
GoSS Budget Outturns & Budget EstimatesRule <strong>of</strong> Law, Security and Social and Humanitarian Affairs SectorsSECTORMINISTRYGoSS Budget Outturns & Budget EstimatesBlock Transfers to States2006 outturn(SDG equiv)2007 outturn(SDG equiv)2008 RevisedBudget2008 outturn(provisional)<strong>2009</strong> BudgetEstimatesRule <strong>of</strong> Law Judiciary <strong>of</strong> <strong>Southern</strong> <strong>Sudan</strong> 27,689,394 21,341,438 57,174,512 24,989,494 30,000,000Legal Affairs & Constitutional Development 10,619,755 14,717,554 25,272,765 22,276,455 20,422,642Internal Affairs 311,220,857 218,521,435 420,000,000 462,816,694 377,317,774Human Rights Commission 1,901,338 2,586,613 5,231,150 5,095,555 6,000,000Security De-Mining Authority 3,474,842 3,090,028 3,551,100 3,233,890 2,856,800DDR Commission 3,861,364 3,472,879 6,706,000 5,228,834 20,000,000SPLA Affairs 1,197,493,770 1,185,434,246 1,803,000,000 1,873,621,146 1,019,430,430Social & Gender, Social Welfare & Religious Affairs 3,819,664 4,840,974 8,357,415 7,206,660 9,500,000Humanitarian Culture, Youth and Sport 8,912,449 3,982,531 8,518,287 6,581,887 8,500,000Affairs Peace Commission 5,450,676 2,859,962 3,800,000 3,991,139 2,856,800SECTORWar Disabled, Widows & Orphans 455,393 3,836,160 3,387,896 2,899,779 31,140,678War Veterans Commission 0 2,859,347 3,000,000 2,854,305 2,856,800SSRRC 66,640,069 19,531,238 77,000,000 60,561,628 25,000,000Source: Ministry <strong>of</strong> Finance and Economic PlanningMINISTRY2006 outturn(SDG equiv)2007 outturn(SDG equiv)2008 RevisedBudget2008 outturn(provisional)<strong>2009</strong> BudgetEstimatesBlockState Legislative Assembly 5,910,385 416,023,119 38,000,000 452,720,054 50,666,667Transfers State Executive 318,145,587 407,666,667 370,000,000to States Counties 20,000,000Source: Ministry <strong>of</strong> Finance and Economic Planning89
Average Project Value <strong>of</strong> Donor Projects in million USD (<strong>2009</strong>)54.614Million USD3211.122.050.661.351.62.891.581.390.770AccountabilityEconomic FunctionsEducationHealthInfrastructureNatural ResourcesPublic AdministrationRule <strong>of</strong> LawSecuritySocial and HumanitarianSource: Donor Book <strong>2009</strong>, Ministry <strong>of</strong> Finance and Economic Planning90
Projected Funding by Sector <strong>for</strong> <strong>2009</strong>6055.345049.14403033.7520.502013.5010.6010.55105.152.416.450AccountabilityEconomic FunctionsEducationHealthInfrastructureMillion USDNatural ResourcesPublic AdminstrationRule <strong>of</strong> LawSecuritySocial and HumanitarianSource: Donor Book <strong>2009</strong>, Ministry <strong>of</strong> Finance and Economic Planning91
GOSS Oil RevenueMonthGOSS Oil Revenue2007 2008 <strong>2009</strong>Export Local Crude Total Export Local Crude Total Export Local Crude TotalJanuary 64.5 28.7 93.2 194.14 37.25 231.39 23.31 18.76 42.07February 39.98 20.68 60.66 123.81 34.67 158.48 15.317 15.519 30.836March 15.92 28.61 44.53 200.47 36.67 237.14 34.981 19.523 54.504April 58.16 26.84 85 211.96 5.13 217.09 30.587 21.009 51.596May 87.37 32.67 120.04 185.82 21.24 207.06 35.421 28.006 63.427June 78.76 34.78 113.54 224.49 53.98 278.47July 105.35 34.2 139.55 288.76 93.19 381.95August 113.57 40 153.57 250.71 119.94 370.65September 63.95 33.97 97.92 182.86 81.46 264.32October 172.41 35.95 208.36 196.94 75.1 272.04November 120.02 40.15 160.17 101.53 49.21 150.74December 141.46 39.83 181.29 77.78 41.09 118.87Total 1061.45 396.38 1457.83 2239.27 648.93 2888.2 139.616 102.817 242.433Total Revenue from Oil Exports In million USD92Source: Ministry <strong>of</strong> Finance and National Economy, GoNUMonth 2007 2008 <strong>2009</strong>January 219.1 519.2 105.92February 144.74 335.93 81.28March 65.6 511.91 112.55April 188.02 563.25 113.81May 303.66 491.26 96.36June 247.41 576.34July 331.92 676.65August 329.69 583.29September 181.96 435.05October 476.85 468.36November 353.18 255.95December 382.89 214.5Total 3225.02 5,631.69 509.924N.B. Data relates to the whole <strong>of</strong> <strong>Sudan</strong> and not merely <strong>Southern</strong> <strong>Sudan</strong> or GOSSSource: Ministry <strong>of</strong> Finance and National Economy, GoNU
<strong>Southern</strong> <strong>Sudan</strong> Centre <strong>for</strong> Census Statistics and Evaluation,P.O. Box 137, Juba.Tel: +249 811 823 835email: ssccse@gmail.com