School of Economic Sciences - Washington State University
School of Economic Sciences - Washington State University
School of Economic Sciences - Washington State University
- No tags were found...

You also want an ePaper? Increase the reach of your titles
YUMPU automatically turns print PDFs into web optimized ePapers that Google loves.
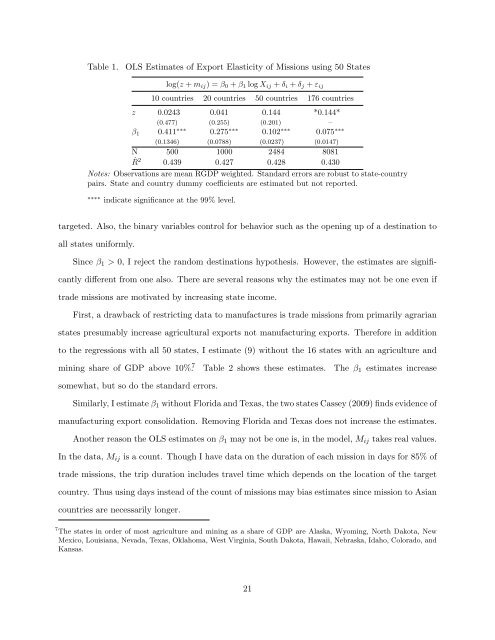
Table 1.OLS Estimates <strong>of</strong> Export Elasticity <strong>of</strong> Missions using 50 <strong>State</strong>slog(z + m ij ) = β 0 + β 1 log X ij + δ i + δ j + ε ij10 countries 20 countries 50 countries 176 countriesz 0.0243 ∗∗ 0.041 ∗∗∗ 0.144 ∗∗∗ *0.144* ∗∗(0.477) (0.255) (0.201) –β 1 0.411 ∗∗∗ 0.275 ∗∗∗ 0.102 ∗∗∗ 0.075 ∗∗∗(0.1346) (0.0788) (0.0237) (0.0147)N 500 1000 2484 8081ˆR 2 0.439 0.427 0.428 0.430Notes: Observations are mean RGDP weighted. Standard errors are robust to state-countrypairs. <strong>State</strong> and country dummy coefficients are estimated but not reported.∗∗∗∗ indicate significance at the 99% level.targeted. Also, the binary variables control for behavior such as the opening up <strong>of</strong> a destination toall states uniformly.Since β 1 > 0, I reject the random destinations hypothesis. However, the estimates are significantlydifferent from one also. There are several reasons why the estimates may not be one even iftrade missions are motivated by increasing state income.First, a drawback <strong>of</strong> restricting data to manufactures is trade missions from primarily agrarianstates presumably increase agricultural exports not manufacturing exports. Therefore in additionto the regressions with all 50 states, I estimate (9) without the 16 states with an agriculture andmining share <strong>of</strong> GDP above 10%. 7 Table 2 shows these estimates. The β 1 estimates increasesomewhat, but so do the standard errors.Similarly, I estimate β 1 without Florida and Texas, the two states Cassey (2009) finds evidence <strong>of</strong>manufacturing export consolidation. Removing Florida and Texas does not increase the estimates.Another reason the OLS estimates on β 1 may not be one is, in the model, M ij takes real values.In the data, M ij is a count. Though I have data on the duration <strong>of</strong> each mission in days for 85% <strong>of</strong>trade missions, the trip duration includes travel time which depends on the location <strong>of</strong> the targetcountry. Thus using days instead <strong>of</strong> the count <strong>of</strong> missions may bias estimates since mission to Asiancountries are necessarily longer.7 The states in order <strong>of</strong> most agriculture and mining as a share <strong>of</strong> GDP are Alaska, Wyoming, North Dakota, NewMexico, Louisiana, Nevada, Texas, Oklahoma, West Virginia, South Dakota, Hawaii, Nebraska, Idaho, Colorado, andKansas.21