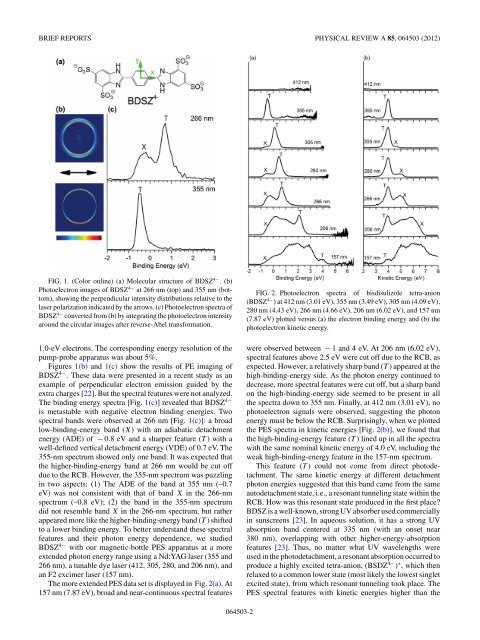
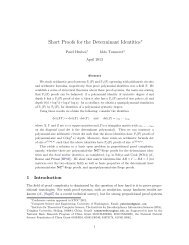
BRIEF REPORTS PHYSICAL REVIEW A 85, 064503 (2012)FIG. 1. (Color online) (a) Molecular structure <strong>of</strong> BDSZ 4− .(b)Photoelectron images <strong>of</strong> BDSZ 4− at 266 nm (top) and 355 nm (bottom),showing <strong>the</strong> perpendicular intensity distributions relative to <strong>the</strong>laser polarization indicated by <strong>the</strong> arrows. (c) Photoelectron spectra <strong>of</strong>BDSZ 4− converted from (b) by integrating <strong>the</strong> photoelectron intensityaround <strong>the</strong> circular images after reverse-Abel transformation.1.0-eV electrons. The corresponding energy resolution <strong>of</strong> <strong>the</strong>pump-probe apparatus was about 5%.Figures 1(b) and 1(c) show <strong>the</strong> results <strong>of</strong> PE imaging <strong>of</strong>BDSZ 4− . These data were presented in a recent study as anexample <strong>of</strong> perpendicular electron emission guided by <strong>the</strong>extra charges [22]. But <strong>the</strong> spectral features were not analyzed.The binding energy spectra [Fig. 1(c)] revealed that BDSZ 4−is metastable with negative electron binding energies. Twospectral bands were observed at 266 nm [Fig. 1(c)]: a broadlow-binding-energy band (X) with an adiabatic detachmentenergy (ADE) <strong>of</strong> − 0.8 eV and a sharper feature (T ) with awell-defined vertical detachment energy (VDE) <strong>of</strong> 0.7 eV. The355-nm spectrum showed only one band: It was expected that<strong>the</strong> higher-binding-energy band at 266 nm would be cut <strong>of</strong>fdue to <strong>the</strong> RCB. However, <strong>the</strong> 355-nm spectrum was puzzlingin two aspects: (1) The ADE <strong>of</strong> <strong>the</strong> band at 355 nm (–0.7eV) was not consistent with that <strong>of</strong> band X in <strong>the</strong> 266-nmspectrum (–0.8 eV); (2) <strong>the</strong> band in <strong>the</strong> 355-nm spectrumdid not resemble band X in <strong>the</strong> 266-nm spectrum, but ra<strong>the</strong>rappeared more like <strong>the</strong> higher-binding-energy band (T ) shiftedto a lower binding energy. To better understand <strong>the</strong>se spectralfeatures and <strong>the</strong>ir photon energy dependence, we studiedBDSZ 4− with our magnetic-bottle PES apparatus at a moreextended photon energy range using a Nd:YAG laser (355 and266 nm), a tunable dye laser (412, 305, 280, and 206 nm), andan F2 excimer laser (157 nm).The more extended PES data set is displayed in Fig. 2(a).At157 nm (7.87 eV), broad and near-continuous spectral featuresFIG. 2. Photoelectron spectra <strong>of</strong> bisdisulizole tetra-anion(BDSZ 4− ) at 412 nm (3.01 eV), 355 nm (3.49 eV), 305 nm (4.09 eV),280 nm (4.43 eV), 266 nm (4.66 eV), 206 nm (6.02 eV), and 157 nm(7.87 eV) plotted versus (a) <strong>the</strong> electron binding energy and (b) <strong>the</strong>photoelectron kinetic energy.were observed between − 1 and 4 eV. At 206 nm (6.02 eV),spectral features above 2.5 eV were cut <strong>of</strong>f due to <strong>the</strong> RCB, asexpected. However, a relatively sharp band (T ) appeared at <strong>the</strong>high-binding-energy side. As <strong>the</strong> photon energy continued todecrease, more spectral features were cut <strong>of</strong>f, but a sharp bandon <strong>the</strong> high-binding-energy side seemed to be present in all<strong>the</strong> spectra down to 355 nm. Finally, at 412 nm (3.01 eV), nophotoelectron signals were observed, suggesting <strong>the</strong> photonenergy must be below <strong>the</strong> RCB. Surprisingly, when we plotted<strong>the</strong> PES spectra in kinetic energies [Fig. 2(b)], we found that<strong>the</strong> high-binding-energy feature (T ) lined up in all <strong>the</strong> spectrawith <strong>the</strong> same nominal kinetic energy <strong>of</strong> 4.0 eV, including <strong>the</strong>weak high-binding-energy feature in <strong>the</strong> 157-nm spectrum.This feature (T ) could not come from direct photodetachment.The same kinetic energy at different detachmentphoton energies suggested that this band came from <strong>the</strong> sameautodetachment state, i.e., a resonant <strong>tunneling</strong> state within <strong>the</strong>RCB. How was this resonant state produced in <strong>the</strong> first place?BDSZ is a well-known, strong UV absorber used commerciallyin sunscreens [23]. In aqueous solution, it has a strong UVabsorption band centered at 335 nm (with an onset near380 nm), overlapping with o<strong>the</strong>r higher-energy-absorptionfeatures [23]. Thus, no matter what UV wavelengths wereused in <strong>the</strong> photodetachment, a resonant absorption occurred toproduce a highly excited tetra-anion, (BSDZ 4− ) ∗ , which <strong>the</strong>nrelaxed to a common lower state (most likely <strong>the</strong> lowest singletexcited state), from which resonant <strong>tunneling</strong> took place. ThePES spectral features with kinetic energies higher than <strong>the</strong>064503-2
BRIEF REPORTS PHYSICAL REVIEW A 85, 064503 (2012)FIG. 3. (Color online) (a) The model <strong>repulsive</strong> <strong>Coulomb</strong> potentialused for calculating <strong>the</strong> energy level and lifetime <strong>of</strong> <strong>the</strong> resonantstate with WKB <strong>the</strong>ory. The distance is in atomic units (1 a.u. =0.529 Å). The marked energy levels were determined from <strong>the</strong>observed photoelectron spectra. The vertical blue arrow stands for<strong>the</strong> excitation from a valence state to an excited state <strong>of</strong> BDSZ 4− ,and<strong>the</strong> resonant <strong>tunneling</strong> state is represented by <strong>the</strong> red horizontal line.The dotted arrow indicates <strong>the</strong> electron <strong>tunneling</strong>. (b) Transmissionyield calculated using WKB <strong>the</strong>ory for <strong>the</strong> model <strong>barrier</strong> potentialand resonant <strong>tunneling</strong> state indicated vs <strong>the</strong> emitted electron energy.The peak at 4.0 eV reflects <strong>the</strong> resonant state within <strong>the</strong> RCB.<strong>tunneling</strong> signals come from direct photodetachment, whichcannot compete with resonant <strong>tunneling</strong> as <strong>the</strong> photon energyis decreased.From <strong>the</strong> true spectral cut<strong>of</strong>f, we estimated a RCB height<strong>of</strong> 4.3 eV based on <strong>the</strong> 157-nm spectrum, where <strong>the</strong> resonant<strong>tunneling</strong> signal was relatively weak. The ADE for BDSZ 4−can only be evaluated from <strong>the</strong> spectra at photon energies above355 nm, because <strong>the</strong> 355-nm spectrum was entirely due to <strong>the</strong>resonant <strong>tunneling</strong> state. The ADE <strong>of</strong> BDSZ 4− was estimatedas − 0.8 eV from <strong>the</strong> 266-nm spectrum. Based on <strong>the</strong> ADE <strong>of</strong>BDSZ 4− and <strong>the</strong> 4.0-eV nominal kinetic energy <strong>of</strong> <strong>the</strong> resonant<strong>tunneling</strong> band, we estimated that <strong>the</strong> <strong>tunneling</strong> state is about∼3.2 eV above <strong>the</strong> ground state <strong>of</strong> <strong>the</strong> tetra-anion and ∼0.3 eVbelow <strong>the</strong> RCB top, as shown schematically in Fig. 3(a).The412-nm (3.01-eV) detachment energy was below <strong>the</strong> RCB andwas also below <strong>the</strong> resonant state. Thus, no electron signalswere observed at this detachment wavelength (Fig. 2).It should be noted that <strong>the</strong> angular distribution <strong>of</strong> <strong>the</strong>electrons corresponding to <strong>the</strong> resonant <strong>tunneling</strong> band ishighly perpendicular. As shown in Fig. 1(b), <strong>the</strong> photoelectronintensity at <strong>the</strong> direction perpendicular to <strong>the</strong> laser polarizationis much stronger than in <strong>the</strong> direction parallel to <strong>the</strong> laserpolarization. The perpendicular angular distribution is due to<strong>the</strong> anisotropy <strong>of</strong> <strong>the</strong> RCB caused by <strong>the</strong> terminal negativecharges, because <strong>the</strong> electrons are emitted from molecularorbitals in <strong>the</strong> middle <strong>of</strong> <strong>the</strong> BDSZ 4− anion [Fig. 1(a)],as reported recently [22]. The observed highly anisotropicelectron distribution also means that <strong>the</strong> resonant <strong>tunneling</strong>is a very fast process, relative to <strong>the</strong> rotational period <strong>of</strong>BDSZ 4− . The rotational constant B <strong>of</strong> BDSZ 4− for <strong>the</strong>rotation around its C 2 symmetry axis was calculated to be0.017 GHz [24]. At room temperature (T = 300 K), <strong>the</strong>population at various rotational levels is governed by <strong>the</strong>Boltzmann distribution, ∝ (2J + 1) exp[−hBJ (J + 1)/kT],where k is <strong>the</strong> Boltzmann constant and h is <strong>the</strong> Planckconstant. Thus, <strong>the</strong> most probable rotational quantum numberJ max ≈ (kT/2hB) 1/2 or ∼430, which has a rotational period <strong>of</strong>t r ≈ 1/(2BJ max ) ≈ 6.8 × 10 −11 s (68 ps). Hence, <strong>the</strong> lifetime<strong>of</strong> <strong>the</strong> resonant <strong>tunneling</strong> state should be much shorterthan 68 ps.To quantitatively understand <strong>the</strong> resonant <strong>tunneling</strong> state in<strong>the</strong> RCB, we calculated <strong>the</strong> potential <strong>barrier</strong> for <strong>the</strong> emission<strong>of</strong> an electron from <strong>the</strong> highest occupied molecular orbital<strong>of</strong> BDSZ 4− , using <strong>the</strong> DFT-B3LYP/6-311 ++G ∗∗ method[22,24] with <strong>the</strong> frozen static orbital approximation [25]. Thelowest RCB is along <strong>the</strong> y axis, which is perpendicular to <strong>the</strong>long molecular axis [Fig. 1(a)], as expected. The calculatedlowest RCB is 4.4 eV, in excellent agreement with <strong>the</strong> valueestimated from <strong>the</strong> cut<strong>of</strong>f <strong>of</strong> <strong>the</strong> PES spectra (∼4.3 eV). Tosimplify <strong>the</strong> calculation <strong>of</strong> electron <strong>tunneling</strong> with <strong>the</strong> WKB<strong>the</strong>ory [26], a one-dimensional double <strong>barrier</strong> along <strong>the</strong> yaxis was modeled to approximate <strong>the</strong> anisotropic RCB. Anaveraged potential inside <strong>the</strong> model <strong>barrier</strong> was taken as anadjustable parameter for producing <strong>the</strong> best agreement with<strong>the</strong> observed energy level <strong>of</strong> <strong>the</strong> resonant state. Indeed, wereproduced a resonant <strong>tunneling</strong> state with an energy level <strong>of</strong>4.0 eV. Figure 3(b) shows <strong>the</strong> transmission curve versus <strong>the</strong>electron energy. Since <strong>the</strong> measured energy distribution <strong>of</strong> <strong>the</strong><strong>tunneling</strong> state (T in Fig. 2) is a complicated convolution<strong>of</strong> Frank-Condon overlaps and vibrational excitations, aswell as instrumental energy resolution, it cannot be usedfor estimating <strong>the</strong> lifetime. However, <strong>the</strong> simulated energywidth <strong>of</strong> <strong>the</strong> resonant state (E = 0.07 eV) in Fig. 3(b)can be used to obtain a first-order estimate <strong>of</strong> <strong>the</strong> lifetimeτ (τ ∼ ¯h/E) <strong>of</strong> <strong>the</strong> resonant state to be ∼10 −14 s(∼10 fs).The overall pr<strong>of</strong>ile is not in good agreement with <strong>the</strong> measuredenergy distribution, which might be due to <strong>the</strong> oversimplified<strong>barrier</strong> model (in addition to <strong>the</strong> factors already mentionedabove).The temporal dynamics <strong>of</strong> <strong>the</strong> resonant state in BDSZ 4− wasdirectly investigated using femtosecond PES [20]. The pumpand probe laser pulses were provided using a fully integrated1 kHz Ti:sapphire femtosecond laser system (Clark-MXR,CPA-2001), which can yield 775-nm (1.6-eV) pulses withan overall pulse energy <strong>of</strong> 1 mJ. After second harmonicgeneration, pump (388-nm, 3.2-eV) and probe (775-nm) laserpulses were separated and delayed relative to each o<strong>the</strong>r usinga computer-controlled optical delay line (Nanomover, MellesGriot). For time-resolved PES, typical pump pulse energieswere 20 μJ in order to minimize two-photon detachment.Probe pulse energies were typically 120–140 μJ. The pumpprobetime resolution in <strong>the</strong> detachment region <strong>of</strong> <strong>the</strong> PEspectrometer was determined as 440 ± 30 fs by crosscorrelationmeasurements <strong>of</strong> pump and probe laser beams[see <strong>the</strong> dashed curve in Fig. 4(b)].Figure 4(a) shows <strong>the</strong> pump-probe results for BDSZ 4− .The strong peak in <strong>the</strong> photoelectron intensity at an electronkinetic energy <strong>of</strong> 4.0 eV corresponds to <strong>the</strong> resonant <strong>tunneling</strong>signal resulting from <strong>the</strong> BDSZ 4− molecules, which haveabsorbed one photon from <strong>the</strong> 388-nm pump radiation.The weaker signal in <strong>the</strong> kinetic energy range from 4.6 to5.7 eV corresponds to <strong>the</strong> two-color pump-probe transient064503-3