SIIT Commemorative Publication (10 Years of International ...
SIIT Commemorative Publication (10 Years of International ...
SIIT Commemorative Publication (10 Years of International ...
- No tags were found...

You also want an ePaper? Increase the reach of your titles
YUMPU automatically turns print PDFs into web optimized ePapers that Google loves.
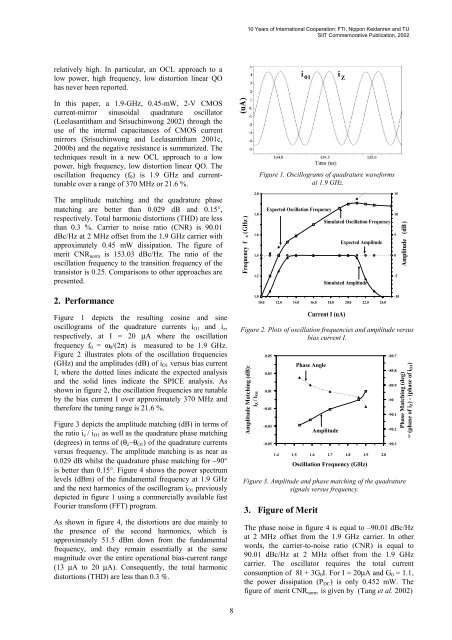
<strong>10</strong> <strong>Years</strong> <strong>of</strong> <strong>International</strong> Cooperation: FTI, Nippon Keidanren and TU<strong>SIIT</strong> <strong>Commemorative</strong> <strong>Publication</strong>, 2002relatively high. In particular, an OCL approach to alow power, high frequency, low distortion linear QOhas never been reported.In this paper, a 1.9-GHz, 0.45-mW, 2-V CMOScurrent-mirror sinusoidal quadrature oscillator(Leelasantitham and Srisuchinwong 2002) through theuse <strong>of</strong> the internal capacitances <strong>of</strong> CMOS currentmirrors (Srisuchinwong and Leelasantitham 2001c,2000b) and the negative resistance is summarized. Thetechniques result in a new OCL approach to a lowpower, high frequency, low distortion linear QO. Theoscillation frequency (f 0 ) is 1.9 GHz and currenttunableover a range <strong>of</strong> 370 MHz or 21.6 %.Figure 1. Oscillograms <strong>of</strong> quadrature waveformsat 1.9 GHz.The amplitude matching and the quadrature phasematching are better than 0.029 dB and 0.15°,respectively. Total harmonic distortions (THD) are lessthan 0.3 %. Carrier to noise ratio (CNR) is 90.01dBc/Hz at 2 MHz <strong>of</strong>fset from the 1.9 GHz carrier withapproximately 0.45 mW dissipation. The figure <strong>of</strong>merit CNR norm is 153.03 dBc/Hz. The ratio <strong>of</strong> theoscillation frequency to the transition frequency <strong>of</strong> thetransistor is 0.25. Comparisons to other approaches arepresented.Frequency f o (GHz )2.01.81.61.41.2Expected Oscillation FrequencySimulated Oscillation FrequencyExpected AmplitudeSimulated Amplitude15<strong>10</strong>50-5Amplitude (dB )2. Performance1.0<strong>10</strong>.0 12.0 14.0 16.0 18.0 20.0 22.0 24.0-<strong>10</strong>Figure 1 depicts the resulting cosine and sineoscillograms <strong>of</strong> the quadrature currents i O1 and i z ,respectively, at I = 20 µA where the oscillationfrequency f 0 = ω 0 /(2π) is measured to be 1.9 GHz.Figure 2 illustrates plots <strong>of</strong> the oscillation frequencies(GHz) and the amplitudes (dB) <strong>of</strong> i O1 versus bias currentI, where the dotted lines indicate the expected analysisand the solid lines indicate the SPICE analysis. Asshown in figure 2, the oscillation frequencies are tunableby the bias current I over approximately 370 MHz andtherefore the tuning range is 21.6 %.Figure 3 depicts the amplitude matching (dB) in terms <strong>of</strong>the ratio i z / i O1 as well as the quadrature phase matching(degrees) in terms <strong>of</strong> (θ z −θ O1 ) <strong>of</strong> the quadrature currentsversus frequency. The amplitude matching is as near as0.029 dB whilst the quadrature phase matching for −90°is better than 0.15°. Figure 4 shows the power spectrumlevels (dBm) <strong>of</strong> the fundamental frequency at 1.9 GHzand the next harmonics <strong>of</strong> the oscillogram i O1 previouslydepicted in figure 1 using a commercially available fastFourier transform (FFT) program.As shown in figure 4, the distortions are due mainly tothe presence <strong>of</strong> the second harmonics, which isapproximately 51.5 dBm down from the fundamentalfrequency, and they remain essentially at the samemagnitude over the entire operational bias-current range(13 µA to 20 µA). Consequently, the total harmonicdistortions (THD) are less than 0.3 %.Figure 2. Plots <strong>of</strong> oscillation frequencies and amplitude versusbias current I.Amplitude Matching (dB):iZ / iO<strong>10</strong>.050.030.01-0.01-0.03-0.05Current I (uA)Phase AngleAmplitude1.4 1.5 1.6 1.7 1.8 1.9 2.0Oscillation Frequency (GHz)-89.7-89.8-89.9-90-90.1-90.2-90.3Phase Matching (deg)= (phase <strong>of</strong> iZ) - (phase <strong>of</strong> iO1)Figure 3. Amplitude and phase matching <strong>of</strong> the quadraturesignals versus frequency.3. Figure <strong>of</strong> MeritThe phase noise in figure 4 is equal to –90.01 dBc/Hzat 2 MHz <strong>of</strong>fset from the 1.9 GHz carrier. In otherwords, the carrier-to-noise ratio (CNR) is equal to90.01 dBc/Hz at 2 MHz <strong>of</strong>fset from the 1.9 GHzcarrier. The oscillator requires the total currentconsumption <strong>of</strong> 8I + 3G 0 I. For I = 20µA and G 0 = 1.1,the power dissipation (P DC ) is only 0.452 mW. Thefigure <strong>of</strong> merit CNR norm is given by (Tang et al. 2002)8