<strong>10</strong> <strong>Years</strong> <strong>of</strong> <strong>International</strong> Cooperation: FTI, Nippon Keidanren and TU<strong>SIIT</strong> <strong>Commemorative</strong> <strong>Publication</strong>, 2002capacity and power generation are less than those inthe TEP case by approximately 1.5% in additionalcapacity and 61,681 GWh in generation due to energysavings from the DSM programs. The loss-<strong>of</strong>-loadprobabilities (LOLPs) in all cases are not changed.Table 3. Electricity generation in selected yearsCaseTEPCSSIRPTIPPTIGCTPFBGeneration-mix (TWh)PlantTypes 2003 2007 2012 2017HydroCoal-firedOil-firedCCGTIPPSubtotalHydroCoal-firedOil-firedCCGTIPPBiomassSubtotalHydroCoal-firedOil-firedCCGTIPPSubtotalHydroCoal-firedOil-firedCCGTIPPIPP_CoalSubtotalHydroCoal-firedOil-firedCCGTIPPIGCCSubtotalHydroCoal-firedOil-firedCCGTIPPPFBCSubtotal4.219.830.463.23.211.41324.219.830.463.23.211.401324.219.829.563.13.111.41314.219.830.463.23.211.401324.219.830.463.23.211.401324.219.830.463.23.211.401324.262.828.460.33.511.41714.262.928.460.33.511.401714.262.926.859.53.111.41684.248.528.360.33.411.414.51714.248.528.160.33.411.414.71714.248.528.160.33.411.414.71714.2147.816.347.42.711.42304.2150.016.343.12.711.42.12304.2132.816.657.02.811.42254.2137.816.143.12.811.414.62304.2125.616.954.42.811.414.72304.2133.516.247.22.711.414.72304.2202.011.754.<strong>10</strong>.511.42844.2187.011.767.60.511.42.12844.2177.0<strong>10</strong>.473.00.511.42764.2177.611.464.90.511.414.52844.2182.0<strong>10</strong>.759.91.011.414.72844.2182.011.758.81.011.414.7284Total2003-2017(TWh)621,648318859381713,096621,64531285238171163,096621,527308930371713,034621,497306833371711893,096621,432312890371711913,096621,466311857381711913,096In the IRP case, the cumulative generation avoidedthrough the DSM programs during 2003-2017 is61,681 GWh, <strong>of</strong> which 13,261 GWh from DSM1,15,629 GWh from DSM2 and 32,792 GWh fromDSM3. The DSM3, the efficient air conditionerprogram, has the highest contribution to the avoidedgeneration. In 2017, the peak load avoided in the IRPcase is 364.7 MW, <strong>of</strong> which 36.4 MW from DSM1,94.6 MW from DSM2 and 233.7 MW from DSM3. Inaddition to the reduction in electricity generation, theIRP case also shows a reduction in fuel consumption.The total fuel consumption in the IRP case is 640million tons <strong>of</strong> oil equivalent (toe), while that in theTEP case is 658 million tones.4.2 Environmental ImplicationsResults from the IRP model show that only the CSSand IRP cases have lower emissions. In all cases, theshare <strong>of</strong> coal-based plants is about 50% resulting inhigh CO 2 and SO 2 emissions. In the CSS case, thecoal-based plant is substituted with the biomass-basedplant resulting in lower CO 2 emission. In the CSS case,the total CO 2 , SO 2 and NO x emissions are found to beless than in the TEP case by 13 million tons, 77 ktonsand 31 ktons, respectively, while in the IRP case CO 2 ,SO 2 and NO x emissions are found to be less than in theTEP case by 89 million tons, <strong>10</strong>17 ktons and 195ktons, respectively. The cumulative CO 2 , SO 2 and NO xemissions during the planning horizon are shown inTable 4. In the CSS case, one unit <strong>of</strong> 700-MW coalfiredpower plant and one unit <strong>of</strong> 200-MW gas turbineplant are replaced by three units <strong>of</strong> 600-MWcombined-cycle and three units <strong>of</strong> <strong>10</strong>0-MW biomassbasedplants resulting in total CO 2 reduction.Though the power generation from coal-based plantsincreases in the TIGC and TPFB cases, CO 2emissions are reduced by 70 and 53 million tons,respectively, and SO 2 emissions are reduced by 1,703and 1435 ktons, respectively, compared to the TEPcase. The electricity generation from the IGCC andPFBC plants in the TIGC and TPFB cases results inless CO 2 , SO 2 and NO x emissions compared to the TEPcase.In the TIPP case, the power generation from the coalbasedplants increases due to committed coal-basedIPP plants resulting in higher CO 2 emission by 35%million tons or approximately 1.6% compared to theTEP case.Table 4. Cumulative emissions during 2003-2017.Case study CO 2, <strong>10</strong> 6 tons SO 2, <strong>10</strong> 3 tons NO x, <strong>10</strong> 3 tonsTEPCSSIRPTIPPTIGCTPFB2,2312,2182,1422,2662,1612,17914,85014,77313,83314,65313,14713,4156,9376,7436,9068,1686,5026,59014
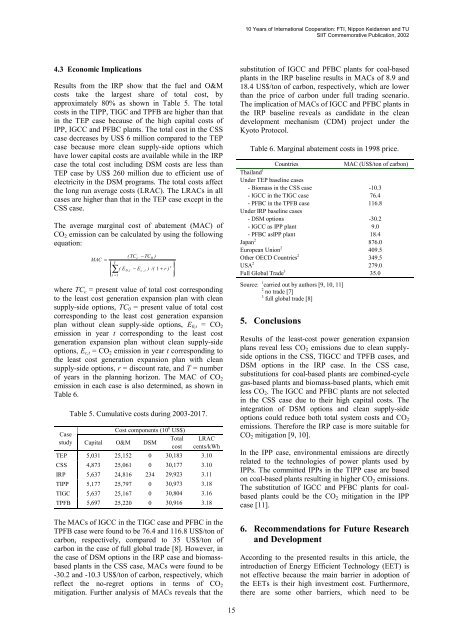
<strong>10</strong> <strong>Years</strong> <strong>of</strong> <strong>International</strong> Cooperation: FTI, Nippon Keidanren and TU<strong>SIIT</strong> <strong>Commemorative</strong> <strong>Publication</strong>, 20024.3 Economic ImplicationsResults from the IRP show that the fuel and O&Mcosts take the largest share <strong>of</strong> total cost, byapproximately 80% as shown in Table 5. The totalcosts in the TIPP, TIGC and TPFB are higher than thatin the TEP case because <strong>of</strong> the high capital costs <strong>of</strong>IPP, IGCC and PFBC plants. The total cost in the CSScase decreases by US$ 6 million compared to the TEPcase because more clean supply-side options whichhave lower capital costs are available while in the IRPcase the total cost including DSM costs are less thanTEP case by US$ 260 million due to efficient use <strong>of</strong>electricity in the DSM programs. The total costs affectthe long run average costs (LRAC). The LRACs in allcases are higher than that in the TEP case except in theCSS case.The average marginal cost <strong>of</strong> abatement (MAC) <strong>of</strong>CO 2 emission can be calculated by using the followingequation:MAC =⎪⎧⎨⎪⎩ tT∑= 1( E( TC −TC)0 ,t− E) /( 1 + r )where TC c = present value <strong>of</strong> total cost correspondingto the least cost generation expansion plan with cleansupply-side options, TC 0 = present value <strong>of</strong> total costcorresponding to the least cost generation expansionplan without clean supply-side options, E 0,t = CO 2emission in year t corresponding to the least costgeneration expansion plan without clean supply-sideoptions, E c,t = CO 2 emission in year t corresponding tothe least cost generation expansion plan with cleansupply-side options, r = discount rate, and T = number<strong>of</strong> years in the planning horizon. The MAC <strong>of</strong> CO 2emission in each case is also determined, as shown inTable 6.Table 5. Cumulative costs during 2003-2017.Cost components (<strong>10</strong> 6 US$)CaseTotalstudy Capital O&M DSMcostLRACcents/kWhTEP 5,031 25,152 0 30,183 3.<strong>10</strong>CSS 4,873 25,061 0 30,177 3.<strong>10</strong>IRP 5,637 24,816 234 29,923 3.11TIPP 5,177 25,797 0 30,973 3.18TIGC 5,637 25,167 0 30,804 3.16TPFB 5,697 25,220 0 30,916 3.18cThe MACs <strong>of</strong> IGCC in the TIGC case and PFBC in theTPFB case were found to be 76.4 and 116.8 US$/ton <strong>of</strong>carbon, respectively, compared to 35 US$/ton <strong>of</strong>carbon in the case <strong>of</strong> full global trade [8]. However, inthe case <strong>of</strong> DSM options in the IRP case and biomassbasedplants in the CSS case, MACs were found to be-30.2 and -<strong>10</strong>.3 US$/ton <strong>of</strong> carbon, respectively, whichreflect the no-regret options in terms <strong>of</strong> CO 2mitigation. Further analysis <strong>of</strong> MACs reveals that thec ,t0t⎪⎫⎬⎪⎭substitution <strong>of</strong> IGCC and PFBC plants for coal-basedplants in the IRP baseline results in MACs <strong>of</strong> 8.9 and18.4 US$/ton <strong>of</strong> carbon, respectively, which are lowerthan the price <strong>of</strong> carbon under full trading scenario.The implication <strong>of</strong> MACs <strong>of</strong> IGCC and PFBC plants inthe IRP baseline reveals as candidate in the cleandevelopment mechanism (CDM) project under theKyoto Protocol.Table 6. Marginal abatement costs in 1998 price.Countries MAC (US$/ton <strong>of</strong> carbon)Thailand 1Under TEP baseline cases- Biomass in the CSS case- IGCC in the TIGC case- PFBC in the TPFB caseUnder IRP baseline cases- DSM options- IGCC as IPP plant- PFBC asIPP plant-<strong>10</strong>.376.4116.8-30.29.018.4Japan 2 876.0European Union 2 409.5Other OECD Countries 2 349.5USA 2 279.0Full Global Trade 3 35.0Source: 1 carried out by authors [9, <strong>10</strong>, 11]2 no trade [7]3 full global trade [8]5. ConclusionsResults <strong>of</strong> the least-cost power generation expansionplans reveal less CO 2 emissions due to clean supplysideoptions in the CSS, TIGCC and TPFB cases, andDSM options in the IRP case. In the CSS case,substitutions for coal-based plants are combined-cyclegas-based plants and biomass-based plants, which emitless CO 2 . The IGCC and PFBC plants are not selectedin the CSS case due to their high capital costs. Theintegration <strong>of</strong> DSM options and clean supply-sideoptions could reduce both total system costs and CO 2emissions. Therefore the IRP case is more suitable forCO 2 mitigation [9, <strong>10</strong>].In the IPP case, environmental emissions are directlyrelated to the technologies <strong>of</strong> power plants used byIPPs. The committed IPPs in the TIPP case are basedon coal-based plants resulting in higher CO 2 emissions.The substitution <strong>of</strong> IGCC and PFBC plants for coalbasedplants could be the CO 2 mitigation in the IPPcase [11].6. Recommendations for Future Researchand DevelopmentAccording to the presented results in this article, theintroduction <strong>of</strong> Energy Efficient Technology (EET) isnot effective because the main barrier in adoption <strong>of</strong>the EETs is their high investment cost. Furthermore,there are some other barriers, which need to be15
- Page 2 and 3: !" Years of International Cooperati
- Page 5 and 6: 1993: Her Royal HighnessPrincess Ma
- Page 7 and 8: !"#$%&'(#)*#+,-%',&-.),&/#0))1%'&-.
- Page 9 and 10: !"#$%&'(#)*#+,-%',&-.),&/#0))1%'&-.
- Page 11 and 12: !"#$%&'(#)*#+,-%',&-.),&/#0))1%'&-.
- Page 13 and 14: !"#$%&'(#)*#+,-%',&-.),&/#0))1%'&-.
- Page 15 and 16: !!!"#$%&'(#)*#+,-%',&-.),&/#0))1%'&
- Page 17 and 18: !!!"#$%&'(#)*#+,-%',&-.),&/#0))1%'&
- Page 19 and 20: !!"#$%&'(#)*#+,-%',&-.),&/#0))1%'&-
- Page 21 and 22: !!"#$%&'(#)*#+,-%',&-.),&/#0))1%'&-
- Page 23 and 24: "#!$%&'(!)*!+,-%',&-.),&/!0))1%'&-.
- Page 25 and 26: !!"#$%&'(#)*#+,-%',&-.),&/#0))1%'&-
- Page 27 and 28: !"#$%&'(#)*#+,-%',&-.),&/#0))1%'&-.
- Page 29 and 30: !"#$%&'(#)*#+,-%',&-.),&/#0))1%'&-.
- Page 31 and 32: !"#$%&'(#)*#+,-%',&-.),&/#0))1%'&-.
- Page 33 and 34: !"#$%&'(#)*#+,-%',&-.),&/#0))1%'&-.
- Page 35 and 36: !"#$%&'(#)*#+,-%',&-.),&/#0))1%'&-.
- Page 37 and 38: 10 Years of International Cooperati
- Page 39 and 40: 10 Years of International Cooperati
- Page 41 and 42: 10 Years of International Cooperati
- Page 43 and 44: 10 Years of International Cooperati
- Page 45 and 46: 10 Years of International Cooperati
- Page 47 and 48: 10 Years of International Cooperati
- Page 49: 10 Years of International Cooperati
- Page 53 and 54: 10 Years of International Cooperati
- Page 55 and 56: 10 Years of International Cooperati
- Page 57 and 58: 10 Years of International Cooperati
- Page 59 and 60: 10 Years of International Cooperati
- Page 61 and 62: 10 Years of International Cooperati
- Page 63 and 64: 10 Years of International Cooperati
- Page 65 and 66: !!"#$%&'(#)*#+,-%',&-.),&/#0))1%'&-
- Page 67 and 68: !!"#$%&'(#)*#+,-%',&-.),&/#0))1%'&-
- Page 69 and 70: #!"#$%&'(#)*#+,-%',&-.),&/#0))1%'&-
- Page 71 and 72: #!"#$%&'(#)*#+,-%',&-.),&/#0))1%'&-
- Page 73 and 74: #!"#$%&'(#)*#+,-%',&-.),&/#0))1%'&-
- Page 75 and 76: 10 Years of International Cooperati
- Page 77 and 78: 10 Years of International Cooperati
- Page 79 and 80: 10 Years of International Cooperati
- Page 81 and 82: 10 Years of International Cooperati
- Page 83 and 84: 10 Years of International Cooperati
- Page 85 and 86: 10 Years of International Cooperati
- Page 87 and 88: !!"#$%&'(#)*#+,-%',&-.),&/#0))1%'&-
- Page 89 and 90: !!!"#$%&'(#)*#+,-%',&-.),&/#0))1%'&
- Page 91 and 92: !"#!$%&'(!)*!+,-%',&-.),&/!0))1%'&-
- Page 93 and 94: !"#!$%&'(!)*!+,-%',&-.),&/!0))1%'&-
- Page 95 and 96: !"#!$%&'(!)*!+,-%',&-.),&/!0))1%'&-
- Page 97 and 98: !"#$%&'(#)*#+,-%',&-.),&/#0))1%'&-.
- Page 99 and 100: !"#$%&'(#)*#+,-%',&-.),&/#0))1%'&-.
- Page 101 and 102:
!!"#$%&'(#)*#+,-%',&-.),&/#0))1%'&-
- Page 103 and 104:
!!"#$%&'(#)*#+,-%',&-.),&/#0))1%'&-
- Page 105 and 106:
!!"#$%&'(#)*#+,-%',&-.),&/#0))1%'&-
- Page 107 and 108:
10 Years of International Cooperati
- Page 109 and 110:
!!"#$%&'(#)*#+,-%',&-.),&/#0))1%'&-
- Page 111 and 112:
!!"#$%&'(#)*#+,-%',&-.),&/#0))1%'&-
- Page 114 and 115:
10 Years of International Cooperati
- Page 116 and 117:
!"#$%&'(#)*#+,-%',&-.),&/#0))1%'&-.
- Page 118 and 119:
!"#$%&'(#)*#+,-%',&-.),&/#0))1%'&-.
- Page 120 and 121:
!"#$%&'(#)*#+,-%',&-.),&/#0))1%'&-.
- Page 122 and 123:
!"#$%&'(#)*#+,-%',&-.),&/#0))1%'&-.
- Page 124 and 125:
!"#$%&'(#)*#+,-%',&-.),&/#0))1%'&-.
- Page 126 and 127:
!"#$%&'(#)*#+,-%',&-.),&/#0))1%'&-.
- Page 128 and 129:
!"#$%&'(#)*#+,-%',&-.),&/#0))1%'&-.
- Page 130 and 131:
!"#$%&'(#)*#+,-%',&-.),&/#0))1%'&-.
- Page 132 and 133:
!"#$%&'(#)*#+,-%',&-.),&/#0))1%'&-.
- Page 134 and 135:
!"#$%&'(#)*#+,-%',&-.),&/#0))1%'&-.
- Page 136 and 137:
!!"#$%&'(#)*#+,-%',&-.),&/#0))1%'&-
- Page 138 and 139:
!!"#$%&'(#)*#+,-%',&-.),&/#0))1%'&-
- Page 140 and 141:
!!"#$%&'(#)*#+,-%',&-.),&/#0))1%'&-
- Page 142 and 143:
!!"#$%&'(#)*#+,-%',&-.),&/#0))1%'&-
- Page 144 and 145:
!!"#$%&'(#)*#+,-%',&-.),&/#0))1%'&-
- Page 146 and 147:
!!"#$%&'(#)*#+,-%',&-.),&/#0))1%'&-
- Page 148 and 149:
!!"#$%&'(#)*#+,-%',&-.),&/#0))1%'&-
- Page 150 and 151:
!!"#$%&'(#)*#+,-%',&-.),&/#0))1%'&-
- Page 152 and 153:
!"#!$%&'(!)*!+,-%',&-.),&/!0))1%'&-
- Page 154 and 155:
"#!$%&'(!)*!+,-%',&-.),&/!0))1%'&-.
- Page 156 and 157:
!!"#$%&'(#)*#+,-%',&-.),&/#0))1%'&-
- Page 158 and 159:
!"#$%&'(#)*#+,-%',&-.),&/#0))1%'&-.
- Page 160 and 161:
#!"#$%&'(#)*#+,-%',&-.),&/#0))1%'&-
- Page 162 and 163:
Access to SIIT at Bangkadi!!!",':!D