Preliminary Final Report - Financial Review
Preliminary Final Report - Financial Review
Preliminary Final Report - Financial Review
- No tags were found...

Create successful ePaper yourself
Turn your PDF publications into a flip-book with our unique Google optimized e-Paper software.
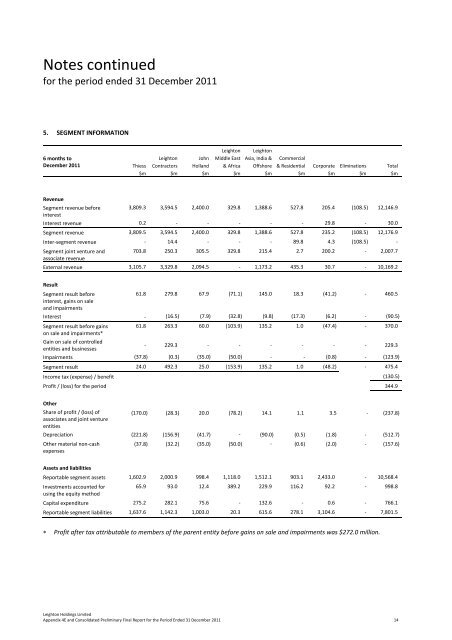
Notes continuedfor the period ended 31 December 20115. SEGMENT INFORMATION6 months toDecember 2011Thiess$mLeightonContractors$mJohnHolland$mLeightonMiddle East& Africa$mLeightonAsia, India &Offshore$mCommercial& Residential$mCorporate$mEliminations$mTotal$mRevenueSegment revenue beforeinterest3,809.3 3,594.5 2,400.0 329.8 1,388.6 527.8 205.4 (108.5) 12,146.9Interest revenue 0.2 ‐ ‐ ‐ ‐ ‐ 29.8 ‐ 30.0Segment revenue 3,809.5 3,594.5 2,400.0 329.8 1,388.6 527.8 235.2 (108.5) 12,176.9Inter‐segment revenue ‐ 14.4 ‐ ‐ ‐ 89.8 4.3 (108.5) ‐Segment joint venture andassociate revenue703.8 250.3 305.5 329.8 215.4 2.7 200.2 ‐ 2,007.7External revenue 3,105.7 3,329.8 2,094.5 ‐ 1,173.2 435.3 30.7 ‐ 10,169.2ResultSegment result beforeinterest, gains on saleand impairments61.8 279.8 67.9 (71.1) 145.0 18.3 (41.2) ‐ 460.5Interest ‐ (16.5) (7.9) (32.8) (9.8) (17.3) (6.2) ‐ (90.5)Segment result before gainson sale and impairments*Gain on sale of controlledentities and businesses61.8 263.3 60.0 (103.9) 135.2 1.0 (47.4) ‐ 370.0‐ 229.3 ‐ ‐ ‐ ‐ ‐ ‐ 229.3Impairments (37.8) (0.3) (35.0) (50.0) ‐ ‐ (0.8) ‐ (123.9)Segment result 24.0 492.3 25.0 (153.9) 135.2 1.0 (48.2) ‐ 475.4Income tax (expense) / benefit (130.5)Profit / (loss) for the period 344.9OtherShare of profit / (loss) ofassociates and joint ventureentities(170.0) (28.3) 20.0 (78.2) 14.1 1.1 3.5 ‐ (237.8)Depreciation (221.8) (156.9) (41.7) ‐ (90.0) (0.5) (1.8) ‐ (512.7)Other material non‐cashexpenses(37.8) (32.2) (35.0) (50.0) ‐ (0.6) (2.0) ‐ (157.6)Assets and liabilities<strong>Report</strong>able segment assets 1,602.9 2,000.9 998.4 1,118.0 1,512.1 903.1 2,433.0 ‐ 10,568.4Investments accounted forusing the equity method65.9 93.0 12.4 389.2 229.9 116.2 92.2 ‐ 998.8Capital expenditure 275.2 282.1 75.6 ‐ 132.6 ‐ 0.6 ‐ 766.1<strong>Report</strong>able segment liabilities 1,637.6 1,142.3 1,003.0 20.3 615.6 278.1 3,104.6 ‐ 7,801.5∗Profit after tax attributable to members of the parent entity before gains on sale and impairments was $272.0 million.Leighton Holdings LimitedAppendix 4E and Consolidated <strong>Preliminary</strong> <strong>Final</strong> <strong>Report</strong> for the Period Ended 31 December 2011 14