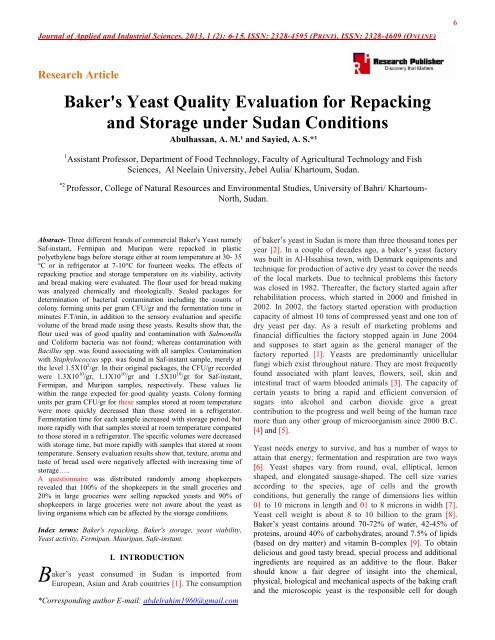
Baker's Yeast Quality Evaluation for Repacking and Storage under ...
Baker's Yeast Quality Evaluation for Repacking and Storage under ...
Baker's Yeast Quality Evaluation for Repacking and Storage under ...
- No tags were found...

You also want an ePaper? Increase the reach of your titles
YUMPU automatically turns print PDFs into web optimized ePapers that Google loves.
GenusShapeSpore<strong>for</strong>mingMotilitytestO/F testCatalasetestoxidizestestGrowth inairGramstrainJournal of Applied <strong>and</strong> Industrial Sciences, 2013, 1 (2): 6-15, ISSN: 2328-4595 (PRINT), ISSN: 2328-4609 (ONLINE)Questionnaire: Results of the questionnaire made aboutBaker’s <strong>Yeast</strong> selling in Khartoum North were illustrated inTable (11) <strong>for</strong> one hundred shopkeepers.Data AnalysisResults were analyzed statistically <strong>and</strong> the analysis ofvariance was per<strong>for</strong>med (at P ≤0.05 level) to determine thedeterioration in CFU/gr, yeast activity, specific volume <strong>and</strong>sensory evaluation of yeast samples with time consumed inroom temperature <strong>and</strong> refrigerator, organoleplic test <strong>and</strong>questionnaire raw data. Examination the significant differencesusing Least Significant Difference (LSD) test to separate themeans [29].III. RESULTS AND DISCUSSIONThe yeast strains studied were coded <strong>and</strong> noted in Table (1).The rheological characteristics of wheat flour used arepresented in Table (2).Table 2.Rheological Analysis of the Wheat FlourParameterResultWater absorption (%) 64.2Dough, Stability (min) 7.2Dough, Development time (min) 5.7Water absorption of wheat flour was found 64.2% whichlies within the range of 58.6% to 65.1% of Canadian flours,<strong>and</strong> similar develop time (5.7 minutes) reported [30]. Recentknowledge about the roles of water in the manufacture of fresh<strong>and</strong> frozen yeasted dough was reviewed [10].The stability ofdough was found 7.2 minutes which found less than 17.2minutes [31]. In terms of dough strength determined byFarinograph, the flour used was generally designated as strongwheat flour. The characteristics of the flour used were ofst<strong>and</strong>ard baking quality. The results of gluten index, wet gluten<strong>and</strong> dry gluten that shown in Table (3), were 71.35%, 38.3%<strong>and</strong> 12.9% respectively. The gluten index was found lowerthan 80%, which represents the st<strong>and</strong>ard good quality breadflour [32].Table 3.Gluten Quantity <strong>and</strong> qualityParameterResultWet gluten% 38.3Dry gluten% 12.9Gluten index% 71.35The viable counts as CFU/gr of the yeast factory sealedpackages were presented in Table (4).Table 4.The Viable Counts of <strong>Yeast</strong>s A, B <strong>and</strong> C as CFU/G<strong>and</strong> the Total Bacterial Contamination of Factory SealedPackage.SampleViablecount(CFU/g)Graycolonies(count/g)Bacterial countsYellowcolonies(count/g)8Total(count/g)A 1.3 x 10 10 2.2 x 10 2 1.5 x 10 2 3.7 x 10 2B 1.1 x 10 10 3.2 x 10 3 - 3.2 X 10 3C 1.5 X 10 10 1.0 X 10 4 - 1.0 x 10 4Where: A: Saf-instant. B: Fermipan . C: MauripanThe CFU/gr <strong>for</strong> samples A, B <strong>and</strong> C, were found to be1.3X10 10 /gr, 1.1X10 10 <strong>and</strong> 1.5X10 10 gr, respectively. Onegram of baker’s yeast should contain about 3X10 10 CFU/gr[33] <strong>and</strong> [34]. This means that, the viability of samples <strong>under</strong>study was lower than the theoretical value <strong>for</strong> about onedecimal. One gram of baker’s yeast should contain not lessthan 10 billion 1X10 10 CFU/gr. [35]. Accordingly, the yeastsamples <strong>under</strong> study be<strong>for</strong>e storage can be considered as goodquality yeasts. In fact, a colony may be <strong>for</strong>med from more thanone yeast cell. It is there<strong>for</strong>e important to be careful if onewants to judge the viability of yeast from their CFU/gr, onehas to know their activity as well. The three commercialbr<strong>and</strong>s of yeast were tested <strong>for</strong> contamination with bacteria.The bacteria associated with samples were isolated accordingto their color <strong>and</strong> shape of the colonies as shown in Table (5).Actually, two different colonies were found associating withsamples. One colony group was yellowish in color while theother colony group was grayish. The yellowish coloniescontaminating baker’s yeast samples were tentativelyidentified as Bacillus spp. The gray colonies were tentativelyidentified as Staphylococcus spp. as presented in Table (5).Table 5. Isolates of Bacterial Genera Contaminating the Factory Sealed PackagesColonyYellowColonies+ve +ve -ve +ve F +ve +ve Rod BacillusGrayColonies +ve +ve -ve +ve F -ve -ve Cocci Staphylococcus
Journal of Applied <strong>and</strong> Industrial Sciences, 2013, 1 (2): 6-15, ISSN: 2328-4595 (PRINT), ISSN: 2328-4609 (ONLINE)Where: O/F means Oxidation – FermentationBacillus spp. was found dominant <strong>and</strong> contaminating allsamples at different levels. Counts of Bacillus spp. were2.2X10 2 , 3.2X10 3 <strong>and</strong> 1X10 4 CFU/gr <strong>for</strong> sample A, B <strong>and</strong> C,respectively. Staphylococcus spp. were found contaminatingamount [36]. Active dry <strong>and</strong> compressed Baker’s yeast sold inEgypt were tested <strong>for</strong> contamination; faecal coli<strong>for</strong>ms,Salmonella, Bacillus cereus <strong>and</strong> Staphylococcus aureusdetected indicated that, Backer’s yeast could represent notablesample B merely at a level of 1.5X10 2 CFU/gr. Coli<strong>for</strong>m hazards to humans <strong>and</strong> may be cause <strong>for</strong> public healthbacterium <strong>and</strong> Salmonella genera were not found concerns [37].contaminating yeast samples. The total bacterial contamination Fermentation time means the time needed to produce onecounts were 3.7X10 2 , 3.2X10 3 <strong>and</strong> 1.0X10 4 <strong>for</strong> samples A, B thous<strong>and</strong> Cm 3 of carbon dioxide by the yeast sample in<strong>and</strong> C, respectively. Bacterial contamination of the yeastsamples in their factory sealed packages were foundacceptable according to the Sudanese st<strong>and</strong>ards. As stated bySaudi St<strong>and</strong>ards <strong>and</strong> Meteorology Organization; SSMO [36],the total bacterial contamination should not exceed 1X10 4colonies per one gram of baker’s yeast <strong>and</strong> the Coli<strong>for</strong>ms <strong>and</strong>Salmonella spp. must not be found. Accordingly, the testedminutes. The fermentation time indicates the yeast activity i.e.the faster yeast strain reached the required volume of carbondioxide, the more active it is. The three yeast samples weretested <strong>for</strong> their activity as described be<strong>for</strong>e <strong>and</strong> results arepresented in Table (6). <strong>Yeast</strong> sample C was the fastest, sampleA was moderate <strong>and</strong> sample B was delayed 45 minutes toproduce the required amount of gas.yeast br<strong>and</strong>s were originally contaminated but in an acceptableTable 6: Fermentation Time <strong>and</strong> Specific Volume of Loaves Produced By Factory Sealed Package.Sample Fermentation time <strong>for</strong> production 1000Cm 3 CO 2 (minutes)Loaves specific volume(cc/g)43 4.80AB 45 4.70C 35 4.88Where: A: Saf-Instant. B: Fermipan. C: Mauripan.9Fermentation time has converse relation with the viability.Sample C which had the highest CFU/gr was the best inviability <strong>and</strong> activity. This can be explained by the fact that themore number of viable cells count, the more capability of yeastfermentation. The fermentation time be<strong>for</strong>e storage will beconsidered as a reference time <strong>for</strong> further investigations whenchanges of the fermentation time <strong>for</strong> the samples in storage[38].The specific volume of the loaves raised containing yeastsamples at zero time of the storage were 4.80, 4.70 <strong>and</strong> 48 cc/g<strong>for</strong> sample A, B <strong>and</strong> C, respectively. These results are shownin Table (6). The values agreed with the result reported by[39] who reported 4.75 cc/gr <strong>and</strong> better than the result of3.67cc/gr reported by [11] <strong>and</strong> Food Research Centre Criteria[40]. The mentioned values were in the range between 3.5 <strong>and</strong>4.0 cc/g expected <strong>for</strong> good quality yeast. However, all yeastsamples <strong>under</strong> study were found of good quality be<strong>for</strong>e thebeginning of storage period. The results be<strong>for</strong>e storage will betaken as a reference <strong>for</strong> samples in storage. The intensity of thechanges during storage depends on temperature [9]. Six yeastsamples were used to study the deterioration of yeast viabilityin storage. Three of these samples were stored at roomtemperature. The other three samples were stored inrefrigerator temperature. The results are presented in Table(7).At zero time of the storage, sample A recorded 1.3X10 10CFU/gr. After one week of storage, at room temperature, thevalue has dropped to 8.1X10 9 CFU/gr, while after four weeksit has dropped to 9.1X19 8 CFU/gr. This value is within thecritical value of acceptability. After five weeks, the yeastsample in storage became of poor quality.In comparison with the same yeast strain stored in therefrigerator temperature, significant differences (at P ≤0.05level) were observed between samples A stored at roomtemperature <strong>and</strong> A-1 stored in the refrigerator. The CFU/gr ofsample A stored at room temperature has decreased morequickly than that of sample A-1 stored in the refrigerator. Nosignificant differences (at P≥0.05 level) between the CFU/grvalues of sample B <strong>and</strong> C in storage at room temperature wereobserved. Both samples became of poor quality, in theirviability basis, after about seven weeks. No significantdifferences (at P≥0.05 level) between the CFU/gr values of thethree samples stored in the refrigerator were noticed. Allsamples A-1, B-1 <strong>and</strong> C-1 became of poor quality after abouttwelve weeks. That means the repacked yeast can be stored atroom temperature <strong>for</strong> maximum of four weeks. This period canbe extended to ten weeks in the refrigerator without ignoringthe importance of the conventional h<strong>and</strong>ling.
Journal of Applied <strong>and</strong> Industrial Sciences, 2013, 1 (2): 6-15, ISSN: 2328-4595 (PRINT), ISSN: 2328-4609 (ONLINE)Table (7).The Viable Count of <strong>Yeast</strong> Samples A, A-1, B, B-1, C <strong>and</strong> C-1 Stored <strong>for</strong> 14 Weeks.10<strong>Storage</strong>duration(week)Samples CFU/gA A-1 B B-1 C C-11 8.1 x 10 9 9.1 x 10 9 8.0 x 10 9 8.4 x 10 9 8.6 x 10 9 1.2 x 10 92 7.2 x 10 9 8.6 x 10 9 7.1 x 10 9 8.2 x 10 9 8.2 x 10 9 1.0 x 10 93 6.0 x 10 9 8.1 x 10 9 5.3 x 10 9 7.6 x 10 9 7.7 x 10 9 9.8 x 10 94 9.1 x 10 8 7.2 x 10 9 3.2 x 10 9 6.7 x 10 9 6.3 x 10 9 8.9 x 10 95 6.2 x 10 8 6.0 x 10 9 1.5 x 10 9 5.4 x 10 9 4.8 x 10 9 8.1 x 10 96 5.0 x 10 8 4.9 x 10 9 8.8 x 10 8 8.6 x 10 9 1.2 x 10 9 7.8 x 10 97 1.7 x 10 8 3.4 x 10 9 6.1 x 10 8 3.1 x 10 9 8.1 x 10 8 7.2 x 10 98 7.4 x 10 7 1.3 x 10 9 4.1 x 10 8 2.2 x 10 9 4.3 x 10 8 6.3 x 10 99 2.1 x 10 7 9.1 x 10 9 1.6 x 10 8 1.0 x 10 9 1.9 x 10 8 5.1 x 10 910 8.2 x 10 6 7.3 x 10 9 9.1 x 10 7 9.7 x 10 8 71 x 10 7 3.9 x 10 911 3.1 x 10 6 9.8 x 10 8 7.5 x 10 7 8.2 x 10 8 1.9 x 10 7 2.7 x 10 912 9.4 x 10 5 8.1 x 10 8 4.6 x 10 7 6.7 x 10 8 8.3 x 10 6 1.2 x 10 913 1.6 x 10 5 7.6 x 10 8 9.1 x 10 6 4.9 x 10 8 2.1 x 10 6 8.1 x 10 814 6.5 x 10 4 6.5 x 10 8 7.3 x 10 5 3.0 x 10 8 8.5 x 10 5 7.7 x 10 8Note: A, B <strong>and</strong> C yeast samples were stored at room temperature at (30-35°C) <strong>and</strong> A-1, B-1 <strong>and</strong> C-1 yeast samples were stored inrefrigerator at (7-10°C).The Fermentograph was used to determine the activity of theyeast samples with the time consumed by each yeast sample toevolve 1000 cc of carbon dioxide. The results were presentedin Table (8). The time consumed by each yeast sample toproduce the certain amount of gas increased with the storagetime. Samples stored at the room temperature havedeteriorated more rapidly than those stored in the refrigerator.There are significant differences in activity (at P≤0.05 level) ofsample A <strong>and</strong> A-1. The same findings were found of samplesB, B-1, C <strong>and</strong> C-1. The activity deterioration is more rapid<strong>under</strong> aerobic conditions <strong>and</strong> at room temperature because themaintenance requirements of the yeast increase <strong>under</strong> suchconditions. The activity results, obtained in this study, are inagreement with the results of [33] who grouped the yeast inthree groups according to their gas generation. <strong>Yeast</strong>s needless than 60 minutes <strong>for</strong> dough rising are of good quality.<strong>Yeast</strong>s need 60-100 minutes are moderate <strong>and</strong> yeasts needover 100 minutes are of poor quality. The deteriorationpercentage of each sample was calculated as describedpreviously.As shown in Figures 1, 2 <strong>and</strong> 3, sample A which stored atroom temperature, had 300% deterioration percentage by theend of 14 weeks storage period. Sample B condition wassimilar to sample A while sample C reached almost 350% ofits deterioration activity. The deterioration percentage ofsample A-1 after 11 weeks, was similar to the deteriorationpercentage of sample A stored <strong>for</strong> six weeks. After 11 weeks,sample B-1 had the same value as sample B when 5 weeksstorage at room temperature. Sample C-1 had the similarresults as sample C after five weeks storage.Baking properties of bread component <strong>for</strong> each yeast samplewere assessed by measuring the specific volumes of bakedbread. The specific volume represented the leavening ofbaker’s yeast because it increased in proportion to theresidential gassing power in the dough. The specific volumesof the bread be<strong>for</strong>e <strong>and</strong> after storage were compared
Journal of Applied <strong>and</strong> Industrial Sciences, 2013, 1 (2): 6-15, ISSN: 2328-4595 (PRINT), ISSN: 2328-4609 (ONLINE)Table (8). Time in Minutes Needed To Produce 1000 Cm 3 CO 2 during <strong>Storage</strong> of Samples A, A-1, B, B-I, C <strong>and</strong>.C-111<strong>Storage</strong>duration(week)Samples (Minutes)A A-1 B B-1 C C-11 48 46 50 48 38 362 51 49 56 50 41 393 62 50 66 54 49 424 75 51 89 56 54 495 81 52 98 57 67 516 90 53 116 59 72 527 102 55 121 60 88 548 111 59 128 62 100 569 121 65 133 68 108 5710 129 80 141 88 120 6411 140 92 153 97 127 8012 151 98 168 103 140 9513 162 102 176 108 152 9814 175 108 187 114 160 103Note: Samples A, B <strong>and</strong> C stored at room temperature (30-35°C). Samples A-1, B-1 <strong>and</strong> C-1 stored in refrigerator (7-10°C)Fig.1: The Deterioration percentage of sample A Stored at room temperature (30 o - 35 0 C) <strong>and</strong> sample A-1 (stored in refrigerator7 o - 10 0 C)Deterioration % = F.T. of yeast sample in storage - F.T. of yeast sample be<strong>for</strong>e storageF.T. of yeast sample be<strong>for</strong>e storage,Where: F.T.: Fermentation Time
Deterioration(%)Journal of Applied <strong>and</strong> Industrial Sciences, 2013, 1 (2): 6-15, ISSN: 2328-4595 (PRINT), ISSN: 2328-4609 (ONLINE)123503002502001501005001 2 3 4 5 6 7 8 9 10 11 12 13 14<strong>Storage</strong> time (w eek )Fig. 2: The deterioration percentage of sample B stored at room temperature (30 o - 35 o C) <strong>and</strong> sample B-1 stored in refrigerator(7 o - 10 o C)Fig. 3: The deterioration percentage of sample C stored at room temperature (30 o - 35 o C) <strong>and</strong> sample C-1 stored in refrigerator(7 o - 10 o C)At zero time of the storage, samples A, B <strong>and</strong> C had similarspecific volumes ranging between 4.70 <strong>and</strong> 4.88 cc/gr. Duringthe period of storage yeast samples behavior were summarizedin Table (9). The specific volume values exhibited significantdecreases (at P< 0.05 level) with the storage. The specificvolumes of bread containing the yeast strains stored at theroom temperature <strong>for</strong> one week, dropped to 4.80, 4.71 <strong>and</strong>4.61 cc/gr <strong>for</strong> the samples C, A <strong>and</strong> B, respectively. Aftereight weeks storage, these values were drop to 3.35, 3.21 <strong>and</strong>3.17 cc/gr <strong>for</strong> samples C, A <strong>and</strong> B, respectively <strong>and</strong> theserecords indicated poor quality bread. Similar findings werefound with the samples stored in the refrigerator <strong>for</strong> elevenweeks of storage. The bread containing yeast strains stored inrefrigerator had higher specific volumes than that containingyeast strains stored at the room temperature. These resultsindicated that, the yeasts stored at room temperature, in opencontainers, gave poor bread quality after seven weeks ofstorage. Whereas, the yeasts stored in the refrigeratortemperature gave poor quality bread after eleven weeks ofstorage. One possible reason <strong>for</strong> this is that, baker’s yeast issusceptible to deterioration during storage, as a result ofdecreasing in the viable counts, <strong>and</strong> does not retain sufficient
Journal of Applied <strong>and</strong> Industrial Sciences, 2013, 1 (2): 6-15, ISSN: 2328-4595 (PRINT), ISSN: 2328-4609 (ONLINE)leavening ability after storage. The suggestion in this work isto consider the values of specific loaf volumes expected fromgood quality yeast are ranging between 3.5 <strong>and</strong> 4.8cc/gr.13Fluted pumpkin seed flour, when substituted up to 20% levelin bread making give acceptable loaf volume quality 1.75-2.80cm [41]Table (9). Specific Volume of the Loaves Containing <strong>Baker's</strong> <strong>Yeast</strong> Samples A, B, C, A-1, B-1 <strong>and</strong> C-1 stored <strong>for</strong> 14 week<strong>Storage</strong>duration(week)Samples (cc/g)A A-1 B B-1 C C-11 4.71 4.75 4.61 4.64 4.81 4.832 4.52 4.62 4.50 4.49 4.57 4.683 4.36 4.47 4.29 4.31 4.42 4.524 4.14 4.23 4.01 4.13 4.19 4.385 3.83 4.12 3.81 4.05 3.92 4.286 3.68 4.04 3.61 3.93 3.74 4.157 3.44 3.98 3.35 3.82 3.48 4.078 3.21 3.90 3.17 3.72 3.35 3.979 3.19 3.81 3.10 3.61 3.29 3.6510 3.04 3.67 2.98 3.44 3.11 3.6111 2.82 3.36 2.71 3.21 2.87 3.4712 2.71 3.17 2.62 2.95 2.78 3.2813 2.48 3.01 2.41 2.82 2.54 3.1214 2.26 2.80 1.15 2.69 2.36 2.97Where: A, B, C.: yeast samples stored at room temperature (30-35°C) <strong>and</strong> A-1, B-1 And C-1: yeast samples stored inrefrigerator (7-10°C)During dough fermentation gluten maturation occurs,promoting extensibility <strong>and</strong> gas retention. These characteristicsprovide volume, texture, aroma, taste <strong>and</strong> colour to the dough<strong>and</strong> bread [8]. There<strong>for</strong>e, dough quality is fundamental toobtain high quality bread. Patents on baker’s yeast withimproved characteristics such as aromatic or nutritiveproperties confirms recent interest <strong>for</strong> a very wide range oftailored –made yeast-based ingredients <strong>for</strong> bakery application[5]. At zero time of the storage, both external <strong>and</strong> internalcharacteristics of the bread, made with the yeast samples, wereevaluated. The results presented in Table (10), show highlyacceptable organoleptic quality of bread. In various storagetimes, the bread sensory evaluation results showed that, thecolor of the crumb was found stable as light yellow colour,whereas crust color, texture, taste <strong>and</strong> aroma were significantly(at P< 0.05 level) decreased with the time. It can be concludedthat bread with improved sensory characteristics can beobtained by using yeast with good leavening <strong>and</strong> flavour<strong>for</strong>mation abilities. Salt-stressed Backer’s yeast made thebread softener <strong>and</strong> significantly improved sensory properties<strong>for</strong> aroma, taste <strong>and</strong> overall acceptability [42].Questionnaire results were presented in Table (11).Hundred percent of all groceries are not selling compressedyeast or any Sudanese made yeast, while 100% <strong>and</strong> 20% ofsmall <strong>and</strong> large groceries, respectively sell the baker’s yeast inrepacked polyethylene plastic bags. More than 80% of theshopkeepers in large <strong>and</strong> small groceries had no idea about thebaker’s yeast, whether it is a living microorganism or not.They deal with baker’s yeast as a type of baking power. It wasnoticed that there is no in<strong>for</strong>mation on the labels of the factorypacked yeast telling the sellers how to h<strong>and</strong>le or store theyeast. In addition, there is no restriction given to them to avoidselling part of the factory-sealed packages
Journal of Applied <strong>and</strong> Industrial Sciences, 2013, 1 (2): 6-15, ISSN: 2328-4595 (PRINT), ISSN: 2328-4609 (ONLINE)Table (10) Organoleptic Assay of Bread Containing the <strong>Yeast</strong> Samples14Parameter Sample Crust Colour Crumb Colour Texture Taste AROMA OverallAcceptanceSample A B.S 4.7 a 4.4 a 4.3 a 4.7 a 4.2 a 4.3 aSample B B.S 4.2 a 4.6 a 4.3 a 4.6 a 4.4 a 4.7 aSample C B.S 4.5 a 4.5 a 4.7 a 4.7 a 4.4 a 4.7 aSample A I.S 1.8 b 4.2 a 1.2 c 1.8 b 1.2 c 1.1 cSample B I.S 2.1 b 4.3 a 1.3 c 1.5 c 1.5 b 1.1 cSample C I.S 1.6 c 4.1 a 1.2 c 1.7 c 1.9 b 1.3 cSample A-1/ I.S. 2.4 b 4.5 a 1.9 b 1.4 c 2.0 b 1.3 cSample B-1/ I.S. 3.1 b 4.2 a 2.0 b 1.6 c 2.1 b 1.2 cSample C-1/ I.S. 2.5 b 4.4 a 1.8 b 1.5 c 2.1 b 1.5 cMeans scores with the superscript letters are not significantly different at P>0.05 level.Score obtained indicated the following: 5 = Excellent. 4 = Very good. 3 =good. 2 = fair. 1 = Not accepted.Where: B.S: Sample of bread containing yeasts be<strong>for</strong>e storage <strong>and</strong> I.S: Samples of bread containing yeasts during storage.Table (11) Results of Questionnaire Made About <strong>Baker's</strong> <strong>Yeast</strong> Selling in Khartoum North AreaDescription Small Groceries (%) Large Groceries (%)Selling dry instant yeast 90 00Selling compressed yeast 00 00Selling locally made yeast 00 00Selling saf- instant yeast strain 90 100Selling mauripan yeast strain 20 70Selling fermipan yeast strain 10 20Selling other strains 10 40<strong>Repacking</strong> yeast in small bags 100 20Idea about Sudanese factory 20 10Idea about yeast is a livingmicroorganism (correct)2010IV. CONCLUSIONSThe Following conclusions were drawn from this study:1. All baker ’ s yeast samples tested were originally ofgood quality.2. The practice of repackaging of yeasts in smallamounts caused a depression in bread volumes,specific loaf volumes <strong>and</strong> sensory evaluation scoresof the bread.3. Storing repacked packages at room temperature wasfound to affect the quality of the yeasts samplesnegatively. This effect was also noticed in thesamples stored in the refrigerator but quite slowly.4. The practice of repacking in plastic bags <strong>and</strong> badstorage of the yeasts contribute to bad quality breadproduction.5. The bad quality of bread found in the markets may bedue to using baker's yeast stored in inept conditions.V. REFERENCES[1] Ministry of commerce.(1993) Sudanese <strong>Yeast</strong> <strong>and</strong> FermentationFactory, Al-Hassahesa; Personal communication.[2]. Hamad, S. H. (1989). Screening of <strong>Yeast</strong> Associated with Foodfrom the Sudan <strong>and</strong> their possible Application <strong>for</strong> Single Cell Protein<strong>and</strong> Ethanol Production. Ph. Dissertation, Sudan, Berlin.[3] Lodder, J.; Sloaff, W. C. H. <strong>and</strong> Kreger. Van, R. I. (1956). Theclassification of yeast. In ''The chemistry <strong>and</strong> Biology of yeast''. (A.H. Cook edit.). 1-57. Academic Press Inc.Publishers, New York.[4] Rose, A. H. <strong>and</strong> Harrison, J. S. (1969). “The <strong>Yeast</strong>.” AcademicPress Inc. London.[5] Gèlinas, P (2009). Inventions on baker’s yeast strains <strong>and</strong>specially ingradients. Recent Pat. Food Nutr. Agric., Vol (1), pp,104-132.[6] Yerushaml. L. <strong>and</strong> volesky, B. (1981). ExperimentalBioenergetics of Saccharomyces cerevisiae in Respiration <strong>and</strong>Fermentation. Biotech <strong>and</strong> Bioeng., XXIII : 2373-2390''.[7] Jay, J. M. (1992). Modern food Microbiology. Fourth edition.Published by Van Vostrant Reinhold, New York.[8] Calvel, R.; Wurtz, R. L.; <strong>and</strong> MacGuine, J. J. (2001). “The Tasteof Bread.” Aspen, MD (2001).[9] Pejin, D. J; Grujic, O. S; Pejin, J. D <strong>and</strong> Kocic-Tanackov, S. D(2009). Effect of yeast storage temperature <strong>and</strong> flour composition onfermentative activities of backer’s yeast. Zbornik Matice srpske zaprirodne nauke (116) 305-313.[10] Loveday, S. M; Huang, V. T; Reid, D. S <strong>and</strong> Winger, R. G(2012). Water dynamics in fresh <strong>and</strong> frozen yeasted dough. Crit. Rev.Food Sci. Nutr, Vol 52 (5), pp 390-409.
Journal of Applied <strong>and</strong> Industrial Sciences, 2013, 1 (2): 6-15, ISSN: 2328-4595 (PRINT), ISSN: 2328-4609 (ONLINE)[11].Osman, M. M. (1997). St<strong>and</strong>ard Methods <strong>for</strong> testing Baker’syeasts <strong>under</strong> Sudan condition. PhD thesis, University of Khartoum.Sudan.[12] Gèlinas, P., Lagimoniere, M. <strong>and</strong> Dubord, C. (1993). Baker’s<strong>Yeast</strong> Sampling <strong>and</strong> Frozen Dough Stability. Journal of CerealChemist. 70 (2): 219-225.[13] Association of Official Analytical Chemist; AOAC. (1980).Official Methods of Association of OfficialAnalytical Chemist (Harwitz, W. 3 rd .edition) Washington.[14] Pearson, D. (1976). The Chemical Analysis of Food, 7th edition.[15] International Association <strong>for</strong> Cereal Chemistry; ICC (1995).International Association <strong>for</strong> Cereal Chemistry, St<strong>and</strong>ard Method No.107/1. Vienna Austria.[16] American Association of Cereal Chemist; AACC. (1993).American Association of Cereal Chemist Approved Methods.Reference Book, 8 th Edition.[17] International Association <strong>for</strong> Cereal Chemistry; ICC (1982).International Association <strong>for</strong> Cereal Chemistry, St<strong>and</strong>ard Method No.137, Vienna Austria.[18] Hugh, R. <strong>and</strong> Leifson, E. (1953). The taxonomic significance byvarious grams-negative bacteria. J. Bact., 66: 24-26[19] Harrigan, W. F <strong>and</strong> McCance, M. E (1998). Laboratory Methodsin Food <strong>and</strong> Diary Microbiology. Academic Press Inc. London.[20] Cowan, S. J. <strong>and</strong> Steel, K. (1974). Mannual <strong>for</strong> Identification ofMedical Bacteria, (2 nd edition). Cambridge, University Press.London.[21] American Public Health Association; APHA (1976) St<strong>and</strong>ardMethods <strong>for</strong> the Examination of Dairy products. Inc. (13 th ed.).American Public Health Association, Inc. New York.[22] Juven, B. J. Cox, N. A., Bailey, J. S., Thomason, J. E., Charles,O. W. <strong>and</strong> Shultz, J. V. (1984). Survival of Salmonella in dry food J.Food. Prot., 47: 445.[23] Valdes, I.; Plaza, A. <strong>and</strong> Gonzalez, G. (1990). Isolation <strong>and</strong>Typification of Contaminating <strong>Yeast</strong> in a yeast plant. In ''RevistaICIDCA. Sorbe. Los Derivadosde-Za. Canada-Azucer 24(1): 15-17.[24] Barnett, J. A.; Payne, R. A. <strong>and</strong> Yarrow, D., (1983). <strong>Yeast</strong>Characteristics <strong>and</strong> Identification. Reference, Cambridge UniversityPress. London.[25] Difco Mannal of Dehydrated Culture Media <strong>and</strong> reagents <strong>for</strong>Microbiological <strong>and</strong> Clinical Laboratory Procedures. 9th ed. Detroit,Michigan.[26] Andrews, W. (1992) Manual of food quality control. 4. Rev. 1.Microbiological analysis, FAO, Food <strong>and</strong> Nutrition Paper, 14/4 Rev.1, FAO, Rome, Italy.15[27] Makoto, F; Yoshikawa, S; Asani, K <strong>and</strong> Hanai, T. (1992).Dielectric Monitoring of Gas Production in Fermenting BreadDough. Cereal Chemist. 69 (3): 325-327.[28] Devaux, M. F <strong>and</strong> Robert, P. (1992). Description of the texturalappearance of bread crumb by Video Image Analysis. CerealChemists, Vol. (69) 3:257-261.[29] Peterson, R. G. (1985). Design <strong>and</strong> Analysis of experiments. Pp.429. Marcel Deker, Inc. New York.[30] Inoue, Y. <strong>and</strong> Bushuck, W. (1992). Studies on Frozen Doughs.11. Flour <strong>Quality</strong> Requirements of Bread Production from Frozendough. American Association of Cereal Chemists. 69 (4): 423-428.[31] Mahamoud, I. A. A. (2003). Biscuits from composite flour ofwheat <strong>and</strong> sorghum. M.Sc. Thesis, University of Khartoum.[32] International Association <strong>for</strong> Cereal Chemistry; ICC (1994).International Association <strong>for</strong> Cereal Chemistry. Vienna, Austria.[33] Bronn, W. K. (1982). Technology Der Hefefabrikation script –Tu – Berlin. Burrow, S. (1970). Bakers <strong>Yeast</strong> in the “<strong>Yeast</strong>” (A. H.Rose <strong>and</strong> J. S. Harrison) 3: 349-420 Academic Press. Inc. London.[34] Jones, K. <strong>and</strong> Amos, A. (1967). <strong>Yeast</strong> “In Modern CerealChemistry”. Pp. 248-300. Food Trade Press.[35] Lesaffre (1998): WorldWideWeb.Links:http://www.Lesaffre.com/com/default-eng.asp. Red Star: http://www.Redstaryeast.com.[36] Saudi St<strong>and</strong>ards <strong>and</strong> Meteorology Organization; SSMO (1988).Beaker’s <strong>Yeast</strong> <strong>and</strong> Inactive Dried yeast. Issue No. 518, Chapter4.4.1.10. Riyadh.[37] Nasr, N. F; Zaky, A. S <strong>and</strong> Daw, Z. Y (2010). Microbiological<strong>Quality</strong> of Active Dry <strong>and</strong> Compressed Baker’s <strong>Yeast</strong> sold in Egypt.J. Pure <strong>and</strong> Appl. Microbiol, Vol. 4 (2), pp. 455-462.[38].Badi, S. M; El Faki, H. A <strong>and</strong> Perten, H. (1978). <strong>Evaluation</strong> ofSudanese wheat varieties. Sudan J. Food Science <strong>and</strong> Technology,10: 5-11.[39] Soha, H. Al Toum (2004) Utilization of Gonglase (Adansoniadigitata L.) <strong>and</strong> Guddiem (Grewin tenar (Forski) Fiori) as functionalfoodsinbread <strong>and</strong> biscuits making. M.Sc. Thesis, University of Khartoum.[40] Food Research Centre; FRC (1996). Personal communication.Khartoum North, Shambat. Sudan.[41] Agu, H. O; Ukonze, J. A <strong>and</strong> Paul, K. A. (2010). <strong>Quality</strong>Characteristics of bread made from Wheat <strong>and</strong> Fluted Pumpkin seedflour. Nigerian Food Journal, Vol (28), No 1, ISSN: 0189-7241.[42] Yeh, L. T; Charles, A. L; Ho, C. T <strong>and</strong> Huang, T. C (2009). ANovel bread making process using salt-stressed Baker’s yeast. J.Food Sci. Vol. 74 (9): S399-402.