Spunbond reinforcements for bituminous membranes made of ...
Spunbond reinforcements for bituminous membranes made of ...
Spunbond reinforcements for bituminous membranes made of ...
Create successful ePaper yourself
Turn your PDF publications into a flip-book with our unique Google optimized e-Paper software.
Environmental<br />
Product<br />
Declaration<br />
2.4 Cut-<strong>of</strong>f and allocation principles<br />
The processes contributing <strong>for</strong> less than 1% <strong>of</strong> the total environmental impact <strong>for</strong> each impact<br />
category have been omitted from the inventory. Where possible, the allocation is avoided or it<br />
follows a procedure based on the mass balance <strong>of</strong> the output products (see Table 1).<br />
2.5 Data Quality<br />
Data refer to the year 2010 and were collected in Freudenberg Politex plant located in Colmar<br />
(France) and Pisticci (Italy). The study was also based on the data from SimaPro ver. 7.2.3:<br />
Ecoinvent 2.2.<br />
The contribution <strong>of</strong> the other generic data to each impact category is below 10%.<br />
Data concerning energy aspects refers to the energy mix <strong>of</strong> the French site in Colmar and the<br />
production process <strong>for</strong> the electrical energy from palm oil in Pisticci.<br />
The data collection was conducted in compliance with the two modalities contained in the ISO<br />
14044:2006.<br />
2.6 Environmental pr<strong>of</strong>ile <strong>of</strong> the product<br />
To have univocal environmental in<strong>for</strong>mation and in order to support decisions about the use <strong>of</strong><br />
eco-sustainable materials, the impact categories have been analyzed in line with what<br />
requested by the indications <strong>of</strong> the Environmental Product Declaration (EPD) and referred to<br />
the production process illustrated in Figure 1. For the production <strong>of</strong> 1 kg Terbond ® the inflow<br />
material (mainly PET bottles post-consumer) in the system goes through the bottles recycling<br />
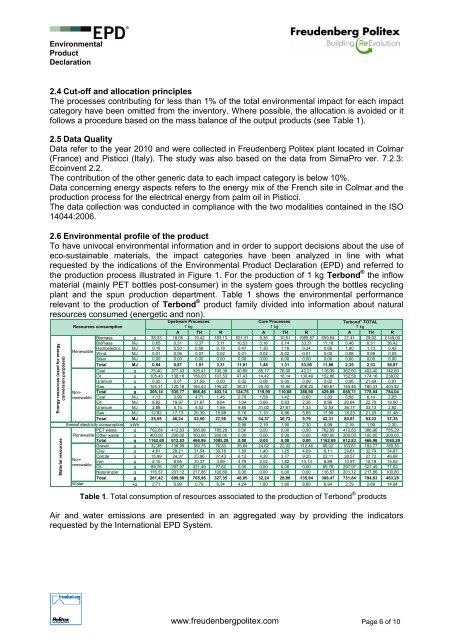
plant and the spun production department. Table 1 shows the environmental per<strong>for</strong>mance<br />
relevant to the production <strong>of</strong> Terbond ® product family divided into in<strong>for</strong>mation about natural<br />
resources consumed (energetic and non).<br />
Energy resources (used <strong>for</strong> energy<br />
conversion purposes)<br />
Material resources<br />
Resources consumption<br />
Renewable<br />
Nonrenewable<br />
Upstream Processes Core Processes Terbond<br />
1 kg 1 kg<br />
® TOTAL<br />
1 kg<br />
A TH R A TH R A TH R<br />
Biomass g 38,33 18,05 19,42 183,13 621,31 9,36 10,51 1965,87 659,64 27,41 29,92 2149,00<br />
Biomass MJ 0,65 0,31 0,37 3,11 10,53 0,16 0,14 33,31 11,18 0,46 0,51 36,42<br />
Hydroelectric MJ 0,18 0,50 0,58 0,18 0,47 1,30 1,16 0,24 0,66 1,80 1,73 0,42<br />
Wind MJ 0,01 0,06 0,07 0,02 0,01 0,02 0,02 0,01 0,02 0,08 0,09 0,03<br />
Solar MJ 0,00 0,00 0,00 0,00 0,00 0,00 0,00 0,00 0,00 0,00 0,00 0,00<br />
Total MJ 0,84 0,87 1,01 3,31 11,01 1,48 1,31 33,56 11,86 2,35 2,33 36,87<br />
Coal g 75,40 277,43 326,41 100,39 40,99 85,17 76,00 42,21 116,39 362,60 402,40 142,60<br />
Oil g 105,43 138,16 156,03 107,53 47,43 14,42 18,14 130,49 152,86 152,58 174,16 238,02<br />
Uranium g 0,00 0,01 21,59 0,00 0,02 0,06 0,05 0,00 0,02 0,06 21,64 0,01<br />
Gas g 124,31 120,16 164,43 195,22 36,31 20,30 15,90 208,20 160,61 140,46 180,33 403,42<br />
Total g 305,14 535,77 668,46 403,14 124,75 119,95 110,08 380,90 429,89 655,71 778,54 784,04<br />
Coal MJ 1,13 3,99 4,71 1,45 0,70 1,59 1,42 0,60 1,83 5,58 6,14 2,05<br />
Oil MJ 8,92 19,97 21,87 8,64 1,04 0,66 0,83 2,26 9,96 20,64 22,70 10,90<br />
Uranium MJ 2,68 5,14 5,52 1,59 9,85 31,02 27,61 1,33 12,53 36,17 33,13 2,92<br />
Gas MJ 12,82 17,13 20,39 15,88 5,16 1,10 0,86 5,60 17,99 18,23 21,25 21,48<br />
Total MJ 25,55 46,24 52,50 27,56 16,76 34,37 30,72 9,79 42,31 80,61 83,22 37,35<br />
there<strong>of</strong> electricity consumption kWh - - - - 0,99 2,19 1,90 2,30 0,99 2,19 1,90 2,30<br />
PET waste g 762,69 412,83 366,96 785,29 0,00 0,00 0,00 0,00 762,69 412,83 366,96 785,29<br />
Renewable Other waste g 400,00 200,00 100,00 300,00 0,00 0,00 0,00 0,00 400,00 200,00 100,00 300,00<br />
Total g 1162,69 612,83 466,96 1085,29 0,00 0,00 0,00 0,00 1162,69 612,83 466,96 1085,29<br />
Gravel g 32,38 138,99 160,75 76,83 35,64 24,62 22,02 112,46 68,02 163,61 182,77 189,30<br />
Clay g 4,61 28,21 31,54 30,78 1,50 1,40 1,25 4,09 6,11 29,61 32,79 34,87<br />
Nonrenewable<br />
Calcite<br />
Iron<br />
Oil<br />
g<br />
g<br />
g<br />
15,99<br />
2,10<br />
89,76<br />
24,37<br />
8,95<br />
297,97<br />
23,96<br />
10,37<br />
321,49<br />
37,43<br />
3,89<br />
77,62<br />
6,12<br />
4,79<br />
0,00<br />
4,20<br />
2,02<br />
0,00<br />
3,77<br />
1,82<br />
0,00<br />
9,25<br />
10,13<br />
0,00<br />
22,11<br />
6,89<br />
89,76<br />
28,57<br />
10,97<br />
297,97<br />
27,72<br />
12,19<br />
321,49<br />
46,68<br />
14,02<br />
77,62<br />
Natural gas g 116,57 201,12 217,86 100,80 0,00 0,00 0,00 0,00 116,57 201,12 217,86 100,80<br />
Total g 261,42 699,60 765,96 327,35 48,05 32,24 28,86 135,94 309,47 731,84 794,83 463,28<br />
Water<br />
kg 2,71 0,99 0,79 6,34 4,24 1,80 1,90 8,60 6,94 2,79 2,69 14,94<br />
Table 1. Total consumption <strong>of</strong> resources associated to the production <strong>of</strong> Terbond ® products<br />
Air and water emissions are presented in an aggregated way by providing the indicators<br />
requested by the International EPD System.<br />
www.freudenbergpolitex.com Page 6 <strong>of</strong> 10


