Spunbond reinforcements for bituminous membranes made of ...
Spunbond reinforcements for bituminous membranes made of ...
Spunbond reinforcements for bituminous membranes made of ...

Create successful ePaper yourself
Turn your PDF publications into a flip-book with our unique Google optimized e-Paper software.
Environmental<br />
Product<br />
Declaration<br />
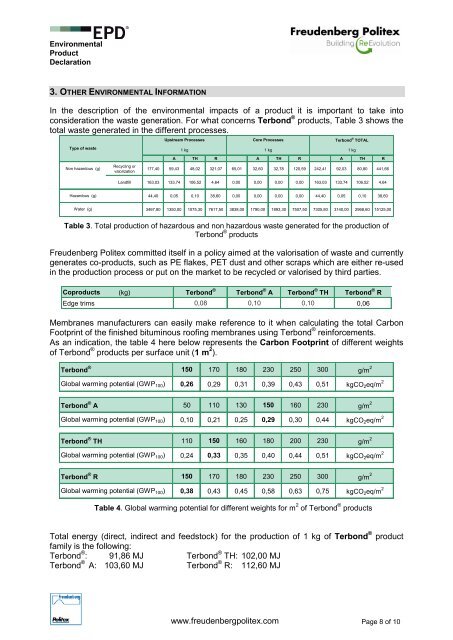
3. OTHER ENVIRONMENTAL INFORMATION<br />
In the description <strong>of</strong> the environmental impacts <strong>of</strong> a product it is important to take into<br />
consideration the waste generation. For what concerns Terbond ® products, Table 3 shows the<br />
total waste generated in the different processes.<br />
Type <strong>of</strong> waste<br />
Non hazardous (g)<br />
Hazardous (g)<br />
Water (g)<br />
Recycling or<br />
valorization<br />
Upstream Processes<br />
1 kg<br />
Core Processes<br />
Terbond ® TOTAL<br />
A TH R A TH R A TH R<br />
177,40 59,43 48,02 321,07 65,01 32,60 32,78 120,59 242,41 92,03 80,80 441,66<br />
Landfill 163,03 133,74 106,52 4,64 0,00 0,00 0,00 0,00 163,03 133,74 106,52 4,64<br />
1 kg<br />
44,40 0,05 0,10 38,60 0,00 0,00 0,00 0,00 44,40 0,05 0,10 38,60<br />
3467,80 1350,00 1075,30 7617,50 3838,00 1790,00 1893,30 7507,50 7305,80 3140,00 2968,60 15125,00<br />
Table 3. Total production <strong>of</strong> hazardous and non hazardous waste generated <strong>for</strong> the production <strong>of</strong><br />
Terbond ® products<br />
Freudenberg Politex committed itself in a policy aimed at the valorisation <strong>of</strong> waste and currently<br />
generates co-products, such as PE flakes, PET dust and other scraps which are either re-used<br />
in the production process or put on the market to be recycled or valorised by third parties.<br />
Coproducts (kg)<br />
Terbond ®<br />
Terbond ® A<br />
Terbond ® TH<br />
Edge trims 0,08<br />
0,10<br />
0,10<br />
0,06<br />
www.freudenbergpolitex.com Page 8 <strong>of</strong> 10<br />
1 kg<br />
Terbond ® R<br />
Membranes manufacturers can easily make reference to it when calculating the total Carbon<br />
Footprint <strong>of</strong> the finished <strong>bituminous</strong> ro<strong>of</strong>ing <strong>membranes</strong> using Terbond ® <strong>rein<strong>for</strong>cements</strong>.<br />
As an indication, the table 4 here below represents the Carbon Footprint <strong>of</strong> different weights<br />
<strong>of</strong> Terbond ® products per surface unit (1 m 2 ).<br />
Terbond ®<br />
150 170 180 230 250 300 g/m 2<br />
Global warming potential (GWP100) 0,26 0,29 0,31 0,39 0,43 0,51 kgCO2eq/m 2<br />
Terbond ® A 50 110 130 150 160 230 g/m 2<br />
Global warming potential (GWP100) 0,10 0,21 0,25 0,29 0,30 0,44 kgCO2eq/m 2<br />
Terbond ® TH 110 150 160 180 200 230 g/m 2<br />
Global warming potential (GWP100) 0,24 0,33 0,35 0,40 0,44 0,51 kgCO2eq/m 2<br />
Terbond ® R 150 170 180 230 250 300 g/m 2<br />
Global warming potential (GWP100) 0,38 0,43 0,45 0,58 0,63 0,75 kgCO2eq/m 2<br />
Table 4. Global warming potential <strong>for</strong> different weights <strong>for</strong> m 2 <strong>of</strong> Terbond ® products<br />
Total energy (direct, indirect and feedstock) <strong>for</strong> the production <strong>of</strong> 1 kg <strong>of</strong> Terbond ® product<br />
family is the following:<br />
Terbond ® : 91,86 MJ Terbond ® TH: 102,00 MJ<br />
Terbond ® A: 103,60 MJ Terbond ® R: 112,60 MJ