Workshops - UbiComp
Workshops - UbiComp
Workshops - UbiComp
- No tags were found...

Create successful ePaper yourself
Turn your PDF publications into a flip-book with our unique Google optimized e-Paper software.
We would also like to extend a special thank you to our sponsors—Nokia, Microsoft Research, theKorea Electronics Technology Institute, Samsung SDS, Korea Research Foundation, EDCorporation and SungKyunKwan University—whose financial support made the workshopprogram at <strong>UbiComp</strong> 2008 possible.We are excited to present these proceedings of the <strong>UbiComp</strong> 2008 Workshop Program and hopethat the proceedings inspire you.Sunny ConsolvoHyung Kyu SongWorkshop Co-Chairsiii
Table of ContentsDevices that Alter Perception ··············································································· 1Carson Reynolds, Alvaro Cassinelli, Anthony Dunne, and James Auger∙ DAP‐01 Feel the Force: Using Tactile Technologies to Investigate the Extended Mind ······················· 2Jon Bird, Simon Holland, Paul Marshall, Yvonne Rogers and Andy Clark∙ DAP‐02 SocialSense: A System For Social Environment Awareness ······················································· 6Robert S. Brewer, Samuel R. H. Joseph, Guanghong Yang, Neil Scott, and Daniel Suthers∙ DAP‐03 Boxed Ego ············································································································································ 10Alvaro Cassinelli and Masatoshi Ishikawa∙ DAP‐04 Fear tuners – Prostheses for instincts ···························································································· 14Susanna Hertrich∙ DAP‐05 Gesture recognition as ubiquitous input for mobile phones ······················································· 17Gerrit Niezen and Gerhard P. Hancke∙ DAP‐06 Creation of Sympathetic Media Content ························································································· 22Stéphane Perrin, Giuseppe Riva, and Alvaro Cassinelli∙ DAP‐07 Aural Antennae ····································································································································· 26Carson Reynolds, Alvaro Cassinelli, and Masatoshi Ishikawa∙ DAP‐08 Learn Traffic State Based on Cooperative Localization ······························································ 30Zhuo Sun, Yiqiang Chen, and Juan Qi∙ DAP‐09 Spatial coverage vs. sensorial fidelity in VR ················································································· 34Alexis Zerroug, Alvaro Cassinelli, and Masatoshi IshikawaUbiquitous Systems Evalaution ··········································································· 38Graeme Stevenson, Steve Neely, and Christian Kray∙ USE‐01 A Quantitative Evaluation Model of Group User Experience ····················································· 39Zhu Wang, Xingshe Zhou, Haipeng Wang, Hongbo Ni, and Ruijuan Wu∙ USE‐02 Usability Study of Indoor Mobile Navigation System in Commercial Facilities ······················· 45Yutaka Inoue, Takeshi Ikeda, Kiyoshi Yamamoto, Tomohisa Yamashita, and Akio Sashimaiv ii
∙ USE‐03 Clinical Proof‐of‐Concept – A Evaluation Method for Pervasive Healthcare Systems································································································································································ 51Jakob E. Bardram∙ USE‐04 The Challenge of Evaluating Situated Display based Technology InterventionsDesigned to Foster ‘Sense of Community’ ···················································································· 57Keith Cheverst, Nick Taylor, Mark Rouncefield, Areti Galani, and Christian Kray∙ USE‐05 Situvis: Visualising Multivariate Context Information to Evaluate SituationSpecifications ········································································································································ 62Adrian K. Clear, Ross Shannon, Thomas Holland, Simon Dobson, Aaron Quigley, and Paddy Nixon∙ USE‐06 Simulation Framework in Second Life with Evaluation Functionality for Sensor‐basedSystems ················································································································································· 68Boris Brandherm, Sebastian Ullrich, and Helmut PrendingerDesign and Integration Principles for Smart Objects ································· 74Fahim Kawsar, Michael Beigl, Kaori Fujinami, Gregor Schiele, Jin Nakazawa,Susanna Pirttikangas, and Tsutomu Terada∙ DIPSO‐01 Advanced Middleware Support on Wireless Sensor Nodes ··················································· 75Daniel Barisic, Guido Stromberg, and Michael Beigl∙ DIPSO‐02 Using the Connected Home Platform to support user tasks as orchestrationsof smart objects services ·············································································································· 81Apostolos Meliones, Achilles Kameas, Dimitrios Economou and Christos Goumopoulos∙ DIPSO‐03 SOEML: A Smart Object Event Markup Language using Temporal Intervals ···················· 87Takuro Yonezawa, Jin Nakazawa, Hiroshi Sakakibara, Goro Kunito, Tomohiro Nagata,and Hideyuki Tokuda∙ DIPSO‐04 Configuration Method of Wireless Smart Objects ····································································· 93Karri Nikunen, Hannu Heusala, and Jere Komulainen∙ DIPSO‐05 Randomised Collaborative Transmission of Smart Objects ···················································· 98Stephan Sigg and Michael Beigl∙ DIPSO‐06 Experimental Wired Co‐operation Architecture of Recon‐figurable Small SmartObjects ············································································································································ 110Jere Komulainen, Hannu Heusala, and Karri Nikuneniii v
∙ DIPSO‐07 Using Smart Objects as the Buildings Blocks of Pervasive AwarenessApplications ···································································································································· 116Achilles Kameas∙ DIPSO‐08 Multi‐Tracker: Interactive Smart Object for Advanced Collaborative Environment ··········· 121Sujin Ko, JunSeok Park, Jaeseon Hwang, Jun Park, Hyuk Lim, and JongWon Kim∙ DIPSO‐09 An Augmented Book and Its Application ················································································· 127Kaori Fujinami and Nobuhiro InagawaAmbient Information Systems ············································································· 128William R. Hazlewood, Lorcan Coyle, Zachary Pousman, and Youn-Kyung Lim∙ Ais‐01 Ambient Facades ·································································································································· 129Bernhard Wally, Alois Ferscha∙ Ais‐02 Ambient Interface Design for a Mobile Browsing Experience (AMBE) ····································· 136Rosaleen Hegarty, Tom Lunney, Kevin Curran, Maurice Mulvenna∙ Ais‐03 Ambient Life : Interrupted Permanent Tactile Life‐like Actuation as a Status Displayin Mobile Phones ································································································································· 140Fabian Hemmert∙ Ais‐04 Stay‐in‐touch: A System for Ambient Social Reminders ······························································ 144Eugene Kenny, Ross Shannon, Aaron Quigley∙ Ais‐05 User Generated Ambient Presence ·································································································· 148German Lado Insua, Mike Bennett, Paddy Nixon, Lorcan Coyle∙ Ais‐06 The Invisible Display – Design Strategies for Ambient Media in the Urban Context ··········· 152Dietmar Offenhuber∙ Ais‐07 Ambient Display in Academic Settings: Avoiding their Underutilization ···································· 158Umar Rashid, Aaron Quigley∙ Ais‐08 A Notification System for a Land‐mine Detector using Distributed Cognition ························· 167Silvia Torsi, Antonio Rizzoiv vi
Ubiquitous Sustainability: Citizen Science & Activism ····························· 168Eric Paulos, Marcus Foth, Christine Satchell, Younghui Kim, Paul Dourish,and Jaz Hee‐jeong Choi∙ GREEN-01 Live Sustainability: A System for Persuading Users toward EnvironmentalSustainability ·································································································································· 170Zita Chao‐ling Chen, Chad Chien‐chia Liu, Chien‐nan Chou, Ya‐wen Jong,and Chuin‐shan Chen∙ GREEN-02 Motivating Sustainable Behavior ······························································································· 174Ian Oakley, Monchu Chen, and Valentina Nisi∙ GREEN-03 Carbon Metric Collection and Analysis with the Personal EnvironmentalTracker ·········································································································································· 179Robert S. Brewer∙ GREEN-04 GreenSweeper: A Persuasive Mobile Game for Environmental Awareness ··················· 183Hui‐chun Lin, Kah Liu, and Nithya Sambasivan∙ GREEN-05 Sensonomy: Envisioning folksonomic urban sensing ··························································· 187Takashi Miyaki and Jun Rekimoto∙ GREEN-06 Fresh: Cell‐ID Mobile Forum for Community Environmental Awareness ························· 191Eiman Kanjo and Peter Landshoff∙ GREEN-07 Nevermind Ubiquity ······················································································································ 194Jeff Burke∙ GREEN-08 Semantics‐based urban sensing for Sustainability ································································ 197Martin Kohler and Jürgen PietschAutomated Journeys ······························································································ 201Arianna Bassoli, Johanna Brewer, and Alex Taylor∙ AUTOJ‐01 Make Me Happy: In Situ Data Collection for Urban Sync·················································· 203Stephan Baumann∙ AUTOJ‐02 Difficulties in Skill Acquisition and Pervasive Environments ················································ 205Adam Boulanger∙ AUTOJ‐03 Automation as a Very Familiar Place ······················································································ 207Mads Ingstrupvii iv
∙ AUTOJ‐04 Connectability in Automated Journeys ······················································································ 209Shin'ichi Konomi and Kaoru Sezaki∙ AUTOJ‐05 Liminal, Spiritual, and Ritual: Fabrication and Evasion in Urban Journeys throughPortable Devices ··························································································································· 211Nithya Sambasivan, Leena Ventä, Jani Mäntyjärvi, and Jonna Häkkilä∙ AUTOJ‐06 The Everyday Collector ··············································································································· 213Cati VaucelleUbiWORK : Design and Evaluation of Smart Environments In the Workplace······················································································································ 215Maribeth Back, Saadi Lahlou, Scott Carter, Kazunori Horikiri, Masatomi Inagaki,and Gerald Morrison∙ UBIW‐01 Illustration of the Intelligent Workload Balancing Principle in Distributed DataStorage Systems ······························································································································ 217Sergey Boldyrev, Sergey Balandin∙ UBIW‐02 Enhanced and Continuously Connected Environment for Collaborative Design ················ 220Yoichi Hanada, Yuji Matsumoto, and Ryusuke Naka∙ UBIW‐03 Secure and Dynamic Coordination of Heterogeneous Smart Spaces ·································· 224Nobuo Kawaguchi, Nobuhiko Nishio, Yohei Iwasaki, Ismail Arai, Koichi Tanaka,and Shigeo Fujiwara∙ UBIW‐04 Toward Easy Operation of Interactive Smart Meeting Space with Networked Display······························································································································································ 225Jong Won Kim, Sang Woo Han, and Nangon Kim∙ UBIW‐05 Contents and Conditions of Face‐to‐face Communication in the Workplace ······················ 227Yuji Matsumoto, Yoichi Hanada, and Ryusuke Nakaviii
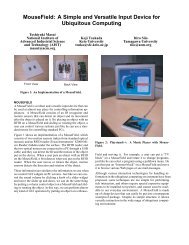
Devices that Alter Perception (DAP 2008)Carson Reynolds Alvaro CassinelliUniversity of Tokyo7-3-1 Hongo, Bunkyo-ku, Tokyo, 113-8658, Japan{carson, alvaro}@k2.t.u-tokyo.ac.jpAnthony Dunne James AugerRoyal College of ArtKensington Gore, London SW7 2EU, UKanthony.dunne@rca.ac.uk info@augerment.comDevices that Alter Perception is a new workshop that aimsto instigate development and critique of systems that focuson the human percepts. Sensors, actuators, implants,wearable computers, and neural interfaces can do more thansimply observe our bodies; these devices can alter andmanipulate our perceptions. The goals of the workshop areto: (1) better understand the process of perception (2) aidthose developing devices by sharing designs (3) debate ofethical and social issues that are unique to devices thatoperate below or upon awareness.Accepted position papers are presented in 10-minute oralpresentations or demonstrations followed by 5-minutequestion and answers sessions. Additionally, the positionpapers are uploaded to a special discussion site(http://dap.reddit.com) for commentary as well as voting.The paper receiving the highest score–as determined byopen, public voting–will be awarded a best paper prize.ACKNOWLEDGEMENTSWe would like to thank the Sunny Consolvo, Hyung KyuSong, Jongwon Kim, Timothy Sohn and the <strong>UbiComp</strong>organizers for the tremendous amount of help provided. Wewould also like the thank Masatoshi Ishikawa for providinga supportive environment for the development of thisresearch theme.ON LINE MATERIALSThe call for papers, information for attendees, and acceptedsubmissions are hosted at:http://www.k2.t.u-tokyo.ac.jp/perception/dap2008/SPONSORSThis workshop is jointly sponsored by the University ofTokyo's Meta-Perception Research Group and the RoyalCollege of Art's Design Interactions Department.1
Feel the Force: Using Tactile Technologies to Investigatethe Extended MindJon Bird, Simon Holland, Paul Marshall,Yvonne RogersThe Open UniversityPervasive Interaction Lab, ComputingDepartment, Milton Keynes, MK7 6AA, UK{J.Bird, S.Holland, P.Marshall,Y.Rogers}@open.ac.uk+44(0)1908 274066ABSTRACTWe describe the motivations behind the E-Sense projectwhich will investigate augmented perception by building arange of novel tactile interfaces. As well as exploring thepractical utility of these systems for real world tasks, we areparticularly interested in the following question: how can wedesign tactile interfaces to mediate novel sensory informationso that the user experiences the technology as an extensionof themselves?Author KeywordsE-Sense, extended mind, transparent technologies, tactile interfaceACM n KeywordsB.4.2 Input/Output Devices, H5.m. Information interfacesand presentation, K.4.1.c EthicsINTRODUCTIONRecent work in philosophy and cognitive science has introducedthe idea of the extended mind (for example, [5]), aview of the human cognitive system as a plastic hybrid ofbiological and non-biological components, including externalrepresentations and technologies. This perspective hasprofound implications for our notion of what it means to behuman, pointing to the potential to change thought and actionby integrating new technologies and information sources.Research into augmented perception 1 has established that avariety of sensory information can be mediated through tac-1 ‘Augmented perception’ encompasses both ‘sensory extension’and ‘sensory substitution’, and is where technology provides accessto environmental energy not available to a person’s biologicalperceptual system (for example, IR or ultrasound). In the substitutioncase this is because of perceptual impairment, for example, anindividual is blind or deaf.Copyright is held by the author/owner(s). <strong>UbiComp</strong> ’08 Workshop W1 –Devices that Alter Perception (DAP 2008) September 21st, 2008. This positionpaper is not an l n of <strong>UbiComp</strong> ’08.Andy ClarkUniversity of EdinburghDepartment of Philosophy, George Square,Edinburgh EH8 9JX, UKAndy.Clark@ed.ac.uk+44(0)131 650 3659tile interfaces in a way that is understandable to users andcan guide their actions. For example, in the pioneering workof Bach-y-Rita and co-workers on sensory substitution [1],blind participants have visual information from a camera representedto them in the form of the activation of an array oftactile actuators placed on their back, thighs or tongues. Withpractice, participants are able to use this tactile informationto make perceptual judgements and co-ordinate action, forexample batting a ball that is rolling off a table. Interestingly,as participants learn to use the tactile stimulation theirperception of it changes: sensing the percept in space ratherthan on their skin. The interface becomes transparent inuse, or ‘ready-at-hand’ to use Heidegger’s phrase [6] - thatis, the user experiences the technology as though it were anextension of themselves.Neuroscience experiments have established that tool use cancause structural changes in the brain: the receptive s ofsome neurons expand and incorporate the tool into the ‘bodyschema’ [12]. y, the neuronal changes only occurwhen the tactile information is used to guide action, a that provides support for O’Regan and Noë’s [13] characterisationof perception as primarily involving the mappingof sensorimotor contingencies: systematic relationships betweenaction and sensory input. These perceptual mappingscan be surprisingly plastic. Early work by Stratton [19] andKohler [10] established that humans can adapt to radical disruptionsof the relationship between sensors and actuators,for example, inverting glasses turning the visual d upsidedown. Of particular relevance to our project, Ramachandranand Blakeslee describe how the perceptual system can betricked into producing the experience of having a two footnose or experiencing tactile sensation in a table [15].However, despite extensive citations in the literature, thereis still substantial uncertainty concerning the nature of theseaugmenting sensory experiences. Given the remarkable capacityof people to adapt to changes in existing sensorimotormappings and to incorporate novel sensory modalities,under what conditions does a mediating technology not becometransparent? Does sensory extension support a ‘sensorimotorcontingencies’ model of perceptual experience? If itdoes, what can we learn about the form of sensorimotor contingencymappings that remain ‘opaque’ and do not become2
incorporated into the body; if it does not, which models betterexplain the perceptual experience of sensory extension?Are the mappings between action and augmenting sensoryinput as plastic as those coordinating biological senses andmotor systems? In the interdisciplinary E-Sense project webelieve that by creating a wide array of tactile interfaces andmonitoring both their use and the user experiences on an ongoing,day to day level, we will gain important insights intothese questions.Figure 1. A rapid prototype built to test the suitability of Arduino LilyPadvibe boards for tactile sensory extension interfaces. If light levelsgo above a hard-wired threshold value, then each of the sensors switcheson one of the vibe boards. The diameter of the shaftless vibrationmotor is 20mm. The LilyPad vibe boards consist of one of these motorsmounted on a printed circuit board that enables users to connect themto a microcontroller using conductive thread and incorporate them intoclothing.METHODOLOGYIn our interdisciplinary approach conceptual philosophicalanalysis feeds into the design of the sensory augmentationsystems and user studies will reciprocally feed back into philosophy.One concrete goal is to build useful sensory extensiontools; another, more nebulous, goal is to generate novelinsights into the extended mind. Our project is extremelyopen-ended as relatively little is known about the design issuesrelated to tactile systems or about the conditions underwhich such technologies become transparent in use. Consequently,we believe a productive approach is to combineconcepts and approaches from very different disciplines -psychology, philosophy and computer science. We are veryaware of the potential pitfalls, as well as the , thatcan result from interdisciplinary collaboration [18].Rapid Prototyping ApproachWe believe that a good way to develop and e our conceptualthinking about the extended mind and sensory augmentationis to embody our ideas in physical artefacts andtest them in the real world. This approach has been successfulin the past, particularly in open-ended exploratoryprojects [3,4]. We want to complete as many iterations of thebt cycle as possible during the project and sowe are adopting a rapid prototyping approach to constructingsensory extension interfaces. We are using open sourcetechnologies such as the Arduino electronics prototypingplatform [2] and the Processing programming language andenvironment [14] because with these tools we can quicklyconnect cheap, off-the-shelf components and build workingprototypes. See Figure 1 for a prototype that was built in afew hours to test whether Arduino LilyPad vibe boards [11]were suitable actuators for a wearable tactile system. Constructingthis prototype d that these cheap shaftlessmotors do provide a clearly perceptible signal through clothingand also highlighted the advantage of building a systemwhere the mapping between sensors and vibration motors iseasily The building blocks of our tactile interfaces will be recon-e modules, each of which will consist of up to 16shaftless coin-type vibration motors (See Figure 1) - this isthe maximum number that can be driven using Pulse WidthModulation (PWM) by a Texas Instruments TLC5940 chip.Modules can be daisy chained and driven by a single Arduinomicrocontroller. The motors will attach to garmentsusing velcro so that their spatial arrangement can be changedquickly. The modules can mediate between behaviourand different environment energies simply by changing thesensors that are connected to the microcontroller. The mappingbetween the sensors and the vibration motors can bed in software, as can interactions between the sensors(for example, we could implement lateral inhibition).This exibility will allow us to rapidly e differentmappings between sensorimotor contingencies and explorethe conditions under which the interface becomes transparentor remains opaque.EvaluationWe plan to carry out the evaluations using a qualitative casestudy approach with a small number of participants. Ongoing interviews and informal tests of performance will beconducted to investigate participants’ phenomenal experienceof using the technologies and to explore whether performances might result. Findings from the empiricalstudies will be used to inform theoretical models as well asdevelop predictions about particular sensory extension systems.EMPIRICAL STUDIESWe plan to build and test the three sensory extension systemssummarised in Table 1 which details: where the tactile interface will be placed on a user’s body the number of tactile modules and vibration motors the type of sensors connected to the system the motor actions that are mediated by the tactile interface- what is the system for? the initial mapping between the sensors and each tactilemodule3
Prototype Location of No. of Sensor Motor Initialtactile interface tactile sensor contingency contingency mappingmodules and sensorsTactile Car Seat Back 1 (6) Ultrasound Sense close topographictargetsFeel the Force Waist 1 (8) Virtual Localize target topographicExploring Harmony Back 3 (48) Pitch Harmonic topographicSpaceimprovisationTable 1. A comparison of the three prototype devices that we are planning on building with our e tactile interfaceTactile Car SeatWe propose to design a car seat that will provide the driverwith a direct perceptual representation of objects in closeproximity to the vehicle. We will use an array of 6 vibrationmotors driven by the activation of 6 ultrasonic sensorspositioned on each side of the car at the front, middle andrear. The intensity of vibration will correspond to the proximityof objects to the associated sensor. We predict that withpractice this information might improve drivers’ situationalawareness and increase vehicle safety. This is an importantgoal: approximately 50000 reports on road accident injuriesor fatalities in the UK in 2005 listed failure to look properlyas a contributing factor to the accident and approximately1500 listed failure to see due to the vehicle blind spot [16].The idea of using tactile representations of information ina car is not a new one. Ho, Tan and Spence [7], for example,describe how vibrotactile warning signals can be used toalert drivers to dangers on the road. However, these systemsare designed to be attention grabbing and present informationonly at critical moments. We predict that presenting tactileinformation continuously through the car seat might increasethe driver’s feeling of connection to the car. In certainsituations this could be advantageous, for example, enhancinga driver’s ability to judge whether the car might t intoa tight parking space.We will test the prototype interface using two ‘quick anddirty’ evaluation methods, neither of which will require aperson to drive a real car. This is to avoid the heavy developmentoverheads associated with designing for a real vehicleor complex high-end driving simulator. Firstly we will usethe tactile interface to play ‘blind man’s buff’ games wherea blindfolded user seated in the lab has to detect the approachof people; and secondly, we will employ a Wizard-of-Oz approachlinking movement in an off-the-shelf PC driving simulatorwith activation of the vibration motor module. Whileobviously very different from driving a real sensor augmentedvehicle, these evaluation methods will enable us torapidly gauge the potential of this interface to guide actionand under what conditions it becomes transparent.Feel the ForceThis playful empirical study is inspired by the scene in StarWars Episode IV: A New Hope where Luke Skywalker isgetting his t training in the Force on the Millennium Falcon.He is wearing a helmet with an opaque visor that preventshim from seeing a g robot that moves around himand occasionally zaps him with an electric shock. He has to‘feel the Force’ in order to sense the position of the robotand block its zap with his light sabre.Each user will wear a cummerbund containing 8 equallyspaced vibration motors (45 degree separation). The user’s‘light sabre’ will consist of a Wii nunchuk connected toan Arduino microcontroller. Users will start in a ‘registration’position and then the system will track their movementsusing the 3 axis accelerometer in the nunchuk. The aim ofthe game is to move the nunchuk so that it blocks zaps froma virtual robot. Its movement will be indicated by changes inactivation across the array of vibration motors. A zap occurswhen the robot gets closer, indicated by an increase in vibrationintensity. If a user responds to this increase by movingthe nunchuk to the correct position then they will get forcefeedback from a vibration motor attached to the nunchuk,indicating that they have blocked the zap; if they move tothe wrong position then a number of vibration motors in thecummerbund will vibrate indicating they have been ‘hit’.We will measure how long it takes users to become cient in blocking zaps. If combined with interviews, then onemight be able to determine whether transparency, if achieved,is signalled by performance level. We can map any ofthe locations in virtual zap space to the vibration motors andexplore how different mappings affect users’ performance.We predict that the topographic representation, where adjacentvibration motors map to adjacent locations in space,will facilitate the best performance.Exploring Harmony SpaceWe plan to develop a system that uses Holland’s HarmonySpace system [8, 9] to provide a tactile spatial representationof harmonic structure to musicians learning to impro-4
vise. Beginning improvisers typically get stuck on ‘noodling’around individual chords from moment to moment andare unable to interact meaningfully with the strategic, longerterm harmonic elements, for example, chord progressionsand modulations, which are typically essential to higherlevelstructure in western tonal music, including jazz andmuch popular music.Harmony Space draws on cognitive theories of harmonicperception, providing consistent uniform spatial metaphorsfor virtually all harmonic phenomena, which can be translatedinto spatial phenomena such as trajectories, whoselength, direction and target all encode important information.Thus, Harmony Space enables numerous harmonic relationshipsto be re-represented in a way that may be morecognitively tractable.We will use the Harmony Space representation to providemusicians with a tactile representation of the harmonic relationshipsof music they are currently playing. This will beachieved by having the musicians wear a vest with a 6x8 arrayof tactile actuators where each actuator will represent anote that the musician is playing. The notes will be identi-d directly in the case of electronic instruments, or sensedusing microphones and pitch trackers in the case of acoustic(monophonic) instruments. We predict that representingpitch movement in this way will facilitate the developmentof a spatial understanding of musical relationships, whichwill transfer to improved performance in a wide variety ofmusical tasks, including improvisation. We will investigatewhether performance is linked to the interface becomingtransparent.CONCLUSIONThe E-Sense project is taking an interdisciplinary approachto investigating the extended mind, in particular the natureof sensory augmentation. We will use a rapid prototypingapproach to build 3 novel tactile interfaces that mediate differentsensory modalities (ultrasound, pitch and ‘virtual’ location).As well as testing the practical utility of these systems,we hope to gain more insight into the conditions underwhich technologies become transparent as well as gathermore evidence for the theoretical viability of the sensorimotorcontingency model.ACKNOWLEDGEMENTSThis research is supported by the Arts and Humanities ResearchCouncil grant number: AH/F011881/1.REFERENCES1. Bach-y-Rita, P. Brain Mechanisms in SensorySubstitution. Academic Press, NY, 1972.2. Arduino electronics prototyping platformhttp://www.arduino.cc/Retrieved June 20083. Bird, J., d’Inverno, M. and Prophet, J. Net Work: AnInteractive Artwork Designed Using anInterdisciplinary Performative Approach. DigitalCreativity, 18 (1), (2007), 11–23.4. Bird, J., Stokes, D., Husbands, P., Brown, P. and Bigge,B. Towards Autonomous Artworks. LeonardoElectronic Almanac, (forthcoming).5. Clark, A. Natural-Born Cyborgs: Minds, Technologiesand the Future of Human Intelligence. OxfordUniversity Press, NY, 2003.6. Heidegger, M. Being and Time. Harper and Row, NY,1962.7. Ho, C., Tan, H. Z. and Spence, C. Using spatialvibrotactile cues to direct visual attention in drivingscenes. Transportation Research Part F: TrafPsychology and Behaviour, 8, (2005), 397–412.8. Holland, S. l Intelligence, Education andMusic. PhD thesis, IET, The Open University, MiltonKeynes. Published as CITE report No. 88, 1989.9. Holland, S. Learning about harmony with HarmonySpace: An overview. In M. Smith and G. Wiggins,(Eds.) Music Education: An l IntelligenceApproach. Springer Verlag, London, 1994.10. Kohler, I. The formation and transformation of theperceptual world. Psychological Issues, 3, (1964),1-173.11. LilyPad sewable electronic componentshttp://www.cs.colorado.edu/ buechley/LilyPad/index.htmlRetrieved June 200812. Maravita, A. and Iriki, A. Tools for the Body (Schema)Trends in Cognitive Sciences, 8, (2004), 79–86.13. O’Regan, J. K. and Noë, A. A Sensorimotor Account ofVision and Visual Consciousness Behavioral and BrainSciences, 24(5), (2001), 939-73.14. Processing programming language and environmenthttp://www.processing.org/Retrieved June 200815. Ramachandran, V. S. and Blakeslee, S. Phantoms in theBrain: Probing the Mysteries of the Human Mind.Fourth Estate, London, 1998.16. Robinson, D. and Campbell, R. Contributory Factors toRoad Accidents Transport Statistics: Road Safety,Department for Transport, 2005. http://www.dft.gov.uk/Retrieved June 200817. Rogers, Y. and Muller, H. A Framework for DesigningSensor-Based Interactions to Promote Exploration and International Journal of Human-ComputerStudies, 64 (1) (2005), 1–15.18. Rogers, Y., Scaife, M. and Rizzo, A. Interdisciplinarity:an Emergent or Engineered Process? In S. Derry, C. D.Schunn and M. A. Gernsbacher (Eds.) InterdisciplinaryCollaboration: An Emerging Cognitive Science. LEA,(2005), 265–286.19. Stratton, G. M. Some preliminary experiments ofvision without inversion of the retinal image.Psychological Review, 3, (1896), 611-617.5
SocialSense: A System For Social Environment AwarenessRobert S. Brewer, Samuel R. H. Joseph, Guanghong Yang, Neil Scott, Daniel SuthersUniversity of HawaiiUbiquitous Wireless Applications GroupLaboratory for Interactive Learning TechnologiesDepartment of Information and Computer Sciences1680 East West Road, POST 309Honolulu, HI 96822, USArbrewer@lava.netABSTRACTSocialSense is a system designed to provide additionalsocial information about nearby people. SocialSense detectsBluetooth devices and uses them to infer the presence ofparticular people, pulling their profiles and status fromonline social networking sites. SocialSense differs fromexisting mobile social awareness systems by integratinglive feeds from multiple sources. Information is shown tothe user via a head-mounted display, and the user controlsthe system using buttons mounted on a ring input device or“Magic Ring”. The aim is a system that can be usedunobtrusively, allowing users to go about face-to-faceinteractions in a normal manner.Author Keywordssocial networking, wearable computer, presence sharing.ACM Classification KeywordsH.5.3 [Information Interfaces And Presentation (e.g.,HCI)]: Group and Organization Interfaces — CollaborativecomputingINTRODUCTIONAs people go about their lives, they pass through spacesfilled with other people. They will interact with some ofthese people, but most will be passed by withoutinteraction. One barrier to interaction is unfamiliarity:people are less likely to talk to a stranger they don’t knowanything about. There is also forgetfulness, such asremembering someone’s face but forgetting their name,organizational affiliation, and interests.This paper describes a system called SocialSense thatallows users to be more aware of the social background ofCopyright is held by the author/owner(s).<strong>UbiComp</strong> '08 Workshop W1 -- Devices that Alter Perception (DAP 2008)September 21st, 2008This position paper is not an official publication of <strong>UbiComp</strong> '08.people in the environments they inhabit. SocialSense allowsthe user to explore the profiles and status information ofnearby people who have agreed to participate in the system.Profiles are retrieved from an online community site, whilestatus comes from the Twitter microblogging service [14].Twitter status information consists of a message of up to140 characters, similar to mobile SMS messages, andprovides a potentially dynamic snapshot of a person’scurrent thoughts or activities. The current prototype scansfor nearby Bluetooth devices as a proxy for the people inthe user’s vicinity. The profiles are shown to the user via ahead-mounted display (HMD), and the user controls thesystem using buttons mounted on a ring input device or“Magic Ring”. We see the combination of technologies inSocialSense as particularly important. The HMD allows usto display profile icons in the user’s peripheral vision to beattended to or ignored based on the user’s wishes, as in theeye-q system [3]. The Magic Ring is a deliberately simpleinput device, designed to allow users to navigate the userinterface as easily as possible. While the currentSocialSense prototype is quite bulky, we aim to develop asystem that can be used unobtrusively, which is importantfor a system designed to aid social interactions.For example, a SocialSense user could be walking througha University courtyard filled with people on their way tolunch. As the user is walking, a thumbnail picture of acolleague appears at the edge of their field of view,indicating that the person is nearby. Without thisnotification, the user might not have noticed the presence ofthe colleague. Picking them out of the crowd, the userapproaches the colleague and asks if they are free for lunch.As they walk to lunch, the user can see their colleague’smost recent Twitter status update regarding a papersubmission to an upcoming conference. The user is alsogoing to that conference, potentially providing a fertiletopic for lunchtime conversation.RELATED WORKSocialSense brings together research on location-basedsocial networking systems and alternative input devices.66
Location-based Social Networking SystemsSocial network services such as MySpace and Facebookallow users to create profiles for themselves, such asuploading a picture and specifying friendship links withother users. Commercial systems for mobile and locationbased social networking services make use of self-reportedlocation (e.g., SocialLight), GPS (e.g., Loopt), andBluetooth (e.g., MobiLuck) in order to leverage locationand context specific social information. All Bluetoothdevices are capable of ‘device-discovery’, which allowsthem to collect information on other Bluetooth deviceswithin 5-10 meters [5]. This information includes a uniqueBluetooth MAC address (BTID), device name, and type.The BlueAware system [5] runs in the background onMIDP2-enabled phones allowing them to record andtimestamp BTIDs in a proximity log and making themavailable to other applications. Researchers have been usingthe BTID patterns to analyze and predict relationshipsbetween users and organizational rhythms [5, 13].Bluscreen is a public advertising system [16] that detectsusers via their Bluetooth devices and has advertising agentsbidding for screen time. Commercial social networkingsystems such as MobiLuck allow mobile phones to detectall nearby Bluetooth devices, ringing or vibrating whenfound, supporting message and photo exchange.WirelessRope also uses Bluetooth and supports contactbetween groups of colleagues at a conference [11]. TheJabberwocky system [12] investigates the “familiarstranger” concept of people who have seen each other inpublic places on multiple occasions but have never met.The Jabberwocky devices log Bluetooth IDs and no centralserver is involved, unlike SocialSense.These systems give us a feel for the possibilities ofconsumer devices in the mobile social networking field. Inaddition, there have been many custom social networkingapplications developed in the wearable computing fieldincluding the infamous lovegety [8], GroupWear [2],Smart-Its Friends [7], nTag, and SpotMe. Particularlyinteresting is the development of systems that incorporategestural language. For example, iBand [9] is a socialnetworking device that creates connections between twousers when they shake hands.Input DevicesEffective interaction technology is also important whenusing a head-mounted display and there have been anumber of gesture-based interfaces developed includingUbi-finger [17], GestureWrist [15], FingeRing [6], andTwiddler (http://www.handykey.com/). There have beenseveral input devices developed in a ring form factor.FingerSleeve [18] has a six-degree-of-freedom tracker, withwhich you have ability to sense all movement, andtranslation and orientation changes. However, it is unsuitedfor our application because of its size and wire connection,and because SocialSense does not require that level oftracking functionality.Figure 1: SocialSense user interface, showing anabbreviated profile (redacted for privacy)PROTOTYPE DEVELOPMENTSocialSense consists of a computer with a Bluetoothadapter that continuously scans for nearby Bluetoothdevices. For each Bluetooth device discovered, it contacts aserver to see if there is a profile associated with the BTIDof the discovered device. If a profile is found, theinformation is downloaded and added to a list of nearbydevices. In addition, if there is a Twitter account associatedwith the profile, the latest status message is retrieved.Devices that are not associated with a profile are alsodisplayed, but the only information that can be displayed isthe name that the device provides (which can sometimes behelpful, such as “Adam Smith’s iPhone”) [10].Software ImplementationThe SocialSense client is written in Java. This decision wasmade early on because Java allows for cross platformdevelopment and deployment. Of particular note is theavailability of a cross-platform specification for usingBluetooth with Java, known as JSR 82(http://jcp.org/en/jsr/detail?id=82).The user interface is simple by design. It displays thedetected users by name and thumbnail image on the righthand side, and the currently selected profile in the center.Log messages are displayed at the bottom of the windowshowing the status of Bluetooth scans and any errorsencountered. Figure 1 shows the user interface.The interface uses white text on a black backgroundbecause on some optical see-through HMDs black istransparent thus avoiding unnecessary occlusion of the realworld.To select a device, the user shifts the selection up and downin the list. Moving the selection off the top or bottom of thelist causes the profile area to be cleared, allowing the userto focus on his or her physical environment instead of theinterface. When a person is selected, that person’sabbreviated profile is displayed, showing their name,picture, phone number and Twitter status. The user can thentoggle between an extended profile that displays theperson’s full bio and the abbreviated profile.77
Currently the server side of SocialSense is implemented inRuby on Rails as part of the larger disCourse onlinecollaboration system. The ability to associate BTIDs withan individual was added to the existing disCourse profilesystem. The SocialSense client makes a HTTP request (viaWiFi) containing each BTID discovered to the server. Ifthere is a profile associated with a BTID, the server replieswith a XML document containing the profile contents,which is then parsed by the client. If the profile has anassociated Twitter account, the latest ‘tweet’ is retrievedfrom Twitter.HardwareThe SocialSense prototype runs on a Samsung Q1 UMPC(Ultra Mobile PC). UMPCs are like miniaturized laptops,but they run full versions of Windows. The Samsung modelhas built-in Bluetooth, WiFi, 2 USB ports, and a VGA portfor connecting to the HMD.We initially used the LitEye LE-750, which is an opticalsee-through device, for the HMD, but found it too bulkyand unsuited for social computing applications. We settledon the Creative Display Systems i-Port as a less obtrusivedisplay. The i-Port consists of a modified pair of Oakleysunglasses with the display mounted onto the right handside. Unlike the LitEye display, the i-Port is not an opticalsee-through HMD so it does partially occlude the right eye,but it does not occupy the user’s full field of view so itallows some situational awareness.For input to SocialSense, we developed a “Magic Ring”device to match the simplicity of the user interface. TheMagic Ring consists of three small buttons attached to ametal ring, which is attached by wires to a wrist-mountedcontroller and battery. The wrist-mounted devicecommunicates wirelessly to the receiver module, whichattaches to the UMPC via a USB cable. The receivermodule appears as a keyboard to the UMPC, and the threebuttons send the keystrokes for up arrow, Enter, and downarrow respectively. We are working on an evaluation of theMagic Ring compared to other input devices for commonnavigation tasks. Figure 2 shows a picture of the device.Figure 2: Magic Ring input deviceFigure 3: SocialSense hardware being wornFUTURE WORKThe SocialSense system is still in an early prototype phase,and although we have a working prototype, there are manyways in which it could be improved.UnobtrusivenessSignificant work is still required before the system can beconsidered unobtrusive. The head-mounted display isprobably the most difficult hurdle towards unobtrusiveness.Current displays are simply too bulky and obvious. Whilethere are many companies working on technologies thatthey claim will be tiny and practically invisible, only timewill tell if these displays live up to the manufacturers’claims.It may be some time before we can develop a system thatcan be truly unobtrusive. An alternative approach would beto develop a version of SocialSense for a mobile device likethe Apple iPhone. Such a device would be relativelyunobtrusive, but it would require a way to make the useraware of nearby people. Given the near ubiquity ofBluetooth headsets, one option would be to have the mobiledevice “whisper” in the user’s ear when someone enteredtheir social space, at which point the user could browseprofiles on their mobile device if they wished to.Beyond ProfilesWhile profiles from social networking sites can be usefulsnapshots of a person’s identity and interests, they can growstale if the user does not update them. Updating one’sprofile does not provide any direct benefit to the userupdating the profile; it only helps others. However, thereare other sources of data that we can display such blogposts, or FaceBook updates. These information sources, likeTwitter, could provide a more up to date indication of whatis relevant to the person in question.The system could even display email messages from thedetected individuals that had been sent to the SocialSenseuser. Such a feature could be very helpful in making sureconversations with colleagues didn’t require repetitiveexplanation of unread emails.88
PrivacyWith any social networking application, privacy issues arecrucial and this is especially true in a mobile wirelessenvironment. The SmokeScreen system [4] allows users toengage in presence-sharing using Bluetooth IDs or WiFiMAC addresses, but provides privacy management usingcryptography. SmokeScreen provides a method forpresence sharing between strangers using a centralizedbroker service. Privacy controls can also be on the serverside where the user profiles are stored; allowing users todisplay only limited profile information to users not on their‘buddy list’. The server could also record who retrieved aprofile, providing awareness to those being looked up.Critical for privacy is making sure that SocialSense is “optin”,i.e. you decide if you want to share your profile andwho you want to share it with.Augmented RealityAzuma and colleagues [1] define an augmented reality(AR) system as one that combines real and computergeneratedinformation in a real environment, interactivelyand in real time, and registers virtual objects with physicalones. A future AR-enabled version of SocialSense couldmake the retrieved profiles appear to float above peoples’heads from the perspective of the user wearing the HMD.This would make it obvious who the profiles referred to,but such a feature would require significant advances in ARtechnology to be practical.CONCLUSIONWe have presented SocialSense, our application forproviding context to social situations by sensing Bluetoothdevices and displaying nearby user profile and statusinformation. We have developed a prototype using a HMDand the custom Magic Ring input device. The prototypeworks, but is too cumbersome for routine use. We believethat in time it may be possible to develop an unobtrusiveversion that displays helpful information about nearbypeople and we have mapped out several areas for futureresearch.REFERENCES1. Azuma, R., Baillot, Y., Behringer, R., Feiner, S., Julier,S., and MacIntyre, B. Recent advances in augmentedreality. IEEE Computer Graphics and Applications 21, 6(2001), 34–47.2. Borovoy, R., Martin, F., Resnick, M., and Silverman, B.(1998) GroupWear: nametags that tell aboutrelationships. In CHI 98, ACM (1998), 329-330.3. Costanza E., Inverso S. A., Pavlov E., Allen R., MaesP., eye-q: Eyeglass Peripheral Display for SubtleIntimate Notifications. In Proc. of MobileHCI 2006,(2006), 211–218.4. Cox, L. P., Dalton, A., and Marupadi, V. SmokeScreen:flexible privacy controls for presence-sharing. In Proc.MobiSys '07. ACM (2007), 233-245.5. Eagle N. & Pentland. A. S. Reality mining: sensingcomplex social systems. Personal UbiquitousComputing 10, 4, (2006), 255–268.6. Fukumoto, M. and Tonomura, Y. Body coupledFingeRing: Wireless wearable keyboard, In Proc. CHI97, ACM (1997), 147-154.7. Holmquist L.E., Mattern F., Schiele B., Alahuhta P.,Beigl M. & Gellersen H.-W. Smart-Its Friends: ATechnique for Users to Easily Establish Connectionsbetween Smart Artefacts. Proc. Ubicomp, (2001), 116-122.8. Iwatani, Y. Love: Japanese Style. Wired News, 11 Jun1998.9. Kanis M., Winters N., Agamanolis S., Gavin A., andCullinan C. Toward Wearable Social Networking withiBand, In CHI 2005, ACM Press (2005), 2–7.10.Kindberg, T., Jones, T. “Merolyn the Phone”: A Studyof Bluetooth Naming Practices. Ubicomp 2007 InLecture Notes in Computer Science 4717 SpringerBerlin (2007), 318-335.11.Nicolai T., Yoneki E., Behrens N. & Kenn H. ExploringSocial Context with the Wireless Rope. In Int’lWorkshop on MObile and NEtworking Technologies forsocial applications, 2006.12.Paulos, E. and Goodman, E. 2004. The familiarstranger: anxiety, comfort, and play in public places. InProc. CHI 2004. ACM (2004), 223-230.13.Perkio J., Tuulos V., Hermersdorf M., Nyholm H.,Salminen J. and Tirri H. Utilizing Rich BluetoothEnvironments for Identity Prediction and ExploringSocial Networks as Techniques for UbiquitousComputing. In Proc. IEEE/WIC/ACM Int’l Conf. onWeb Intelligence, IEEE (2006), 137-144.14.Pontin, J. From many tweets, one loud voice on theInternet. The New York Times, April 22, 2007.15.Rekimoto, J. GestureWrist and GesturePad: UnobtrusiveWearable Interaction Devices, In Proc. Int’l Symposiumon Wearable Computers, IEEE (2001), 21-27.16.Rogers, A., David, E., Payne, T. R., and Jennings, N. R.2007. An advanced bidding agent for advertisementselection on public displays. In Proc AutonomousAgents and Multiagent Systems, ACM (2007), 1-8.17.Tsukada, K. and Yasumura, M. (2002) Ubi-Finger:Gesture Input Device for Mobile Use. In Proc. APCHI2002, 388-400.18.Zeleznik, R. C., LaViola, J. J. Jr., Feliz, D. A., andKeefe, D. F. Pop Through Button Devices for VENavigation and Interaction. In Proc IEEE VirtualReality, IEEE (2002), 127-134.99
Boxed EgoAlvaro CASSINELLI and Masatoshi ISHIKAWAUniversity of Tokyoalvaro@k2.t.u-tokyo.ac.jpABSTRACTBoxed Ego is a double trap for the Self. A peep-show boxwaiting in a corner of the exhibition space first captures thecuriosity of the observer - and then the observer himself. Althoughof an artistic flavor, from the research perspectivethis work is a preliminary experiment on the cognitive (andpossible practical) aspects of artificial autoscopy (AS). In orderto understand how artificial autoscopy can generate anout-of-body experience (OBE), we embrace the enactive approachto perception [1] and we further hypothesize that thesense of self, may be itself a second-order perceptual experience:that resulting not from the exploration of the worldbased on skillful mastery of the visual, tactile, proprioceptiveor auditive sensorimotor contingencies (SMCs), but onexploring/acting on the world with skillful mastery of theseSMC as well as the rules governing the relations (extendedin time) between these SMCs. A first corollary of this hypothesisis that there may be different senses of self: at oneextreme, those inextricably linked to each primal sense (andthus experientially ineffable), and at the other extreme, amore abstract sense of self that result from the knowledge ofcross-modal contingencies. In between, there may be experiencesrendering a more or less unified sense of self, which isprecisely why this model seems to us ideal to explain OBEs.A second corollary of this view, is that attentional blindnessmay also pertain to the sense of self, a testable hypothesis.Author Keywordstelexistence, out-of-body, autoscopy, self-awarenessACM Classification KeywordsH.5.1 Multimedia Information Systems — Artificial, augmented,and virtual realities,H.5.2 User Interfaces — User/Machine SystemsINTRODUCTIONThat language and consciousness are inextricably interrelatedis not a coincidence since language is a more or lessnatural formalization of conceptual reasoning, playing a crucialrole in the process of self-representation and subjectiveconsciousness [2]. But language alone is not sufficient andsurely not even indispensable in order to provide organismself-awareness. How can someone/something incapable ofdescribing knowledge of his/its internal states (even to oneself/itself)be capable of self-awareness? The paradox disa-Copyright is held by the author/owner(s). <strong>UbiComp</strong> ’08 Workshop W1 –Devices that Alter Perception (DAP 2008), September 21st, 2008.This position paper is not an official publication of <strong>UbiComp</strong> ’08.pears if one consider that ’description’ (internal or external)does not need to be propositional, but can be enactive [3].With this remark in mind, we will leave aside the problemof language-based self-reference, and concentrate instead onenactive forms of self-awareness (as a passing remark, let’snote that the ineffable character of enactive knowledge maybe responsible for the ineffable part of the sense of self).For one, vision plays a fundamental role in the generationof an egocentric perspective on the world; visual artists havebeen experimenting in this arena well before science createdthe right tools or even the proper language capable to describesuch phenomena. Self-referential pictures have beenaround from ten of thousands of years, and artificial mirrorsare thousands of years old; however, it’s the invention ofmagnetic recording and closed loop video that opened reallynew exploratory possibilities. ’Present Continuous Past(s)’by Dan Graham (1974) is perhaps one of the first interactivevideo-art installations challenging the special vantage pointof the audience, and transforming the spectator into its ownobject of observation. Time delay is purposely used to trickthe spectator into the belief that he is seeing a pre-recordedscene unrelated to himself, but then he would slowly gainunderstanding of his central role in the piece. This calculatedspatio-temporal disembodiment brings confusion: aswith the Necker cube, the perceptual content is of flippingnature: that of the filmed person being someone else or beingoneself. Only very recently these experiments were reproducedin a controlled environment [4]. In this workshop,I would like to foster an informal discussion about the scientific,practical (and of course artistic) potential of this kind ofexperimentation by describing a media-art installation called’Boxed Ego’ [5].10
BOXED EGO INSTALLATIONA pair of cameras are aimed towards a small platform on acorner of the exhibition space over which sits a cubic peepshowbox. The holes of the peep-box are in fact the eyepiecesof a live-stereoscope. The separation of the videocameras in real space is set to about ten times the real interoculardistance, so that the viewer will see a ten times scaleddownversion of himself inside an equally miniaturized exhibitionspace (hyperstereo effect). The box appears empty;however, if the observer talks or breathes, the box readilydetects this human prey and traps it in its interior, effectivelytransforming the observer into its own object of observation.Indeed, a dwarfed, truly three-dimensional versionof the observer (peering inside an even smaller box)will slowly materialize (figure 1). Perhaps the main differencebetween Boxed Ego and other works featuring artificialautoscopy (either in the Media Arts or in the field of experimentalpsychology [4]) is that (1) the object/subject is perceivedtruly in 3d, although miniaturized (thus combiningautoscopy with micropsia, which are both phenomena thatcorrelate somehow in the medical literature ; (2) the spectatoris filmed from behind, and without a time delay it becomesimpossible for him to see his own face (this makesthe experience very different from that of a mirror or a cameraon top of a screen, reminding us of Magritte’s famouspainting ’La reproduction Interdite’); (3) there is a limitedform of correlated tactile feedback (the spectator can graspthe box and see himself grasping it, while at the same timefeel the real box his hands); (3) lastly, although not sufficientlycompelling in this experiment, the suggested infiniterecurrence of observer-observers could potentially generatea sense of multiple body relocation (see below).The idea behind this installation was to explore, in an artisticway, the links between curiosity and voyeurism. Whilepeering inside the box, one can see oneself in every detail,and to a certain extent play with one’s own avatar (in particularthanks to some time delay in the video loop). At thesame time, one cannot see the other people in the exhibitionspace (see video in [5]). The installation was exhibited for aweek at SonarMatica Media Art festival in Barcelona (2008)with much success. A commentator later reasoned that thiscould be because ’the theme of self-voyeurism is unsurprisinglyvery popular with the festival goers.’ We agree withthis remark (after all, even a simple mirror always retainssome magic), but the question remains open: why are weso attracted by these devices? Of course there is a practicalaspect to the experience (e.g. tighting your necktie); however,we hypothesize that there is more to this: this sort ofsetup brings us close to an out-of-body experience which isinteresting per se: it give our minds the opportunity to betteritself in the mastery of the sensorimotor contingencies in anunusual territory.THE OUT-OF-BODY EXPERIENCEOut-of-body experiences (OBEs) are a culturally invariantneuropsychological phenomena that can take a variety ofdifferent forms, ranging from seeing one’s own body froman elevated visuospatial perspective (the placement of thestereo cameras in the Boxed Ego installation tries to cap-Figure 1. Stereo pair as displayed inside the box (without optics)ture this) to the less known ’heautoscopic’ hallucination,consisting on perceiving a duplicate of ones body in extrapersonalspace [6]. Although the etiology of the OBEsvaries widely (organic dysfunctions such as epilepsy, sleepparalysis,psychological disorders or traumatic experiencesbut also episodes without a know trigger), direct electricalstimulation of the cortex in pre-operatory brain surgeryfor intractable epilepsy as well as less invasive experiments(trans-cranial electrical or magnetic stimulation [7]) andfMRI performed during paroxystical hallucinations, all pointto the involvement of a very specific area in the brain,namely the temporo-parietal area [6].Complete distal attribution and OBEIt is interesting to note that although classical OBE implywhole visuospatial relocation in space, it is also possible tohave relocated parts of the body. This partial relocation isa relatively common occurrence described in the medicalliterature [9], but also easily reproducible on healthy subjects[10]. It may be argued that ’relocation’ of sensation isa normal way of functioning of the sensory-motor apparatus:for any practical purpose, it must feel like the sensationis precisely located at the site of stimulation (e.g. on the tipof our finger), instead of, say, inside the head. We alwaysfeel located sensations, and in particular located in a part ofthe world that we perceive as ’ours’. Distal attribution isthe technical term for a very common phenomena, that ofsituating the stimulus where the action responsible for it istaking place - even if this part is extracorporeal. That’s whywe feel the texture of paper at the end of the pen, not onyour fingers where the force is actually sensed. Distal attributionis exploited in robotic telexistence systems (the usercan operate the robot on the same room, or be in another continentfor that matter). However, there seems to be a thresholdof sensory immersion and sensory-motor correlation thatwhen reached, transforms the fairly common experience describedas distal attribution into something qualitatively different:it elicits a sense of presence in extracorporeal space.It is therefore tempting to see OBEs as the consequence ofa full body relocation in which the experiencer can still seehis original body (an experience with an entirely differentphenomenology).11
SENSE OF PRESENCE: A SENSORIMOTOR ACCOUNTAn ineffable sense of selfAs noted in [1], a subset of the ’apparatus-based’ sensorimotorcontingencies (SMCs) relevant to the sense of visionmay derive from sensorimotor laws relative to an ’observeroriented coordinate system’. Learning these laws would providethe system with a rudimentary (enactive) notion of self.For instance, objects (or other people) generate stimuli thatcan be removed and put back into the visual scene, whilesensation about one’s own body is always potentially available.Furthermore, some parts of the perceived environmentcan be controlled at will (i.e. in a manner independent to themotion of the sensory apparatus) while others not (e.g. wedon’t need to look away in order to hide our own hand). Wecan generalize this claim as follows: things that are not ourselvesgenerate stimuli that can be removed or put back intothe visual, auditive or tactile scenes, while our own bodygenerates stimuli (including this time proprioceptive information)that cannot be so easily removed. Therefore a senseof self-location is brought by active exploration of the worldwith (implicit, practical) knowledge of the structure of egocentricsensorimotor contingencies. (If the observer was notphysically located in a particular place in space, these sensorimotorcontingencies would be of a very different nature;perhaps one day a robot with pervasive sensors and actuators- like HALL9000 supercomputer from ’2001: SpaceOdyssey’- will tell us what it’s like to have an ubiquitoussense of self).Sensorial awareness and sense of selfSMCs determined by the character of the ’sensory apparatus’would roughly correspond to the crude character of ’sensation’,while those related to the character of the exploredobjects would form the basis of ’perceived content’ [1]. Inother words, awareness of the character of the experience(is it visual, auditive or something else?) as well as understandingof its content (for the purpose of thought, planningand speech behavior) may be worked out by a concurrentneural mechanism responsible of recognizing and analyzingeach particular pattern of SMC. In fact, there may be differentlevels of ’understanding’ (each more or less accessibleto consciousness). At the top of the hierarchy, we may haveabstract knowledge relative to the occurrence of some formof sensory experience, as long as the SMC has some recognizable,familiar structure (perhaps learned late in life). Inother words, we may be aware of being experiencing somethingwithout paying attention to the actual content of theexperience. This could contribute to (or even form) a senseof self: if while actively exploring the world, familiar patternsof SMCs appear, then you may not only experiencesomething, but you may experience being a Self experiencingthat; if, on the other hand, you fail to recognize any patterns,then you may not just be sense-blind: you may noteven experience being someone at all.IDEAS FOR EXPERIMENTS AND PRACTICAL USESAltering in a controlled way the SMC pattern for a particularsensorial modality may be more or less easy to achieve (theinverted-glass experiment [11] is a classic example). However,altering in a controlled way all the sensorimotor contingenciesas well as their inter-relations (including time correlations)may be more difficult to do. To start with, the alteringdevice should be multi-modal. An immersive virtualreality environment could be an ideal setup, but the technologyfor haptic and proprioceptive actuators is not nearly asdeveloped as auditory or visual displays. For example, whileit is easy to set an inverted vision experiment, it is not so easyto conceive –left alone design– a setup for ’inverted haptics’:it would mean for instance than when touching somethingwith my right hand, I would feel the object on my left hand.Attentional self-ness for human computer interfacesAnother interesting consequence of this view is that it shouldbe possible to apply the same principles behind attentionalblindness (i.e. experiential blindness while retaining sensation)and induce attentional self-ness. It turns out that thismay be a normal occurrence in everyday life: we do performrepetitive tasks automatically, sometimes without even registeringin memory the fact that we did them. (In a sense, weare all philosophical zombies from time to time.) However,it would be interesting to be able to control this, perhaps inorder to reduce cognitive load from tasks that can be doneby a machine and don’t need attention from part of the user.Medical ApplicationsThe temporo-parietal junction seems to be the common lesionsite in patients suffering from disturbances of the egocentricspatial-relationship with extrapersonal space (a conditionalcalled visuospatial neglect). This is not surprisingif we believe the results reported in [8]: this region is infact very involved in the real-time integration of proprioceptive,tactile, visual and vestibular sensory input, generatinga three-dimensional, dynamic representation of the body inspace. Therefore, one can wonder if artificially manipulatingthese inputs may lead to some degree of control over theway the body is represented in space, for therapeutic or atleast for palliative care. An example related to this may bethe ’revival’ of phantom-limbs for the purpose of treating associatedpain [9]. Another interesting possibility may be thetreatment of higher cognitive dysfunctions, such as dissociativeidentity disorders; indeed, it has been found that OBEscorrelate in people with these disorders [8]. In short, we hypothesizethat the availability of a machine through whichone is capable of artificially creating and manipulating autoscopicimagery may render a sense of control over otherwisecontradictory or poorly organized sensorimotor feedback.Super mirrors?Perfectly reflecting surfaces capable of creating an image indistinguishablefrom reality is a relatively recent human inventionthat can be traced back to the first century AD [12].Yet it was a luxury object; Modern ubiquitous mirrors area much more recent invention Therefore one should be surprisedmore than not about how comfortably we seem to getalong with these artifacts. It is well known that most animalsdo not pass the ’mirror test’, and fall pray once and again tothe illusion of reflexions, so one has the right to wonder ifour getting used to these ubiquitous reflexions is not becauseof an intensive exposure in our daily lives (fun house mirrorsdo make us uncomfortable!). However, since a mirror breaks12
the natural egocentric visuospatial perspective, one can suspectthat their intrusion in the visual field may still disruptthe normal integration of visuospatial information. In fact,researchers have shown that the temporo-parietal region isactivated when one tries to mentally superimpose one’s bodyon a front-facing schematic human figures, while the sameregion is not activated when one observes back-facing characters[8]. It is like the mere idea of seeing oneself from anoutside perspective had a special experiential content – everydaymirrors may not be so innocent after all! Perhaps adevice that could give finer control of this disruption wouldbe more efficient or safer. This remark is particularly importantif one is to consider the use of mirrors on vehicles.A (wearable?) ’autoscopic super mirror’ could display a3d model of the observed/observer as seen from any arbitraryposition in extrapersonal space, and this position couldbe naturally controlled by the user after learning a properlydesigned artificial SMC scheme that would not disrupt thesense of self in a way that is counterproductive or dangerousfor the task at hand. In the future this may be achieved bymounting several cameras and reconstructing the scene froman arbitrary point of view. Uses of this could range from’enhanced mirrors’ for dancers that could see their own bodyfrom any location during rehearsal, to their use on cars, as anenhancement or substitute of the front and rear mirrors (thiscan be achieved by collecting images from street cameras orfrom cameras mounted on other cars, or more simply by usinga unique fish-eye camera could be mounted high on thecar). Research on telexistence systems is solving part of theproblem [13]; indeed, these ’super mirrors’ are autoscopictelexistence systems.CONCLUSION AND FURTHER WORKThe system described in this paper tampers with two of thesensory stimuli that seems directly involved in the constructionof body self-awareness, namely visuospatial input aswell as a limited form of tactile feedback. This experimentdoes seem to generate a mild form of OBE (or at least thefeeling of being in a ’twilight zone’ and that without careone can be induced an OBE - and be absorbed by the box). Amore objective study is needed in order to asses the efficacyof the illusion, but this was not the goal at this stage of theexperiment. In this paper we have deliberately concentratedon a rudimentary notion of the self, one that could accountat least for some form of body self-perception. Borrowingthe terminology of the sensorimotor contingency model, wemay say that being-in-the-body is a way of acting on objectsin the world. OBEs would result from the alteration of normalsensorimotor dependencies as well as cross-modal dependencies.(This view suggests that synesthesia and out-ofbodyexperiences may be co-morbid phenomena, a view forwhich there seems to be some medical evidence [14]). If thisalteration is consistent in time (something that could be donewith the help of ’device that alters perception’ more complexthan a movable mirror for instance), then one can expect thata functional sense of self could be regained once one comesto grips with the new set of artificial SMCs. This may indeedhappens in everyday circumstances. For instance, weusually don’t experience any severe disturbance of the senseof self when looking at a mirror, nor is our self disintegratedwhen playing a first-person shooter game. There may befundamental reasons for that immunity (such that too fewsensorial modalities are involved in these experiments), butit may also be that we have learned enough about these abnormalsituations so as to ’flip’ the whole set of sensorimotorcontingencies, and tune to the one that makes more sense (abistable form of adaptation similar to the one observed inthe limited-time inverted glasses experiment [11]). In anycase, it would be interesting to design a device capable of adeeper alteration (although controlled and consistent) of thewhole scheme of sensory motor contingencies. A first concretestep would be to include some form of synchronizedvisuo-tactile stimulation in our own experiment; however,instead of passive stimulation as in [4], it would be interestingif the participant could be himself at the origin of thestimulation. For example, the box could have an opening fora hand, through which the participant would reach the headof his avatar; at the same time, some actuator would touchthe real head. Another idea would be to set the whole installationon a moving platform that would tilt as the user tiltsthe box in his hands, thus instantiating a form of vestibularfeedback.ACKNOWLEDGMENTThe first author would like to thank Arnaud de Grave,Stephane Perrin and Pablo Gindel for inspiring discussionsthat set the mood for the experiment, as well as to CarsonReynolds for interesting commentaries.REFERENCES1. A. Noe, Action in Perception, The MIT Press (2004).2. D. Dennett, Consciousness Explained, Penguin (1991).3. F. J. Varela et al., The Embodied Mind, MIT (1991)4. H. H. Ehrsson, The Experimental Induction of OBEs,Science, 317(5841): 1048 (2007)5. www.k2.t.u-tokyo.ac.jp/members/alvaro/boxedEgo6. O. Blanke and G. Thut, Inducing OBEs, Ch.26, TallTales about Mind and Brain, (2006)7. CM. Cook and MA. Persinger, Experimental inductionof the ”sensed presence”. Percept. Mot. Skills.85(2):683-93 (1997)8. O. Blanke, OBEs: Psychological and neurologicalcharacteristics, Proc. 5th Symp. of the Bial Foundation.9. Ramachandran, V. S. and S. Blakeslee, Phantoms in thebrain, William Morrow Co. (1998)10. H. H. Ehrsson et al., Touching a Rubber Hand,J.ofNeurosc. 25(45):10564-10573 (2005)11. J. G. Taylor, Behavioral Basis of Perception, Yale Univ.Press, (1962)12. S. M. Bonnet, The Mirror: A History, Routledge (2001)13. K. Watanabe et al., TORSO: completion of egocentrictelegnosis system, SIGGRAPH (2007)14. HJ. Irwin, Correspondence. J Soc Psych Res,51:118-120, (1981)13
Fear tuners – Prostheses for instinctsSusanna HertrichRoyal College of ArtKensington Gore, SW7 2EU, London, UK+44.798.308 7004ABSTRACTThis paper concerns "Fear Tuners", a critical design projectthat was initiated at the Royal College of Art in 2008. In thispaper, I argue that our bodies are equipped with a sensorysystem that only allows us to detect immediate dangers, forexample it helps us to decide where to tread and what to eat.This system though is not suitable to sense the abstract andglobal dangers that occur in our highly complicated world.Fear Tuners brings forward the arguments that people are inneed of tools to help them sense global and abstract dangers.As a response to the problem, this project explores thepotential use of wearable devices as prostheses for thosemissing instincts. The paper suggests using the skin as aninterface to stimulate a physical sensation resulting into amental state of increased awareness, whenever a deferreddanger occurs.which also stand in the tradition of device art. Thisclassification defines artworks that consist of a hardware,which is specifically designed to realize a particularconcept. The functional and visual design aspects of theseobjects make an essential part of the artwork [8].Author KeywordsAugmented cognition, prosthetic design, haptics, wearables,critical design, device art.ACM Classification KeywordsB.4.2. Input/Output Devices, H.5.m. Information Interfacesand presentation, K.4.1.c EthicsINTRODUCTIONThis paper concerns "Fear Tuners", a critical design projectthat began life in the Design Interactions Department at theRoyal College of Art in 2008. It is a project of designresearch, practiced from the perspective of artist-designers.Fear Tuners stands in the tradition of critical design. Thisapproach aims to open new spaces for designers and meansto provide an alternative method to design, in contrast tofocusing on the factors of ‘usability’ or commercialviability of a product, service or system. Embodyingdifferent values into the designs triggers a debate on theimpact of specific technologies that comes with these. Thedesigns can be seen as a manifestation of people’s hopesand fears in relation to those technologies [6].The Fear Tuners objects are wearable, functional devices,Copyright is held by the author/owner(s).<strong>UbiComp</strong> ’08 Workshop W1 – Devices that Alter Perception (DAP 2008)September 21 st , 2008This position paper is not an official publication of <strong>UbiComp</strong> ’08.Figure 1. Risk perception and actual hazardsBACKGROUNDThe project arose from the insight of being unable to assessthe threats, dangers and risks that we are faced with in today'scomplicated world. Technologies have greatly reduced someof the biggest risks of humankind, yet our modern life seemsto spawn a whole new array of abstract threats and fears [1].Creating a common feeling of "being at risk" has become apopular political method as well it is widely exploited inmainstream journalism [5]. The consent to a common fear in acommunity can result into a more cohesive society and thechoice to be aware of a danger is often meant to conform aspecific way of life [3]. Generally, it can be observed thatpeople seem to be unable to differentiate between mere panicmongering and the real threats that surround them. Forexample, we can register a massive media outrage on minor ornon-existing threats (e.g. bird flu, MMR vaccine), and aneglect of many serious risks, such as old age poverty relatedto non-functional pension schemes (Figure 1).14
HUMAN SENSES AND ABSTRACT DANGERSOur hard-wired sense apparatus is not suitable to sense themodern dangers in an array of fear stories. We are onlyhardwired to deal with sudden or physical dangers, such asapproaching cars, burning fires or rotten food. But we do nothave the instincts to sense the abstract and deferred dangersthat have a huge effect on our daily lives, like stock marketcrashes and the rising oil price.Figure 3. Raised neck hair and increased alertness throughphysical stimulationFigure 2. Fear Tuners – Form prototypeI propose to face this inability with the implementation ofwearable devices (Figure 2) as prostheses for these instinctsto be able to sense the deferred and abstract dangers oftoday.SKIN AS INTERFACEWhen we sense a physical danger, a set of bodily reactionscomes into action. We can feel cold shivers that run downour spines, get goose bumps, sweaty hands, our neck hairraises and we start to tremble. The most extreme of thesereflexes is the so-called 'fight or flight response' that jumpsinto action, whenever we are faced with a sudden attack [2].In this state, our pupils have narrowed and we have lostperipheral vision, we have an accelerated heart and lungactivity, and nutrient has been released to our muscles,among many others, to get us ready for action [7]. None ofthese physical manifestations is voluntarily chosen or theoutcome of an intellectually driven thought process.Instead, they are the immediate reflexes to an instinctsensing danger.These processes are hard-wired into our bodies as a resultof evolution, even though we rarely encounter emergenciesthat require physical effort.Fear Tuners as prostheses for instincts proposes to use theskin as an interface to stimulate similar physical sensations(Figure 3), as described in the preceding paragraph. FearTuners create an equally immediate and intense experience.Referring on the concept of body-to-emotion-feedback, byPaul Ekman, who describes how voluntary facial actions arecapable to generate changes in both autonomic and centralnervous system, I propose that wearing Fear Tuners willsimilarly result into changed mental state. By inducing a setof physical reactions normally related to fear, such as raising aperson’s neck hair or generating cold shivers and goosebumps, a state of increased awareness will be generated [4].Figure 4. Visualization – Stimulation of cold shivers related tothe current inflation rateAUGMENTATION OF HUMAN INSTINCTS TO PERCEIVEGLOBAL DATAFear Tuners are wearable devices, which act directly on theskin. Wireless technology links them to a piece of softwarethat harvests the internet for related data streams, e.g. stockmarket data, oil price etc. Whenever a severe change in dataoccurs, the device passes on a sensation to the wearer.15
Presenting the information in form of physical stimuli,rather than intellectual (textual and image basedinformation), allows the Fear Tuners wearer to focus thecenter of his or her attention on other things. The wearercan completely process Fear Tuners’ signals in thebackground of awareness. This form of ambientinformation presentation engages the senses and thus resultsinto a subtle, yet intense experience that does not disruptthe wearers daily routine [10].In the process of exploring suitable sensations, I wasinvestigating different actuators, such as solenoids andvibration motors, peltier pumps and electrical deep tissuestimulation aiming to create cold shivers (Figure 4), goosebumps, raised neck hair and hot stings. I also looked intopossibilities of exploiting the phenomenon ofsomatosensory illusions [9].I identified five key scenarios, Disasters, Financial, Health,Personal and Technology, in which Fear Tuners would actas an ‘artificial sixth sense’ in the form of a device.CONCLUSIONSAt present, Fear Tuners exist as a series of technicalexperiments, form prototypes, a video scenario and booklet.They were presented as part of my thesis at the RoyalCollege of Art graduation show. I am hoping to bring theproject to a next level, in which the preceding research andexperimentation in form and function would be combinedto create to a fully functional prototype. For this next step, Iam looking for collaboration partners from a differentbackground other than design.ACKNOWLEDGMENTSI thank Fiona Raby, Tony Dunne and James Auger whoguided and helped to develop the project at the RoyalCollege of Art and Carson Reynolds for his valuable adviceand inspiration.REFERENCES1. Aldersey, W., Briscoe, S., Panicology, Viking/Penguin,London, UK, pp. XIV-XVIII. 2008.2. Cannon, W. B., The wisdom of the body, New York,NY, Norton, 1932.3. Douglas, M., Wildavsky A., Risk and Culture,University of California Press, Berkeley, CA, USA,1983.4. Ekman, P., E. T. Rolls, D. I. Perrett and H. D. Ellis,Facial Expressions of Emotion: An Old Controversy andNew Findings [and Discussion], PhilosophicalTransactions: Biological Sciences, Vol. 335, No. 1273,Processing the Facial Image, pp. 63-69, 1992.5. Gardner, D., Risk, Virgin Books, London, UK, 2008.6. Gaver W., Dunne, T. & Pacenti, E., Cultural Probes,Interactions, pp. 24-25, 1999.7. Jansen, A. S., Nguyen, X. V., Karpitskiy, V.,Mettenleiter, T. C., and Loewy, A. D., Central commandneurons of the sympathetic nervous system: basis of thefight-or-flight response. Science (New York, N.Y.),270(5236): 644-646, 1995.8. Kusahara, M., Device Art: A New Approach inUnderstanding Japanese Contemporary Media Art. InMediaarthistories, ed. Oliver Grau. MIT Press, Boston,MA, USA, p. 288, 2007.9. Sherrick, C. E. & Rogers, R., Apparent hapticmovement, Perception & Psychophysics, Vol.1, pp.175-180, 1966.10.Wisneski, C., Ishii, H., Dahley, A., Gorbet, M., Brave,S., Ullmer, B., and Yarin, P, Ambient displays: Turningarchitectural space into an interface between people anddigital information. Volume 1370 of Lecture Notes onComputer Science, pages 22-32., 1998.16
Gesture recognition as ubiquitous input for mobile phonesGerrit Niezen Gerhard P. HanckeUniversity of PretoriaLynnwood Road, Pretoria,0002, South Africa{gniezen, g.hancke}@ieee.orgABSTRACTA ubiquitous input mechanism utilizing gesture recognitiontechniques on a mobile phone is presented. Possible applicationsusing readily available hardware are suggested andthe effects of a mobile gaming system on perception is discussed.Author Keywordsubiquitous computing, accelerometers, gesture recognition,optimization, human-computer interfacesACM Classification KeywordsB.4.2 Input/Output Devices, H5.m. Information interfacesand presentationINTRODUCTIONMobile phones are the most pervasive wearable computerscurrently available and have the capabilities to alter and manipulateour perceptions. They contain various sensors, suchas accelerometers and microphones, as well as actuators inthe form of vibro-tactile feedback. Visual feedback may beprovided through mobile screens or video eye wear.Dynamic input systems in the form of gesture recognitionare proving popular with users, with Nintendo’s Wii beingthe most prominent example of this new form of interaction,that allows users to become more engaged in video games[1]. The video game experience is now affected not only bytiming and pressing buttons, but also by body movement.To ensure a fast adoption rate of gesture recognition as anubiquitous input mechanism, technologies already availablein mobile phones should be utilized. Features like accelerometersensing and vibro-tactile feedback are readily availablein high-end mobile phones, and this should filter through tomost mobile phones in the future.Hand gestures are a powerful human-to-human communicationmodality [2], and the expressiveness of hand gesturesalso allows for the altering of perceptions in human-computerCopyright is held by the author/owner(s).<strong>UbiComp</strong> ’08 Workshop W1 – Devices that Alter Perception(DAP 2008)September 21st, 2008This position paper is not an official publication of Ubi-Comp ’08.interaction. Gesture recognition allows users to perceivetheir bodies as an input mechanism, without having to relyon the limited input capabilities of current mobile devices.Possible applications of gesture recognition as ubiquitous inputon a mobile phone include interacting with large publicdisplays or TVs (without requiring a separate workstation)as well as personal gaming with LCD video glasses.The ability to recognize gestures on a mobile device allowsfor new ways of remote social interaction between people.A multiplayer mobile game utilizing gestures would enableplayers to physically interact with one another without beingin the same location. Gesture recognition may be used as amobile exertion interface [3], a type of interface that deliberatelyrequires intensive physical effort. Exertion interfacesimprove social interaction, similar to games and sports thatfacilitate social interaction through physical exercise. Thismay change the way people perceive mobile gaming, as itnow improves social bonding and may improve overall wellbeingand quality of life.Visual, auditory and haptic information should be combinedin order to alter the user’s perceptions. By utilizing videoglasses as visual feedback, earphones as auditory feedbackand the mobile phone’s vibration mechanism as haptic feedback,a pervasive mobile system can be created to provide aubiquitous personal gaming experience. Gesture recognitionis considered as a natural way to interact with such a system.Gesture recognition algorithms have traditionally only beenimplemented in cases where ample system resources are available,i.e. on desktop computers with fast processors andlarge amounts of memory. In the cases where a gesturerecognition has been implemented on a resource-constraineddevice, only the simplest algorithms were considered andimplemented to recognize only a small set of gestures; forexample in [5], only three different gestures were recognized.We have developed an accelerometer-based gesture recognitiontechnique that can be implemented on a mobile phone.The gesture recognition algorithm was optimized such that itonly requires a small amount of the phone’s resources, in orderto be used as a user interface to a larger piece of software,or a video game, that will require the majority of the systemresources. Various gesture recognition algorithms currentlyin use were evaluated, after which the most suitable algorithmwas optimized in order to implement it on a mobilephone [6]. Gesture recognition techniques studied include17
hidden Markov models (HMMs), artificial neural networksand dynamic time warping. A dataset for evaluating thegesture recognition algorithms was gathered using the mobilephone’s embedded accelerometer. The algorithms wereevaluated based on computational efficiency, recognition accuracyand storage efficiency. The optimized algorithm wasimplemented in a user application on the mobile phone totest the empirical validity of the study.CURRENT IMPLEMENTATIONSChoi et al. [7] used accelerometer data acquired from a mobilephone’s built-in accelerometer. They were able to recognizedigits from 1 to 9 and five symbols written in the air.During their experimental study, they were able to achievea 97.01% average recognition rate for a set of eleven gestures.The recognition rate was cross-validated from a dataset of 3082 gestures from 100 users. This was done using aBayesian network based approach, with gesture recognitiondone on a PC connected to the mobile phone.Pylvänäinen [8] employed an accelerometer-based gesturerecognition algorithm using continuous HMMs, with movementsrecorded using an accelerometer embedded in a mobilephone, but gesture recognition was still performed ona desktop PC. A left-to-right HMM with continuous normaloutput distributions was used. The performance of the recognizerwas tested on a set of 10 gestures, 20 gesture samplesfrom 7 different persons, resulting in a total of 1400 gesturesamples. Every model for each of the 10 gestures had 8states. 99.76% accuracy was obtained with user-independenttesting. Pylvänäinen argued that an extensive set of gestures(i.e. more than 10) becomes impractical due to users havingto learn all the different gestures.With gesture recognition one should distinguish between postures,involving static pose and location without any movements;and gestures, involving a sequence of postures connectedby continuous motions over a short time span [2].Crampton et al. [1] developed an accelerometer-based multisensornetwork to recognize both postures and gestures. Thewearable sensor network detects a user’s body position asinput for video game applications, providing for an immersivegame experience. Mahalanobis distance is used as anearest-neighbour means of classification. This improves onusing Euclidian distance as a metric, as it takes into accountthe correlations of the data set and is scale-invariant. Theyargue that the more accelerometers are used, the more accuratelygestures and poses can be differentiated. This shouldbe taken into account when developing a gesture-based system,and is discussed further later in the paper.Current accelerometer-based motion-sensing techniques inmobile phones are either based on tilt or orientation, allowingfor simple directional movement control in games. Camerabasedmethods for gesture recognition are also becomingmore popular. A company called GestureTek [19] enablesmobile phones with built-in cameras to be used as motionsensingdevices. In the case of camera-based computer visionalgorithms, the necessary image processing can be slow,which creates unacceptable latency for fast-moving videoX-axis80400-40-80-1200 10 20 30 40 50 60 70 80 90Y-axis80400-40-80-1200 10 20 30 40 50 60 70 80 90Z-axis200-20-40-600 10 20 30 40 50 60 70 80 90Figure 1. Raw sensor data sampled from the Nokia N95’s accelerometergames and other applications [20]. Camera-based sensorsare also deemed power-hungry, which is a problem consideringthat the amount of power consumed during operationis of utmost importance in a mobile device.IMPLEMENTATION AND RESULTSIn [9], we describe how various gesture recognition techniqueswere evaluated, after which the most suitable algorithmwas optimized in order to implement it on a mobiledevice. We make use of the Dynamic Time Warping (DTW)algorithm, introduced by Sakoe and Chiba [10] in a seminalpaper in 1978. The DTW algorithm used was originallyimplemented in C by Andrew Slater and John Coleman [11]at Oxford University Phonetics Laboratory. The DTW algorithmnon-linearly wraps one time sequence to match anothergiven start and end point correspondence.Sensor data was collected using a Nokia N95’s embedded3-axis STMicroelectronics LIS302DL accelerometer. TheSymbian 3rd Edition SDK’s Sensor API was used to gatherraw sensor data using an interrupt-driven sampling method.The data was filtered using both a digital low-pass filter (LPF)and a high-pass filter (HPF). In figure 1 the raw sensor datagathered from the mobile phone’s accelerometer is shownfor all the three axes.A total of 8 gestures with 10 samples per gesture were collected.As the DTW algorithm is essentially a type of templatematchingtechnique, only one training sample per gesturewas required for the DTW algorithm to perform the gesturerecognition correctly. The 8 gestures used in this study canbe observed in figure 2. The gestures used were obtainedfrom a study done by Bailador et al. [12]. The DTW algorithmwas able to correctly classify a total of 77 of the 80samples, for an overall accuracy of 96.25%. The algorithmwas optimized [9] for the mobile phone and the recognitiontime was reduced from around 1000 ms to under 200 ms.The gesture recognition algorithm was ported to the mobiledevice by making use of Nokia’s Open C platform [13].Open C is a set of POSIX libraries to enable standard C programmingon Symbian Series 60 devices.18
een developed to overcome this. For Series 60 3rd Editiondevices (like the Nokia N95) a third-party module calledmisty provides vibration support, and for Series 60 2ndEdition an earlier package called miso was developed. Thesecapabilities will probably be added to the Nokia Python libraryin future.Figure 2. Gestures used in this studyHaptic feedback was added to the user application by utilizingthe vibro-tactile capabilities of the mobile phone whena gesture is recognized. Visual feedback is provided by displayinga graphic of the gesture on-screen. Auditory feedbackwas added by having the recognized gesture spokenout loud using the text-to-speech functionality of the NokiaPython Audio API.Personal media viewers, such as the Myvu Crystal [16], allowfor a full-screen mobile viewing experience. When combinedwith a mobile phone such as the Nokia N95 with anembedded accelerometer, our gesture recognition algorithmand a mobile game, the pervasive mobile gaming system asdescribed in the previous sections becomes possible. TheMyvu glasses can be connected to the Nokia N95 via theNokia AV connector, a 3.5 mm stereo headphone plug.Figure 3. User application running on the mobile deviceA user application was implemented to test the real-worldfunctionality of the gesture recognition algorithm. The userapplication was developed in the Python programming languageand executed on the mobile phone using Nokia’s Pythonfor Series 60 (S60) version 1.4.1 utilities [14]. Using Pythonallows one to rapidly prototype a graphical user interface(GUI) and other functionality by making use of the builtinAPIs to provide, for example, sound and graphics capabilities.An example of the user application running on themobile device is shown in figure 3.The gesture recognition algorithm (written in C) was linkedinto the Python program as a dynamically linked library (DLL).Wrapper code was created for the C algorithm in order tolink it into the Python program. The user application wasconverted into a standalone Python program on the Symbiandevice through the Ensymble developer utilities for SymbianS60 [15]. It can also run as a script in the Python for S60shell.To have the system learn a new gesture, the user can selectthe New Gesture command from the pop-up menu.When the user starts moving the phone, the application recordsthe gesture until the phone stops moving. The recorded gestureis then stored as a reference gesture on the phone. Torecognize a gesture, the user selects the Recognize commandfrom the pop-up menu. The application records thetest gesture as soon as the user starts moving the phone.When the device stops moving, the application executes thegesture recognition algorithm and displays the recognizedgesture as a graphic on the screen.Nokia’s Python for Series 60 does not provide built-in supportfor vibro-tactile feedback, but third-party utilities haveIt is envisioned that personal media viewers such as the Myvuwill enable mobile gesture-based gaming opportunities untiltrue see-through head mounted displays become less expensive.With the Myvu video glasses it is possible to lookabove or below the screen, which allows one to walk around.This makes it possible to use the video glasses for urbangaming, or other applications where the user is required tophysically walk around while still wearing the video glasses.Another possible application would be body mnemonics, aninterface design concept for portable devices that uses thebody space of the user as an interface [17]. Different bodypositions may be used as markers to remember computationalfunctionality or information such as phone book entries.For example, the user might move the mobile phoneto the shoulder or head to access a specific sub-menu or programon the phone. Continuous audio or tactile feedbackrelating to the user’s motion or gesture trajectories may beprovided. It is believed that this kind of tightly coupled controlloop will support a user’s learning processes and conveya greater sense of being in control of the system [18]. Userinterfaces or functions can now be logically or emotionallymapped to the user’s body, completely changing the perceptionof interacting with a mobile device.CONCLUSIONGestures can change the way we interact with computersand mobile devices. This is evident in new user interfacessuch as the multi-touch interface introduced by the AppleiPhone. The multi-touch interface adds motion gaming capabilitiesto the iPhone, albeit in a different sense than usingaccelerometer-based gesture recognition. This paper describesa cost-effective mobile system that can be implementedwith readily available hardware and realizable softwareon a mobile phone. An optimized gesture recognitionalgorithm that require minimal resources was described and19
implemented on a mobile phone.Accelerometer-based techniques have an advantage abovecamera-based techniques, i.e. that computationally intensivecalculations are not required for accurate movement information,as measurements are directly provided by the sensors.Sensor-based techniques also have the advantage inthat they can be used in much less constrained conditionsand are not reliant on lighting conditions or camera calibration[21].To provide a more immersive experience, wireless video glassesmay be developed that does away with cumbersome cabling.For the video glasses to be connected to a mobile phone,the wireless technologies used will most probably have to beBluetooth or Wi-Fi, as these technologies are already availablein mobile phones. This is an avenue for further exploration,since as of this writing no true wireless video glasseshave been developed.Possible pitfalls for gesture recognition in mobile phones includeuser acceptability: Will a user feel comfortable wavinghis or her arms around in a public space? Haptic feedbackis also important for user acceptance. The Nintendo Wii, forexample, incorporates this by providing both auditory andvibro-tactile feedback when performing a gesture. A usermust know the set of gestures that a system recognizes andgestures requiring high precision over a long period of timecan cause fatigue. Therefore the gestures must be designedto be simple, natural and consistent. If the gestures prove tobe tiring or strenuous, any possibility of altering the user’sperceptions will be limited.When only one accelerometer is used, the accuracy in detectingthe various gestures is reduced. With the NintendoWii, for example, the basic motions it detects can easily becheated with partial movement [1], which reduces the immersiveperception of a video game. Utilizing multiple accelerometersincreases accuracy at additional cost. Addingadditional accelerometer-based sensing devices to a mobilegaming system should not be technically complex, as Bluetoothmay be used for communicating with the mobile phone.Location-based games, also known as urban gaming, canutilize a mobile phone’s GPS receiver to provide a realistic,augmented reality-type gaming experience. This may becombined with the methods described in this paper to improveeven further on the alteration and modification of theuser’s perceptions. Hand gestures can also be used in 3Dvirtual environments to provide a more natural and immersiveuser experience [2], truly altering users’ perceptions inviewing and experiencing their environment.REFERENCES1. Crampton, N., Fox K., Johnston H. andWhitehead A. Dance Dance Evolution:Accelerometer Sensor Networks as Input toVideo Games. In Proc. IEEE HAVE 2007,107-112.2. Chen Q., Petriu E.M. and Georganas, N.D. 3DHand Tracking and Motion Analysis with aCombination Approach of Statistical andSyntactic Analysis. In Proc. IEEE HAVE 2007,56-61.3. Mueller F., Agamanolis S. and Picard, R.Exertion interfaces: sports over a distance forsocial bonding and fun. In CHI ’03: Proc.SIGCHI Conf. on human factors in computingsystems 2003, 561-568.4. Khronos Group. OpenGL ES Overview.http://www.khronos.org/opengles/.5. Feldman, A., Tapia, E.M., Sadi, S., Maes, P.and Schmandt, C. ReachMedia: On-the-moveinteraction with everyday objects. In Proc.IEEE ISWC 2005, 52-59.6. Niezen G. The optimization of gesturerecognition techniques forresource-constrained devices. M.Eng. thesis,University of Pretoria, South Africa, 2008.7. Choi, E., Bang, W., Cho, S., Yang, J., Kim, D.,and Kim, S. Beatbox music phone:gesture-based interactive mobile phone using atri-axis accelerometer. In Proc. IEEE ICIT2005, 97-102.8. Pylvänäinen, T. Accelerometer Based GestureRecognition Using Continuous HMMs. InLNCS: Pattern Recognition and ImageAnalysis, Springer-Verlag (2005).9. Niezen G. and Hancke G.P. Evaluating andoptimising gesture recognition techniques formobile devices. Int’l J. Human-ComputerStudies. Elsevier (submitted June 2008).10. Sakoe, H. and Chiba, S. Dynamicprogramming algorithm optimization forspoken word recognition. In IEEE Trans.Acoustics, Speech, and Signal Processing,26(1), 43-49.11. Coleman, J. Introducing speech and languageprocessing. Cambridge University Press,Cambridge, UK, 2005.12. Bailador, G., Roggen, D., Tröster, G. andTriviño, G. Real time gesture recognition usingContinuous Time Recurrent Neural Networks,In Proc. Int. Conf. Body Area Networks 2007.13. Nokia Research Center. Open C:Standard-based Libraries for Symbian-basedSmartphones.http://opensource.nokia.com/projects/openc/.14. Nokia Research Centre. Python for S60.http://opensource.nokia.com/projects/pythonfors60/.15. Ylänen, J. The Ensymble developer utilities forSymbian OS.http://www.nbl.fi/∼nbl928/ensymble.html.20
16. Myvu Corporation. Myvu Crystal.http://www.myvu.com/Crystal.html.17. Ängeslevä J., Oakley I., Hughes S. andO’Modhrain, S. Body mnemonics - portabledevice interaction design concept. In UIST -Adjunct Proc. ACM Symposium on UserInterface Software and Technology 2003.18. Strachan S., Murray-Smith R., Oakley I. andÄngeslevä J. Dynamic Primitives for GesturalInteraction. In LNCS: MobileHCI,Springer-Verlag (2004).19. GestureTek Mobile.http://www.gesturetekmobile.com.20. Geer, D. Will gesture recognition technologypoint the way? IEEE Computer, 37(10), 2004,20-23.21. Chambers, G.S., Venkatesh, S., West, G.A.W.and Bui, H.H. Hierarchical recognition ofintentional human gestures for sports videoannotation. In Proc. Int. Conf. on PatternRecognition, 1082-1085.21
CREATION OF SYMPATHETIC MEDIA CONTENTStéphane Perrinperrin.japan@gmail.comGiuseppe RivaCatholic Univ. of Milangiuseppe.riva@unicatt.itAlvaro CassinelliUniversity of Tokyocassinelli.alvaro@gmail.comABSTRACTTaking ground in the enactive view, a recent trend in cognitivescience, we propose a framework for the creation ofsympathetic media content. The notion of sympathetic mediacontent is based on two concepts: synesthetic media andempathic media transmission.Synesthetic media is media that make use of multiple andalternative senses. The approach is to reconsider traditionalmedia content from a different perceptual point of view withthe goal of creating more immersive and affective mediacontent. Empathic media transmission will consist in encodingthe emotional content of media into multi-sensorysignals. The encoded emotions are then mediated to the audiencethrough actuators that provide the physical manifestationof the multi-sensory information.The two points, synesthetic media and empathic transmission,are addressed through the study of the relation betweensenses and emotions and the development of suitable methodsfor encoding emotions into multiple senses, in the frameof an efficacious transmission of emotions to the audience.The extraction of emotional information from media and theconception of a wearable, unobtrusive device are consideredtoo. It is claimed that such a framework will help the creationof a new type of media content, ease the access to moreimmersive and affective media, and find applications in numerousfields.Author Keywordsmedia, enaction, emotion, sensors, perception, sensesACM Classification KeywordsH.5.1 Multimedia Information Systems — Artificial, augmented,and virtual realities,H.5.2 User Interfaces — User/Machine SystemsINTRODUCTIONAn emerging trend in cognitive science is the enactive view[6, 7] of sensorimotor knowledge. In this approach, perceivingis to understand how sensory stimulation varies as weact. In particular it implies the common coding theory [8]:actions are coded in terms of the perceivable effects theyshould generate. More in detail, when an effect is intended,the movement that produces this effect as perceptual input isautomatically activated, because actions and their effects arestored in a common representational domain.Copyright is held by the author/owner(s). <strong>UbiComp</strong> ’08 Workshop W1 –Devices that Alter Perception (DAP 2008), September 21st, 2008.This position paper is not an official publication of <strong>UbiComp</strong> ’08.The underlying process is the following [9, 10]: first, commonevent representations become activated by the perceptualinput; then, there is an automatic activation of the motorcodes attached to these event representations; finally, theactivation of the motor codes results in a prediction of theaction results in terms of expected perceptual events. Theenactive view and its corollaries support the concepts of:• Synesthetic media,• Empathic media transmission.After a detailed definition of the new notion of sympatheticmedia as synesthetic media combined to an empathic transmission,its practical implementation is discussed. Namely,the way to encode emotions and to transmit them throughmulti-sensory channels is presented as well as the design ofa device to achieve this aim.DEFINITION OF SYMPATHETIC MEDIASympathetic media is the combination of synesthetic mediaand empathic transmission.Synesthetic Media:In cognitive science, synesthesia (Greek, syn = together +aisthesis = perception) is the involuntary physical experienceof a cross-modal association. That is, the stimulation ofone sensory modality reliably causes a perception in one ormore different senses. Specifically it denotes the rare capacityto hear colors, taste shapes, or experience other equallystartling sensory blendings whose quality seems difficult formost of us to imagine. A synesthete might describe the color,shape, and flavor of someone’s voice, or seeing the colorred, a synesthete might detect the ”scent” of red as well.Transmission of emotions (for an enactive view on emotions,see [11]; on vision, see [12]), tones, moods or feelings intrinsicallycontained in media or that a creator intends to transmitvia a media to an audience relies heavily on only twosenses, the audition (music or speech) and the vision (imagesor text). On the contrary, human communication relieson a wide range of senses. Moreover, this reliance on onlytwo senses fails in some cases to convey sufficient informationto break cultural barriers or to reach audiences with sensorydisabilities. The efficiency of information transmission,including emotions [13], can be limited due to an overloadingof the visual and aural channels, for example by textualinformation such as subtitles that is perceived through visionand imply a cognitive effort. The idea of using alternativesensory channels to create more immersive, affectiveor realistic context and content for the audience is not new,22
especially in the fields of Ambient Intelligence [14], Immersive,Perceptual or Affective Computing [15], and Human-Computer Interaction [16]. To take an example, most VirtualReality (VR) rooms include several kinds of sensory outputs(wind [17], scent, force, haptic or temperature [18]) otherthan vision or audition. Nonetheless, most of these worksremain not easily accessible to audiences. Either becauseof their bulky nature (dedicated spaces for VR) or becausethere is no seamless integration of the extra sensory informationin the media that contains them. Moreover, these worksare mostly dedicated, and somehow limited, to re-create perceptualsensations identical to the ones that are virtually embeddedin a media (for example, the vibration of some gamecontrollers for simulating shocks). Few works try to reconsidera given media [19] from a totally different perceptualpoint of view.Empathic Media Transmission:In cognitive science empathy is the recognition and understandingof the states of mind, beliefs, desires, and particularly,emotions of others. It is often characterized as theability to ”put oneself into another’s shoes”, or experiencingthe outlook or emotions of another being within oneself;a sort of emotional resonance. For instance, if an observersees another person who is sad and in response feels sad,that individual is experiencing empathy. Empathy can occurin response to cues of positive emotion as well as negativeemotion. To qualify as empathy, the empathizer must recognize,at least on some level, that the emotion she or heis experiencing is a reflection of the other’s emotional, psychological,or physical state. In addition to widen the sensorybandwidth, it is necessary to develop empathic mediatransmission, able to embed emotional cues in sensory-basedcoding of perceived events. The encoding is done directlyinto the physical expression of these additional senses by usingsuitable actuators integrated in a wearable, non-intrusivedevice. The audience who receives this multi-sensory informationthrough the device and is thus in a state of partialsensorimotor immersion, will decode it for inducing emotionsthat ought to be identical to the emotions the creator ofthe media content intended to transmit.Thanks to the synesthetic property of the newly defined media,and the empathic transmission of emotions that are containedin media, a more emotional link between the mediaand the audience is created. This is something alreadyachieved for example in cinema through the background musicor visual clues. The goal here is to improve the empathicrelation to the media. How much this empathic link can bereinforced without breaking the duality audience / media isan interesting subject going beyond the scope of this presentation.SENSES TO EMOTIONSFollowing our definition of sympathetic media as a combinationof synesthetic media and empathic transmission thetranslation / encoding of virtual emotional information intoreal / physical sensory information transmitted to the audiencethrough actuators must be addressed. Two ways areproposed.The first way to adress the problem of inducing emotionsinto the audience, is by extending the classical approach.This is done by adding sensory channels to the alreadypresent ones, usually sound and image. The relation ofsenses to emotions is studied for determining the most efficientways to induce emotions from multi-sensory content.This includes the study of the attainable richness that a givensense or combination of senses can provide to encode virtualemotional content embedded in media content.The second way to achieve the transmission of emotions isbased on the enactive view and is thus favored. The methodis to induce the emotional cause from its physiological consequencesas perceived by the experiencing person. There issome evidence that this afferent feedback can modulate emotions(this is at the basis of the somatic-marker hypothesis [4]as well as the facial feedback hypothesis [1]). For example,a person experiencing stress or shame might have the feelingof a rise of the temperature. In the right context, rising effectivelythe temperature might help to induce the intendedemotions, here stress or shame. Another technique is to useactuators to divert attention or generate subtle changes ofemotional disposition [3]. Techniques such as surveys mighthelp for this study by determining the best sensory channelsand types of signals to use for inducing given emotions, within mind works in cognitive science (enactive view), psychologyand physiology.To better see the difference in these two approaches, that arenot exclusive, a second example is proposed. An emotionlike sadness could be induced through visual (in a movie,dark atmosphere, rain, faces of the actors, etc...) and auditory(use of a certain type of music) clues. This is theclassical approach. Sadness might be induced too by, for example,lowering the temperature and exercising slight pressuresat appropriate locations on the body of the audience.While it can be argue that the first approach is already doinga good job at transmitting emotions, even without wideningthe sensory bandwidth; the second approach might be usedin case of the absence of given sensory channels (for example,a radio program), the absence of a right context (lookingat a movie on a portable device) or for audience with sensorydisabilities.SOFT AND HARDWARE FOR SYMPATHETIC MEDIATIONExisting media can be manually annotated or the emotionsbeing automatically extracted. Given the difficulty to automaticallyextract emotional content from a given media, especiallyin the case of real-time applications, manual encodingwill the first step in the creation of sympathetic media.Emotional tags could be considered to annotate the media ina way quite similar to the subtitles tracks on a DVD. An encodingmodule must be developed that encodes emotions tosenses thanks to sets of rules and algorithms.The hardware can be separated into two elements. One thatsupports the processing unit (notably the encoding module)and a transmitter and is interfaced with the media. Thisfirst element communicates with a second element that is awearable device constituted of a receiver and the actuators.For this hardware part, we propose to design and conceivea wearable [22], unobtrusive, non-invasive, multi-actuatorsdevice, that will bring sympathetic media into homes ina similar way new technologies have brought cinema into23
homes through the Home Cinema.Assessment of available actuators that can serve our purposeof providing relevant and efficient physical sensations and ofbeing integrated in a wearable device will be conducted. Asa first step, only actuators that act in non-invasive and externalfashion relative to the human body will be considered.These actuators are, for example, actuators that can inducethe following perceptual inputs: vibration, pressure, temperature,touch,... All these actuators act through the skin. Noninvasiveactuators that act on internal organs of the humanbody (such as the galvanic vestibular simulation [20, 21])will not be considered here but their existence will be discussed.The design itself is another concern that can nonetheless beeluded at this stage. This device will contain a minimumof processing parts, except what is necessary for wirelesslycommunicating with the encoding module and for sendingthe received signals to the actuators. Because the actuatorsare non-invasive, the device which main function is to supportthese actuators will be non-invasive too. Nonetheless,most of the actuators are contact actuators and act throughthe skin. It implies that the device will be somehow attachedto the body. For limiting the invasive feeling, the device willbe for example designed as an armband. The future additionof other types of actuators will certainly lead to a reconsiderationof the design, including location on the body.FUTURE WORKSThree types of future improvements can be foreseen.• At the level of the senses in relation with the actuators.The progress in cognitive science and in nanotechnologymake possible to think of new types of actuators that willbe able to directly act on the brain of the audience withoutnecessarily being invasive, and even directly induce emotionsthrough electromagnetic signals [5], [2]. It shouldbe noted that even in this case, encoding is necessary andthat this type of brain stimulations can be somehow consideredas a sense. Such actuators will inevitably rise ethicalquestions. At the same time, it opens the door to moreimmersive and affective virtual communication or experience.• At the level of the emotions through their automatic extraction.The progresses in computing power, cognitivescience, psychology, or semiotics makes us think that boththe understanding of how emotions are induced and howto extract them automatically from media content will improve.The outcome of these advances will be useful tothe future of this research.• By implementing a mirror function to the whole system.The proposed system is aimed at transmitting emotionsfrom a media to an audience. By adding sensors to thewearable device that could monitor the emotional stateof the audience, a bi-directional empathic communicationcould take place with the possibility of interacting with themedia. The media could ”react” to the emotional feedbackof the audience.ACKNOWLEDGEMENTSThe authors would like to thank Carson Reynolds for interestinginsights and references.REFERENCES1. Buck, R. Nonverbal behavior and the theory ofemotion: the facial feedback hypothesis. Journal ofPersonality and Social Psychology, 38, 811-824(1980).2. Padberg F. et al., Prefrontal cortex modulation ofmood and emotionally induced facial expressions : Atranscranial magnetic stimulation study, The Journalof neuropsychiatry and clinical neurosciences, vol. 13,no2, pp. 206-212 (2001)3. C. Bassel and B. B. Schiff, Unilateral vibrotactilestimulation induces emotional biases in cognition andperformance, Neuropsychologia, Volume 39, Issue 3,Pages 282-287 (2001)4. Damasio, A.R. et al., Somatic markers and theguidance of behaviour: theory and preliminarytesting, (pp. 217-229). H.S. Levin, H.M. EisenbergA.L. Benton (Eds.). Frontal lobe function anddysfunction. New York: Oxford University Press,(1991)5. Cook, CM. and Persinger, MA., Experimentalinduction of the ”sensed presence” in normal subjectsand an exceptional subject. Percept Mot Skills.Oct;85(2):683-93, (1997)6. A. Noe, Action in perception. 2004, Cambridge, MA:MIT Press.7. E. Thompson, Sensorimotor subjectivity and theenactive approach to experience. Phenomenology andthe Cognitive Sciences, 2005, 4: p. 407-427.8. W. Prinz, Perception and action planning. EuropeanJournal of Cognitive Psychology. 1997, 9(2): pp.129-154.9. G. Knoblich and R. Flach, Action identity: Evidencefrom self-recognition, prediction, and coordination.Consciousness and Cognition, 2003, 12: pp. 620-632.10. M. Wilson and G. Knoblich, The case for motorinvolvement in perceiving conspecifics. PsychologicalBulletin, 2005, 131(3): pp. 460-473.11. C. Baerveldt and P. Voestermans, An enactive view onemotions. 9th conference of the International Societyfor Theoretical Psychology (ISTP), June 3-8 2001,Calgary.12. J. K. O’Regan and A. Noë, A sensorimotor account ofvision and visual consciousness. Behavioral and BrainSciences, 2001, 24: pp. 939-1031.13. Antonio Damasio, Descartes’s Error: Emotion,reason, and the Human Brain. 1994, Avon Books.24
14. G. Riva (Editor), F. Vatalaro (Editor), F. Davide(Editor) and M. Alcaniz (Editor), AmbientIntelligence: The Evolution Of Technology,Communication And Cognition Towards The FutureOf Human-Computer Interaction. 2005,OCSLPress.15. R. W. Picard, Affective Computing. 1997, MIT Press.16. B. Myers, A Brief History of Human ComputerInteraction Technology. ACM Interactions, 1998,5(2): pp. 44-54.17. T. Moon and G. J. Kim, Design and evaluation of awind display for virtual reality. Proc. of the ACMsymposium on Virtual reality software andtechnology, Hong Kong, 2004, pp. 122 . 128.18. M. B. Khoudja et al., Thermal Feedback for VirtualReality. International Symposium onMicromechatronics and Human Science, IEEEConference, 2003, pp 153-158.19. J. Bitton et al., RAW: Conveying minimally-mediatedimpressions of everyday life with anaudio-photographic tool. Proceedings of CHI 2004Conference on Human Factors in Computing Systems,24 - 29 April 2004.20. D. L. Wardman, et al., Effects of galvanic vestibularstimulation on human posture and perception whilestanding. J. Physiol., 2003, 551(3): pp. 1033-1042.21. T. Maeda et al., Shaking the World: GalvanicVestibular Stimulation as a Novel Sensation Interface,SIGGRAPH 2005.22. T. Maeda et al., Wearable Robotics as a BehavioralInterface -The Study of the Parasitic Humanoid-.Proc. of the 6th International Symposium on WearableComputers (ISWC.02), 2002.25
Carson ReynoldsUniversity of Tokyocarson@k2.t.u-tokyo.ac.jpAural AntennaeAlvaro CassinelliUniversity of TokyoMasatoshi IshikawaUniversity of TokyoABSTRACTAural Antennae are portable devices which translate soundimpulses into vibrotactile stimulus. By swapping audio sensationfor haptic sensation we illustrate one variety of artificialsynesthesia. The compact devices can be worn to actas electronic travel aids for the hearing-impaired or used foraugmented reality applications. Using a simple model of theaudio scene’s background noise, the device triggers whenthere is a large change in sound intensity from a specific direction.Author Keywordsaugmented reality, haptics, sensory substitution, hearing aidsACM Classification KeywordsH.5.2 Haptic I/OH.5.5 Sound and Music ComputingB.4.2 Input/Output DevicesARTIFICIAL ANTENNAESuppose for a moment that your body was covered with severalextremely long antennae. Like an insect, you use theseantennae to probe about space, tapping and feeling the worldthat surrounds you.For some, such a scenario is just a much-reduced plot ofa Kafka story. However, we view this scenario in anotherlight; our research group is preoccupied with how the preceptscan be transformed to reproduce atypical experiences.We find motivation to create sensation similar to what theantenna-endowed insect feels.Indeed, there are some surprising upshots to having antenna.It has been observed, for instance that cockroaches “usetheir antennae to detect a wall and maintain a constant distance”[2]. Antenna and cilia provide a variety of tactilespatial awareness. Some crude televised experiments withhouse cats and duct tape also show that felines use theirhair to modify their gait and assess the space surroundingthem [9].Now suppose that you were covered with antennae whichcould pick up and localize minute aural signals. What wouldit be like to feel higher frequency audio signals in a mannerto similar to how we already feel low-frequency bass?Copyright is held by the author/owner(s). <strong>UbiComp</strong> ’08 Workshop W1 –Devices that Alter Perception (DAP 2008), September 21st, 2008.This position paper is not an official publication of <strong>UbiComp</strong> ’08.Figure 1. An Aural Antenna converts a signal from an electret microphoneinto vibrotactile stimulus.HEARING IMPAIRMENT AND PROSTHESESThe Tadoma or Hofgaard method is a simple techniquewhere those suffering from hearing loss feel the movementsof a speaker by touching the parts of the face and neck usedin speech production [17]. It has been used since the 1890sas a method for speech-reading [14].As early as 1936, Gault discussed “hearing through the skin”and worked to develop mechanical apparatus for sound localization[7]. The development of vocoding techniques inthe 1940s in turn spurred a variety of haptic audio systemsmodified to provide haptic stimulus at various loci on thebody [17]. By the 1980s, wearable systems were constructedin which “speech sound generates a characteristic tactile patternthat observers can learn to identify” [20].Wearable auditory systems gave way to implantables whichwere capable of “direct electrical activation of the auditorynerve” [24]. Further information about the neural basis ofaudition has been provided by studies of macaque monkeysusing fMRI giving evidence integration of tactile and audiostimuli in the auditory cortex [11].TRANSFORMATION OF PERCEPTIONPortable electro-mechanical systems make possible the creationof pattern converters or intermediaries that sit betweenour sense organs and the real world. The somatic nervous26
system, reflex arcs, and even muscles are organs whose artificialstimulation allows the transformation of perception.That electrical activity has the ability to interact with the humanpercepts has been long known: “In his 1820 dissertation,Bohemian physiologist Johann Purkyne reported thata galvanic current flowing through the head upset balanceand equilibrium” [6]. This technique has recently been employedby researchers who have built wearable devices toalter sense of balance as well as provide a “virtual sense ofacceleration” [13].Cutaneous rabbit illusion is an interesting perceptual illusionin which a series of taps produced by actuators at discrete locationsfeel as if they are interspersed between the actuatorsunder particular timing conditions [8]. This phenomena hasbeen exploited by a variety of haptic devices to provide stimulationin areas between actuators. For instancea3x3“rabbit”display composed of vibrator was used to communicatedirectional cues [22].Another phenomena which has been exploited to transformperception is that of sensory substitution. Early attemptslooked at using vibrating stimulators to convey visual picturesusing an array built into a dental chair [1]. Experimentsshowed that visually impaired participants could “learn torecognize ... the layout of objects on a table in depth and incorrect relationship.”Synesthesia (literally: joining of perception) has been inducedin humans using a variety of methods, including electricalstimulation [5]. Less invasively, it may also be simulatedthrough the use of devices which map the informationof one senses onto another. This is the case with Fingersightdevices, including one that allows wearers to feel opticaledges as oscillations of a solenoid mounted above thefingertip [21].We have developed a number of systems that seek to augmentthe percepts and specifically make use of the body orreflexes as part of interaction [18]. Earlier work on laserbasedtracking systems [15] led us to think of how opticalbased information might be felt by users, which led us toradar and antennae as metaphors for interaction.HAPTIC ANTENNAEWe began to experiment with the concept of artificial antennaeas part of device illustrating another concept: HapticRadar [4]. This is a project that seeks to augment spatialawareness by creating radar out of sensors which act to extendthe range of touch for the skin.As most humans have a copious amount of hair located ontheir head (at least at some point in their life), and our headsare something we wish to protect, we reasoned a headbanddevice would be a good first form factor to test.We devised a system linking pairs of infrared rangefindersto motor vibrators into a circular arrangement. An earlierpaper, Augmenting spatial awareness with Haptic Radar, detailsexperimental results concerning the Haptic Radar. Mostsaliently, we found that 86% of untrained participants coulduse the system to move to avoid objects they could notsee [3].Following these initial experiments, we began a redesignwith the aim to make individual, compact, Haptic Antenna.To replace the Arduino board, we selected an ATMEL ATtiny13RISC microcontroller for its compact size (4 mm x4mm). The process of reading from infrared rangefinder andcontrolling a vibrating motor requires a minimum of computationalresources so this 8-bit microcontroller operatingat 20 MHz is adequate.After recreating and testing the system on breadboard, weadded a 100 milliampere-hour lithium-ion polymer batteryas well as charging circuitry. After testing this through-holetechnology circuit, we designed and fabricated a surfacemounttechnology printed circuit board (using the freelyavailable Eagle printed circuit board CAD software.)After further testing and circuit board revisions, we havearrived at a Haptic Antenna in a much more portable instantiation.The device melds a microcontroller, infraredrangefinder, motor-vibrator (a common part in portablephones), battery and electronics. Altogether, these componentsoccupy 25 cm 3 , which is a factor of 34 times smallerthan the previous version’s electronic system.AURAL ANTENNAEDuring this process we came to ask ourselves: what if peoplefelt directional sound as opposed to distance information?Imagine that a car is honking behind you but that you cannothear it because of a hearing impairment or environmentalnoise. Now imagine that the honking could be felt on thebody at the location nearest to the car’s horn.As a starting point to test this concept we have been buildingprototype audio-to-touch sensory substitution devices. AuralAntennae are compact, worn modules which produce vibrotactilestimulus in response to audio signals emanating froma particular direction.Principle of OperationOur current prototype builds upon the precious Haptic Antennaeplatform. Instead of a range finder, we attach adaughter board containing an electret microphone, conditioningresistors and capacitors as well as an OPA344 operationalamplifier configured with a gain of G = 100.The analog voltage output of the amplifier is digitized usingthe ATtiny’s internal 10 bit analog to digital converter.The microcontroller’s firmware samples the microphone atapproximately f s = 9000Hz.After each sample, the microcontroller computes a simplemoving average (SMA) over the previous k = 10 samples(1). The absolute difference (δ) is then computed betweenthe current sample s t and SMA (2).27
Making use of shotgun-type microphones has improved thedirectionality of our initial prototype. The use of lasermicrophonesmight increase range significantly. With networkcapabilities we could create a worn antenna array capableof sound localization using time-of-arrival.One can imagine a type of wearable simultaneous localizationand mapping (SLAM) system. This could be a fusion ofantenna-array sound localization and laser ranging and detection(LADAR). Such a system might use a Bayesian networkto estimate object location based on data provided byboth audio and optical sensing systems.Figure 2. An Aural Antenna module incorporating lithium-ion polymerbattery, 20 MHz, 8-bit microcontroller, and vibrotactile motor.SMA = s t + s t−1 + ···+ s t−(k−1)k(1)δ = |s t − SMA| (2)If δ is greater than 21010(10% of the dynamic range of the analogto digital converter), then the vibrator is activated with100% duty cycle until the next sample is processed. Thismoving average works as an extremely rudimentary adaptivebackground noise filter. The vibrating motor is controlled bya MOSFET transistor whose gate is tied to a digital outputpin of the ATtiny microcontroller.Our initial experiments with Haptic Antennae indicated thatblindfolded participants readily interpreted the vibrotactilestimulus and associate it with approaching objects. We expectthat similar phenomena will be observed in forthcomingexperiments with the aural antennae.The device exploits our innate ability to process (in a parallelmanner) haptic stimulus applied to skin or the Vellus hairwhich covers most areas of our bodies. Other recent work onelectronic travel aids [16] as well as the use of vibrotactilecuing in virtual environments [12] make use of this phenomena.Experiments have also documented that strong hapticstimulus can induce a startle reflex [25], which may be usefulin emergency situations.EXTENSIONSWhile independent modules may be worn simultaneously,when networked together the augmentations provided by thedevices would be greatly enhanced. We are in the processof evaluating low-power wireless chips such as Zigbee toincorporate into the modules. We anticipate that wirelessantennae would be able to work together to provide “rabbit”perceptual illusions of motion between the actuators.Another extension of this work is in the area of actuation.The “pancake” style vibration motor we are using(KOTL C1030B028F) has the advantage of being compact,but presents substantial initial friction which makes responsesomewhat limited. Other researchers have reported on theuse of air puffs and acoustic cues to elicit startles [23]. Stillother researchers have thoroughly investigated using electricalstimulation to provide haptic cues [10].AS OTHER SPECIES HEARWe have developed an example of aural antennae which providehaptic feedback. Often thinking about haptic devices isconstrained by our experience of our existing senses. Wehave instead sought to break with this convention by seekingto emulate insect perception.Thinking more openly, we can imagine a myriad of newbiomimetic ways of seeing the world. Compound eyes andocellus suggest worn garments that have thousands of cameras.Mimicry of insect’s abilities to acutely detect subtlevibrations [19] and act on this information could lead to extensionof touch in the manner that optics have extended thesight.ACKNOWLEDGMENTSThe authors would like to thank Tomohiko Hayakawa,Kenichiro Otani, and Alexis Zerroug for work on early prototypes.REFERENCES1. P. Bach-Y-Rita, C. C. Collins, F. A. Saunders, B. White,and L. Scadden. Vision substitution by tactile imageprojection. Nature, 221(5184):963–964, March 1969.2. J. M. Camhi and E. N. Johnson. High-frequencysteering maneuvers mediated by tactile cues: antennalwall-following in the cockroach. J Exp Biol, 202(Pt5):631–643, March 1999.3. A. Cassinelli, C. Reynolds, and M. Ishikawa.Augmenting spatial awareness with haptic radar. InWearable Computers, 2006 10th IEEE InternationalSymposium on, pages 61–64, 2006.4. A. Cassinelli, C. Reynolds, and M. Ishikawa. Hapticradar. In SIGGRAPH ’06: ACM SIGGRAPH 2006Sketches, New York, NY, USA, 2006. ACM.28
5. R. Cytowic. Synesthesia: Phenomenology andneuropsychology. Psyche, 2(10):2–10, 1995.6. R. C. Fitzpatrick and B. L. Day. Probing the humanvestibular system with galvanic stimulation. J ApplPhysiol, 96(6):2301–2316, June 2004.7. R. H. Gault. Recent developments in vibro-tactileresearch. Journal of the Franklin Institute,221(6):703–719, June 1936.8. F. A. Geldard and C. E. Sherrick. The cutaneous”rabbit”: a perceptual illusion. Science,178(57):178–179, October 1972.9. Japan’s greatest mysteries: gaffer tape, April 14th1996. http://www.glumbert.com/media/cattape.10. H. Kajimoto, N. Kawakami, T. Maeda, and S. Tachi.Tactile feeling display using functional electricalstimulation. In In Proceedings of the 9th InternationalConference on Artificial Reality and Telexistence, 1999.11. C. Kayser, C. I. Petkov, M. Augath, and N. K.Logothetis. Integration of touch and sound in auditorycortex. Neuron, 48(2):373–384, October 2005.12. R. W. Lindeman, J. L. Sibert, E. Mendez-Mendez,S. Patil, and D. Phifer. Effectiveness of directionalvibrotactile cuing on a building-clearing task. In CHI’05: Proceedings of the SIGCHI conference on Humanfactors in computing systems, pages 271–280, NewYork, NY, USA, 2005. ACM Press.13. T. Maeda, H. Ando, T. Amemiya, N. Nagaya,M. Sugimoto, and M. Inami. Shaking the world:galvanic vestibular stimulation as a novel sensationinterface. In SIGGRAPH ’05: ACM SIGGRAPH 2005Emerging technologies, New York, NY, USA, 2005.ACM.14. S. J. Norton, M. C. Schultz, C. M. Reed, L. D. Braida,N. I. Durlach, W. M. Rabinowitz, and C. Chomsky.Analytic study of the tadoma method: Background andpreliminary results. J Speech Hear Res, 20(3):574–595,September 1977.15. S. Perrin, A. Cassinelli, and M. Ishikawa. Laser-BasedFinger Tracking System Suitable for MOEMSIntegration. Proceedings of Image and VisionComputing, New Zealand (IVCNZ), pages 131–136,2003.16. S. Ram and J. Sharf. The people sensor: A mobility aidfor the visually impaired. iswc, 00, 1998.17. C. M. Reed, N. I. Durlach, and L. A. Delhorne.Historical overview of tactile aid research. InProceedings of the second international conference ontactile aids, hearing aids and Cochlear Implants, 1992.18. C. Reynolds, A. Cassinelli, and M. Ishikawa.Meta-perception: reflexes and bodies as part of theinterface. In CHI ’08: CHI ’08 extended abstracts onHuman factors in computing systems, pages3669–3674, New York, NY, USA, 2008. ACM.19. D. Robert and M. C. Göpfert. Novel schemes forhearing and orientation in insects. Current Opinion inNeurobiology, 12(6):715–720, December 2002.20. F. Saunders, W. Hill, and B. Franklin. A wearabletactile sensory aid for profoundly deaf children. Journalof Medical Systems, 5(4):265–270, December 1981.21. G. Stetten, R. Klatzky, B. Nichol, J. Galeotti,K. Rockot, K. Zawrotny, D. Weiser, N. Sendgikoski,S. Horvath, and S. Horvath. Fingersight: Fingertipvisual haptic sensing and control. In Haptic, Audio andVisual Environments and Games, 2007. HAVE 2007.IEEE International Workshop on, pages 80–83, 2007.22. H. Tan and A. Pentland. Tactual displays for wearablecomputing. Personal and Ubiquitous Computing,1(4):225–230, December 1997.23. B. K. Taylor, R. Casto, and M. P. Printz. Dissociation oftactile and acoustic components in air puff startle.Physiology & Behavior, 49(3):527–532, March 1991.24. B. S. Wilson, C. C. Finley, D. T. Lawson, R. D.Wolford, D. K. Eddington, and W. M. Rabinowitz.Better speech recognition with cochlear implants.Nature, 352(6332):236–238, July 1991.25. J. S. Yeomans, L. Li, B. W. Scott, and P. W. Frankland.Tactile, acoustic and vestibular systems sum to elicitthe startle reflex. Neuroscience & BiobehavioralReviews, 26(1):1–11, January 2002.29
Learn Traffic State Based on Cooperative LocalizationZhuo Sun, Yiqiang Chen, and Juan QiPervasive Computing Center, Institute of Computing TechnologyChinese Academy of Sciences, Beijing, China{sunzhuo, yqchen, qijuan}@ict.ac.cnABSTRACTA key problem of monitoring the traffic state is the localizationand tracking of vehicles and passengers. In this paper,we present a new cooperative localization technique whichmakes use of collaboration of mobile phones for traffic monitoring.Instead of relying on the signal strength only, ourcooperative localization approach utilizes additional connectioninformation among mobile phones to improve the localizationaccuracy. It separates mobile phones into differentclusters by some short-range links such as Bluetooth, thenlocates the members in a cluster simultaneously. We designa simulation experiment and the results show that ourmethod is able to catch the main trace of all the members ina cluster. In this way, the traffic flows can be monitored.Author KeywordsTraffic monitoring, Cooperative localization, Wi-Fi networksACM Classification KeywordsH.5.3 [Information Interfaces and Presentation (e.g., HCI)]:Group and Organization Interfaces - Collaborative computingINTRODUCTIONIn modern society, the demand for traffic monitoring systemsthat can detect position, velocity, density, and flow rate in astreet is increasing. Traditional monitoring approaches includeGPS, video monitoring etc. However, GPS as a standalonesystem is not sufficient for an increasing number oftransport applications due to limited visibility to the satelliteswithin the urban canyons. Video monitoring is able torecord the whole traffic state, but it takes large human effortsto analyze the traffic data. Since the prevalence of mobilephones, cellular networks are once under consideration foruser localization. But the low localization accuracy of a fewhundred meters makes it not practical in real world.(APs) and the signal strength implies the distance from themobile phone to APs. There are various methods to determinethe mobile phone location according to the signalstrength, which we will discuss later. However, due to thenoisy and fluctuant characteristics of Wi-Fi signals, the locationestimation by a single mobile phone may be ratherbiased. Although some filters such as [3] are advised forsmoothing, the results seem not apparently improved in somebad situations.In this paper, we propose a novel cooperative localization inWi-Fi based networks, which makes use of collaboration ofmobile phones to learn the traffic state. As far as we know,this concept is completely new in Wi-Fi based localizationdomain. In the traditional non-cooperative scenario, a mobilephone infers the location only from its own received Wi-Fi signals. While in a cooperative scenario, several mobilephones nearby are combined in a cluster by some short-rangelinks to determine locations simultaneously. For example,Bluetooth, which is commonly used on mobile phones canbe used to detect the other devices in a short range (usually10 ∼ 20 meters). The devices within the valid range is consideredas a cluster. The mobile phones in the same clustercan exchange data about their traces. Although each singletrace may be inaccurate, it is more likely to find a reliabletrace of the cluster by integrating the trace information together.Figure 1 illuminates such a scenario. In additionto signal strength, connectivity information or distance measurementsamong phones in a same cluster are utilized toimprove localization accuracy. One problem with the clusteris that the cluster members are dynamic due to their mobilitiesand it has to be updated periodically.Recent years, Wi-Fi is popular around the world. Manycities carry out ’Wi-Fi City’ projects to implement largescalecoverage, especially in the important streets. Wi-Fibased localization gets an accuracy of about 20 meters outside.As more and more mobile phones are equipped withwireless cards that can receive Wi-Fi signals, it is possibleto monitor the traffic state by Wi-Fi networks. A mobilephone receives Wi-Fi signals from several access pointsCopyright is held by the author/owner(s). <strong>UbiComp</strong> ’08 Workshop W1 –Devices that Alter Perception (DAP 2008), September 21st, 2008.This position paper is not an official publication of <strong>UbiComp</strong> ’08.Figure 1. The cooperative localization scenario in Wi-Fi networks.30
RELATED WORKLet us consider the localization problem in the similar fieldssuch as robots and wireless sensor networks. The robots alsointeract with the environment and each other through imperfectsensor measurements corrupted by noise. Consequently,the concept of cooperative localization is introduced, wheregroups of robots combine sensor measurements to implementcooperative localization. [8] demonstrates the utilityof introducing a second robot to aid in the tracking of theexploratory robot’s position.In wireless sensor networks, cooperative localization usesconnectivity information (such as who is within the communicationrange of whom or estimated distances betweenneighbors) to derive the locations of the nodes in the network.[10] first builds a relative map through a multidimensionalscaling, then with three or more anchor nodes, therelative map can be transformed and absolute coordinates ofall the nodes are computed.[5] proposes a cooperative positioning technique by utilizingthe additional information obtained from short-range linkslike WiMAX/Wi-Fi to enhance the location estimation accuracyin cellular networks. However, it just fuses thesetwo kinds of signals together and its cooperative positioningrefers to fusion of different sensor data.WI-FI BASED LOCALIZATION METHODSIn general, Wi-Fi based localization research can be classifiedinto two main categories: deterministic techniques andprobabilistic techniques.Deterministic techniques [1], [6], [2] use deterministic inferencemethods to estimate a user’s location. The RADARsystem developed by Microsoft Research [1] proposes nearestneighborheuristics and triangulation methods to infer a user’slocation. It maintains a radio map which tabulates the signalstrength received from different access points at selected locations.Each signal-strength measurement is then comparedagainst the radio map and the coordinates of the best matchesare averaged to give the location estimation. The accuracyof RADAR is about three meters with 50 percent probability.The LANDMARC system [6] exploits the idea of referencepoints to alleviate the effects caused by the fluctuation ofRFID signal strength. The accuracy is roughly one to threemeters. However, the placement of reference tags should becarefully designed since it has a significant effect on the performanceof the system. Moveover, the RFID readers areso expensive that it is infeasible for localization in a largearea. In [2], an online procedure based on feedback fromusers was employed to correct the location estimation of thesystem.Another branch of research is the probabilistic techniques[9], [11], [4] which construct a conditional probability distributionover locations in the environment of interest. In[4], Ladd et al. use probabilistic inference methods for localization.They first use Bayesian inference to computethe conditional probability over locations, based on receivedsignal-strength measurements from nine access points in theenvironment. Then, a postprocessing step, which utilizesthe spatial constraints of a user’s movement trajectories, isused to refine the location estimation and reject the resultswith significant change in the location space. Dependingon whether the postprocessing step is used or not, the accuracyof this method is 83 or 77 percent within 1.5 meters.In addition, Roos et al. [9] compare the performanceof the non probabilistic nearest-neighbor method with thatof two probabilistic approaches. The results show that thetwo probabilistic approaches produce better results than thenearest-neighbor method and the average location estimationerror is below two meters. Furthermore, the time-series analysistechnique [11] was introduced to study the correlationamong consecutive samples received from the same accesspoint over time. The authors reported that better accuracycan be achieved by taking such correlation into account.Since Hidden Markov Model (HMM) can utilize both singlesamples and user trajectories in the form of sequentialknowledge [4], we adopt it to solve the tracking problems.HMM is used to model the user traces by treating physicallocations as hidden states and the signal strength measurementsas observations. Each user trace is denoted asT = {l 1 ,l 2 , ..., l n } and l i = (x i ,y i ) is considered as adiscrete physical location with x and y coordinates. O ={o 1 ,o 2 , ..., o n } is defined as observation space and o j ={s 1 ,s 2 , ..., s m ) is a set of signal strength measurements fromm different access points. In this way an HMM can be definedas a quintuple (T, O, λ, A, π), where λ is prior probabilityof signal distribution. T,O,λ can be learned fromsome collected traces. Transition matrix A describes how aperson travels through the state space, which is constrainedby physical locations and mobile velocity. π is an initiallocation-state distribution encoding where the user initiallymay be. Generally, it is set by a uniform distribution ifthere is no prior knowledge about user locations. In the onlinelocalization phase, given an observed signal sequenceÕ = {õ 1 , õ 2 , ..., õ n }, the well-known Viterbi algorithm [7]can be used to infer the most probable physical space sequence˜T .COOPERATIVE LOCALIZATIONIn a cooperative scenario, not a single but a group of mobilephones determines their locations together. The primarydiscrimination of the group is that each member is close toothers and has a similar direction of movement. We call thisgroup a Cooperative Cluster, as shown in Fig.1. The membersin the same cluster communicate and exchange datawith each other. Then the integrated information can be usedto improve respective localization results since more constraintsare added. In traffic flow monitoring, overall trendsis focused on rather than single trace of each vehicle. Whilein a large-scale area, the distance between nearby mobilephones can be ignored. That’s to say, each member in acluster shares a similar trace, which represents most of themembers’ trends. We will mainly discuss the solution to thisproblem in the following part.The discrimination of cooperative clusters depends on linksthat have shorter range such as Bluetooth, UWB, Zigbee.31
Mobile phones within the range for a while are consideredto have similar behaviors and can form a cooperative cluster.We prefer Bluetooth because its prevalence on mobilephones. Bluetooth is a standard and communications protocolprimarily designed for low power consumption with ashort range in each device. It enables these devices to communicatewith each other when they are in range. Maximumpermitted power of about 2.5mW can cover an areaof circle with a radius of about 10 meters. Therefore, weuse Bluetooth to detect whether the mobile phones are in asame cooperative cluster or not. The request to keep in touchwith each other for a while guarantees the same direction ofmovement, and it does not make sense if mobile phones passby toward the contrary direction.After cooperative clusters have been divided, we predict thedirection of each cluster using the integrated informationgathered from members of the cluster. Suppose there aren members in a cluster in a time period t 1 to t p , indicatedby {M 1 ,M 2 , ..., M n }. We apply the HMM method introducedahead on each member M i separately to get a traceT i = {l (i)1 ,l(i) 2 , ..., l(i) p },i =1, 2, ..., n. We propose a TraceLeast Square (TLS) algorithm to find the optimized traceT c = {l (c)1 ,l(c) 2 , ..., l(c) p } of the cluster. TLS addresses tothe following optimization problem:arg minT cp∑∑ n(l (c)ji=1 j=1− l (i)j )2 +p∑(l (c)jj=2− l (c)j−1 )2 (1)The first term penalizes the discrepancy between T c and T i ,and the second term keeps T c as smooth as possible.However, this optimization is unsolvable due to p parametersin all. Consider the trace information is time dependable, webreak it into single time period and it is equivalent to:⎧⎨arg min l(c)j∑ ni=1 (l(c) j∑ ni=1 (l(c) j− l (i)j )2 if j =1⎩ arg min (c) l− l (i)j )2 +(l (c)j − l (c)j−1 )2 if j>1j(2)It can be explained that the location at t 1 is decided by alll1,i i =1, 2, ..., n, and the location at t j , 1 1 (3)All the members in a cluster can be represented by the traceT c . The work flow of the algorithm is prescribed in Fig.2.As mobile phones are not static, the clusters need to be updatedperiodically. Therefore, the overall algorithm is in acirculation.SIMULATION EXPERIMENTSTo evaluate the performance of cooperative localization, wemake a simulation experiment in an indoor environment. AWi-Fi wireless environment is established on the 3rd floor ofFigure 2. The work flow of cooperative localization.our academic building, with an area of about 30m × 15m.The whole layout of the test-bed is shown in Fig.3, and 5TENDA APs are deployed around. We choose the hallwayto simulate a street, and two persons take different mobilephones to represent the passengers. One mobile phone is anO2 Xda Atom Life smartphone and the other one is a NokiaN95, both with Bluetooth and Wi-Fi wireless cards.Figure 3. The whole layout of the test-bed.We design two different traces to simulate the traffic state.The first one is that these two persons go straight forwardside by side, as shown in Fig.4(a). The red line denotes theactual trace of the person with O2, and the blue one is withN95. As they are always in the Bluetooth range, they areconsidered to be in a cluster. We apply our cooperative localizationto track each one separately and the cluster also.The tracking traces and the cluster trace are illustrated inFig.4(b). It is obvious that the tracking traces got by one mobilephone separately are quite fluctuant, although we havegiven geographic constraints in the HMM models. However,the cluster trace reflects a more smooth trace that representsthe overall trend of members. It can be inferred that our cooperativelocalization can catch a group of traffic objects thathave similar behaviors.The second trace we design is one person (with N95) turnsinto a room halfway as shown in Fig.5(a). After they get32
(a) Actual traces.(a) Actual traces.101099Y Coordinate (unit: m)8765Y Coordinate (unit: m)87654O2N95Cluster30 4 8 12 16 20 24 28 32X Coordinate (unit: m)(b) Tracking traces and cluster trace.4O2N95Cluster30 4 8 12 16 20 24 28 32X Coordinate (unit: m)(b) Tracking traces and cluster trace.Figure 4. Two persons go straight forward side by side.Figure 5. One person turns apart halfway.apart from each other, the Bluetooth signals are blocked bythe wall and these two mobile phones can not get in touchagain. Figure 5(b) presents the tracking result of this trace.Each single trace is still rough due to the noisy signals whilethe cluster trace is relatively smooth. Moreover, as the twophones exceed the range of Bluetooth, the cluster is brokenup and the cluster trace stops at the turning point accordingly.It indicates that our cooperative localization can dividethe mobile phones into exact clusters, make sure themembers in a cluster have similar mobile trends.CONCLUSION AND FUTURE WORKIn this paper, we originally propose a new cooperative localizationtechnique in Wi-Fi based networks to learn trafficstate. Unlike the cooperative localization in robots and wirelesssensor networks, our cooperative localization makes useof collaboration of mobile phones to separate them into differentclusters. Then their behaviors can be represented bythe cluster trace. We simulate it in wireless environment andthe simulation results show the effectiveness. In the future,we will make actual traffic experiments and improvement onthe algorithms further.REFERENCES1. P. Bahl, A. Balachandran, and V. Padmanabhan. Enhancements to theradar user location and tracking system. 2000.2. E. S. Bhasker, S. W. Brown, and W. G. Griswold. Employing userfeedback for fast, accurate, low-maintenance geolocationing. InPERCOM ’04: Proceedings of the Second IEEE InternationalConference on Pervasive Computing and Communications(PerCom’04), page 111, Washington, DC, USA, 2004. IEEEComputer Society.3. F. Gustafsson, F. Gunnarsson, N. Bergman, U. Forssell, J. Jansson,R. Karlsson, and P. Nordlund. Particle filters for positioning,navigation, and tracking. 2002.4. A. M. Ladd, K. E. Bekris, A. Rudys, L. E. Kavraki, and D. S.Wallach. Robotics-based location sensing using wireless Ethernet.Wireless Networks, 11(1), 2005.5. C. L. F. Mayorga, F. D. Rosa, S. A. W. G. Simone, M. C. N. Raynal,J. Figueiras, and S. Frattasi. Cooperative positioning techniques formobile localization in 4g cellular networks. In Proceedings of IEEEInternational Conference on Pervasive Services (ICPS’07), 2007.6. L. M. Ni, Y. Liu, Y. C. Lau, and A. P. Patil. Landmarc: Indoorlocation sensing using active rfid. In PERCOM ’03: Proceedings ofthe First IEEE International Conference on Pervasive Computing andCommunications, page 407, Washington, DC, USA, 2003. IEEEComputer Society.7. L. R. Rabiner. A tutorial on hidden markov models and selectedapplications in speech recognition. pages 267–296, 1990.8. I. Rekleitis, G. Dudek, and E. Milios. Multi-robot collaboration forrobust exploration. Annals of Mathematics and Artificial Intelligence,31(1-4):7–40, 2001.9. T. Roos, P. Myllymaki, H. Tirri, P. Misikangas, , and J. Sievanen. Aprobabilistic approach to wlan user location estimation. In Intl J.Wireless Information Networks, vol. 9, no. 3, pp. 155-164, July, 2002.10. S. Y, R. W, and Z. Y. Localization from mere connectivity. InProceedings of the fourth ACM international symposium on Mobilead hoc networking and computing (MOBIHOC 2003),Annapolis,MD,USA, 2003.11. M. Youssef and A. Agrawala. The horus wlan location determinationsystem. In MobiSys ’05: Proceedings of the 3rd internationalconference on Mobile systems, applications, and services, pages205–218, New York, NY, USA, 2005. ACM.33
Spatial coverage vs. sensorial fidelity in VRAlexis Zerroug, Alvaro Cassinelli, Masatoshi IshikawaUniversity of Tokyoalvaro@k2.t.u-tokyo.ac.jpABSTRACTWith this paper we wish to promote a discussion about thedifferent forms that an immersive VR system can take. Thiswill be done by reflecting on a controversial concept: that ofa totally immersive (understood as multimodal) but partial(understood as limited to a part of the body) virtual realityinterface. The proposed concept of total/partial immersivenessmay be seen as a new orthogonal dimension in the taxonomicclassification of systems in the ‘virtuality continuum’introduced in [2]. An interesting aspect of the proposed configurationis the possibility for it to be wearable. We willbriefly describe the motivation for this new taxonomic dimensionfrom a theoretical point of view, as well as explainthe practical reasons that lead us to this concept. This will bedone by discussing earlier work from one of the authors thatillustrates the possibilities of a total immersive VR systembut also pinpoints a number of inescapable limitations.Author Keywordsvirtual reality, immersive system, multi-modal, hapticACM Classification KeywordsH.5.1 Multimedia Information Systems — Artificial, augmented,and virtual realities,H.5.2 User Interfaces — Haptic I/OINTRODUCTIONSince the sixties and pioneered by the Sensorama simulator(a multimodal system created by Morton Heilig in 1962 [3]),lots of immersive systems were developed with differenttechnologies and goals in mind. The main driving force wasperhaps the entertainment industry with its clear goal of immersingthe user as much as possible in a simulated environmentgoverned by laws and rules of a specific gameplay. Inthis context, total immersion could be contemplated as theHoly Grail of Virtual Reality since it would afford the gamerto forget for a moment the (physical or social) constraints ofthe real world. However, researchers on the emerging fieldof Virtual Reality kept innovating with other goals in mindsuch as developing systems for training, learning, medicaltherapy and data visualization. Anticipating the developmentof highly immersion-capable technology, it appearedrelevant to answer the question of how much immersion wasgoing to be really necessary to succeed in each and all ofthese goals. Unsurprisingly, it turns out that the answer isCopyright is held by the author/owner(s). <strong>UbiComp</strong> ’08 Workshop W1 –Devices that Alter Perception (DAP 2008), September 21st, 2008.This position paper is not an official publication of <strong>UbiComp</strong> ’08.Figure 1. photograph of the ‘Time Machine’extremely dependent on each particular goal. Moreover, itsoon became clear that the sense of subjective presence ina virtual environment does not necessarily account for thelevel of objective sensorial immersion [4]. It may even be thecase that immersion in an almost (but not completely) perfectsimulation would provoke the user to distantiate himselffrom the rendered environment (there may be an ’uncannyvalley’ [1] for artificial reality as a whole, not just with respectto realistic humanoid robots). In an effort to clarify therelation between immersion and presence in the virtual environment,as well as related concepts such as coherent spatialperception and realistic interaction, some authors developeda taxonomy of virtual reality systems [2] which is useful asit introduces the concept of a ‘virtual continuum’ spanningthe realm of the completely real to the completely virtualworld, and qualifiy whatever is in between these extremes as‘mixed reality’.We would like to discuss in this workshop the possibility ofa total immersive interface (that is, reproducing with high fidelitymost basic sensorial modalities and therefore belongingsomehow to the totally virtual), whose action is restrictedto a part of the body (and therefore making it impossible toclassify it as an interface completely rendering a virtual environment).There has been a lot of research on enhancing aHead Mounted Display with binaural sound and other kindsof actuators; in a way, such a device would be the archetypeof a total/partial immersive system, but we would like to discussthe possibility of deploying such configuration to other34
Figure 2. Schematic picture of the actuatorsparts of the body (not necessarily encompassing all the sensorialorgans). An example would be a box with an aperturefor introducing a limb: when the user does so, he will experienceas if his arm or leg is in another environment, say,a space filled with water and sea creatures he can touch andfeel as real. Of course, one can argue that body propioception,vestibular sensation and visuospatial input are all basicsenses that a ‘total immersion interface’ should be able toreproduce, and that this is in direct contradiction with theidea of a partial interaction with the body. However, in certaincases this is an apparent limitation: compelling presencewithin the simulated environment may be effective with thissort of interface - even though not all the sensorial apparatusis engaged, in particular thanks to task-oriented (bottomdown)perceptual blindness [5]. Of course, there has beensome research on interfaces capitalizing on the limitationsof human attentional span or the physical limitations inherentto the visual organs (the best known being the foveal displays[5]). We are however interested in another issue: thatof an artificially generated sense of presence of a part of thebody within a virtual environment. Evidence for compellingpartial presence (i.e. partial body relocation) is describedin [6]. Lastly, a practical motivation for the proposed conceptis its compatibility with a wearable realization.TOTAL IMMERSIVE SYSTEMSA total immersive system needs to deal with at least twofundamental problems: the first is how to properly generateartificial sensory stimuli; the other is how to avoid the stimulifrom the real world to interfere with the simulation (i.e.achieving sensory deprivation). Futuristic brain-computerinterfaces may achieve both goals at once (c.f the ‘neuralplug’ in the movie the Matrix, described earlier by pioneeringwriter William Gibson in his 1984 novel Neuromancer).Present day more or less invasive BCI enable elementarymotor control [7] or generate sensations that would overlapwith the external world stimuli if these are present [8], [9].More conventional systems such as the CAVE [10] or HMDbasedVR systems may instead capitalize on real world stimuliin order to enhance the realism of the immersiveness, butthis is done at the expenses of the freedom of the simulation(i.e., one must constrain certain aspects of the simulatedworld such as the orientation on space, gravity and groundtexture). With respect to the CAVE, the HMD-based configurationenables a limited form of body sensory deprivation -Figure 3. redering of the virtual environmentperhaps by immersing the rest of the body in a liquid or makingthe user relax on a bed or chair. The latter approach hasbeen tried in an earlier experiment by one of the authors [11].The intent of the experiment was to create a realistic senseof presence in the virtual world (a WWI battlefield), whileat the same time cutting the subject from the real world sensoryinput. But can we imagine a system capable of totallyimmersing a part of his body in another world, while still capableof creating a (partial) sense of presence and sufficientemotional arousal?EARLIER WORK’Time Machine: VERDUN 1916’ [11] is an immersive systembuild by one of the authors that ‘sends’ users back intime at the site of Verdun (a battlefield during World WarI). The system achieves a high level of immersion thanks toa HMD and number of different actuators described in thefollowing (figure 2).A commercial stereoscopic HMD (the Z800 3DVisor fromeMagin with a diagonal FOV of approx. 40 deg) and inertialhead tracking was used to render the simulated environment(figure 3). Thanks to the information provided bythe inertial sensors, the user was able to look around whiletied on a modified dentist chair. The chair could tilt andvibrate as a whole (to simulate explosions) then providingsome form of vestibular stimulation, and was also coveredwith dozens of tactile actuators to simulate the ground texture(as the wounded avatar was being dragged on the floor).A belt covering the torso was fit with sixteen vibrators andwas used to render the footsteps of a rat walking over thelying body (figure 4).The HMD is fitted with noise cancelling ear bud speakers,but a pair of large isolating headphones seemed more efficientin reducing interferences from the real environment.Additional speakers and a subwoofer were used to renderlow frequency sounds produced by the shock waves of virtualexplosions. Since air flow can greatly enhance the feelingof presence on an open (virtual) space, a fan was installedto simulate wind as well as heat waves. Finally, an air-pump35
connected to a box containing chemicals (figure 5) wouldbring the smell of powder and dead corpses.DISCUSSIONA subject having tried the system says: ”I’ve never beenimmersed in such a way. I’ve never been emotionally immersed,and that’s really an incredible experience. That’sexactly the kind of immersion I was waiting for in a virtualworld. There was no interactivity apart from the head movement,but maybe thats the reason why it worked” [12].This comment is enlightening: the experience is believableprecisely because the story being simulated matches the limitationsof the interface: the subject is a wounded soldier,and as such cannot move. There may be many cases whena proper design can get around the limitations of the interface(in this case, it’s inability to arbitrarily generate artificialpropioceptive stimulation); however, one problem facedwith the Verdun simulator was its bulkiness, immobility aswell as the necessity of one or more technical operators fora unique subject in the machine.Figure 4. photograph of the vibrators inside the chair and the beltThe Time Machine was exhibited at the 2007 Laval Virtualinternational conference on VR. During a five day long exhibition,more than 300 people tried this immersive experience.Nobody was indifferent and some people were disorientedfor a couple of minutes when ’coming back to thereality’. Also, two individuals asked to stop the ‘Time Machine’because they grew scared. But of course, the machinewas not conceived to function as a ghost train in a fun fair:there was no gratuitous surprise, nor rendering of blood orexplicit scenes of fighting. One can wonder what aspect ofthe experience was more scary for these people: the emotionnalycharged context (i.e. the simulated battlefield), orthe fact that they were immersed in a realistic, multimodalVR environment for the first time in their lives. From thetechnical point of view, this experiment demonstrates thatlow-cost immersive systems are not dreams anymore; also,it shows that the combination of a relatively low number ofdiscrete multi-modal actuators is enough to create a completelyimmersive experience and make forget the low viewangle of the HMD for example.CONCLUSIONThere is some evidence that realistic auditory and hapticstimuli might be more important than realistic visuals whentreating some types of phobia using VR systems [13]. Thismeans that a total/partial immersive system not involving thesense of vision may be able to accommodate this type of simulation.An example would be for instance a wearable globeextending on the forearm that would create the impression ofwalking spiders and/or the temperature of virtual bodies. Anearly prototype of such a device is described in figure 6 [14].From the point of view of the taxonomy described in [2], theThe team received two Awards at Laval Virtual; the bestprize of the Student competition and the best prize of theIVRC Jury with an invitation to participate to the final stepof the International Virtual Reality Contest in Japan.Figure 6. photograph of the ‘Ants glove’ [14]Figure 5. photograph of the odor system and the HMDtotal/partial immersive system can be seen as the counterpartof the ‘window-on-the-world’ mixed reality systems (theseare monitor based, non-immersive video displays showingreal scenes upon which computer generated imagery is electronicallyoverlaid). Indeed, the proposed configuration canbe seen as a window on the virtual world, not necessarily encompassingthe visual senses, but instead the rest of the perceptualmodalities. Perhaps a better analogy would be thatof a spatio-temporal wormhole or a portal to another world.It is partial in the sense of it being a window located at aspecific place in (real) space where the user can introduce apart of the body. As said before, this makes compatible the36
notion of partial/total immersion with that of a wearable interface,as opposed with total immersive systems where theuser is completely immersed in the virtual world. An secondpotential advantage of such system could be that if there isan uncanny valley for artificial environments, as suggestedin the introduction, then it may constitute an advantage thatthese systems secure a cognitive distance between the renderedenvironment and the user’s ’reality’.ACKNOWLEDGEMENTWe would like to thank all the people that contributed to theconstruction of the ’Time Machine’: Jrmy Hautreux, PierreLe Gargasson, Benot Malabry and Antoine Lelarge, ClmentMona, Julien Pg, as well as their professors M. Crison andM. LeRenard and M. Geslin. Thanks to Carson Reynolds forinteresting suggestions and feedback.REFERENCES1. Ho, Chin-Chang and Macdorman and Karl F. andPramono, Dwi Z. A. D. Human emotion and theuncanny valley: a GLM, MDS, and Isomap analysis ofrobot video ratings In HRI ’08: Proceedings of the 3rdACM/IEEE international conference on Human robotinteraction, Amsterdam, The Netherlands, (2008),169–1762. P. Milgram and F. Kishino. A Taxonomy of MixedReality Visual Displays. In IEICE Transactions onInformation Systems, volume E77-D (1994).3. M. L. Heilig. Sensorama simulator. Patent 3050870(1962).4. D. A. Bowman and R. P. Mcmahan. Virtual Reality:How Much Immersion Is Enough?. In Computer,volume 40 (2007), 36–43.5. K. Cater and A. Chalmers and P. Ledda. Selectivequality rendering by exploiting human inattentionalblindness: looking but not seeing. In VRST ’02:Proceedings of the ACM symposium on Virtual realitysoftware and technology, ACM (2002), 17–24.6. M. Botvinick and J. Cohen. Rubber hands ’feel’ touchthat eyes see.. In Nature, volume 391 (1998).7. L. R. Hochberg and M. D. Serruya and G. M. Friehsand J. A. Mukand and M. Saleh and A. H. Caplan andA. Branner and D. Chen and R. D. Penn and J. P.Donoghue. Neuronal ensemble control of prostheticdevices by a human with tetraplegia. In Nature volume442, Nature Publishing Group, 164–171.8. W. H. Dobelle. Artificial vision for the blind byconnecting a television camera to the visual cortex. InASAIO journal, American Society for Artificial InternalOrgans (2000), 3–9.9. T. Maeda and H. Ando and M. Sugimoto. VirtualAcceleration with Galvanic Vestibular Stimulation inVirtual Reality Environment. In VR ’05: Proceedings ofthe 2005 IEEE Conference 2005 on Virtual Reality,IEEE Computer Society (2005), 289–290.10. C. Cruz-Neira and D. J. Sandin and T. A. DeFanti andR. V. Kenyon and J. C. Hart. The CAVE: audio visualexperience automatic virtual environment. In Commun.ACM, ACM (1992), 64–72.11. C. Mona and A. Zerroug and J. Hautreux and P. LeGargasson and B. Malabry and J. Pégé and A. Lelarge.Time Machine: VERDUN 1916.http://www.time-machine.info/, ESIEA / ESCIN(2007).12. S. Kuntz. A VR Geek Blog / Laval Virtual 2007.http://cb.nowan.net/blog/2007/04/23/laval-virtual-2007/13. A. S. Carlin and H. G. Hoffman and S. Weghorst.Virtual reality and tactile augmentation in the treatmentof spider phobia: a case report.. In Behaviour researchand therapy, volume 35 (1997), 153–158.14. K. Sato and Y. Sato and M. Sato and S. Fukushima andY. Okano and K. Matsuo and S. Ooshima and Y.Kojima and R. Matsue and S. Nakata and Y. Hashimotoand H. Kajimoto. Ants in the Pants HOW?.http://www.mushi-how.com/, The University ofElectro-Communications (2008).15. S. Bouchard and S. Côté and J. St-Jacques and G.Robillard and P. Renaud. Effectiveness of virtual realityexposure in the treatment of arachnophobia using 3Dgames. In Technol. Health Care, IOS Press (2006),19–27.37
Ubiquitous Systems Evaluation (USE ‘08)Graeme Stevenson and Steve NeelySystems Research GroupUniversity College Dublin, Ireland{graeme.stevenson, steve.neely}@ucd.ieChristian KrayICCHS and School of Computing ScienceNewcastle University, Newcastle upon Tyne, UKc.kray@ncl.ac.ukINTRODUCTIONFollowing on from last years’ successful workshop inInnsbruck, USE '08 brings together practitioners from awide range of disciplines to discuss best practice andchallenges in the evaluation of ubiquitous systems.Experience has shown that evaluating ubiquitous systems isextremely difficult; approaches tend to be subjective,piecemeal or both. For pragmatic reasons, individualapproaches to evaluation risk being incomplete andcomparisons between systems can be difficult. Thereforethe development and adoption of standard evaluationstrategies is essential in order to quantify the contribution ofnew techniques objectively. Without such techniques, thestate of the art remains unclear.Six high quality submissions were accepted to this years’workshop. Each of which went through a selection processconsisting of multiple peer reviews by members of theprogramme committee. The workshop includedpresentations of these papers and group discussions on theissues facing the advancement and adoption of evaluationtechniques in the ubiquitous systems community.The organisers would like to thank the Program Committeefor their contributions to this workshop, all of the authors,and the workshop participants. The workshop website islocated at http://www.useworkshop.org.PROGRAMME COMMITTEE• Kay Connelly (University of Indiana)• Lorcan Coyle (University College Dublin)• Richard Glassey (University of Strathclyde)• Robert Grimm (New York University)• Jeffrey Hightower (Intel Research)• Marc-Olivier Killijian (LAAS-CNRS)• Ingrid Mulder (Rotterdam University andTelematica Instituut)• Nitya Narasimhan (Motorola)• Trevor Pering (Intel Research)• Aaron Quigley (University College Dublin)• Anand Ranganathan (IBM Research)• Katie A. Siek (University of Colorado)• Ian Wakeman (University of Sussex)PUBLICITY CHAIR• Adrian Clear (University College Dublin)38
A Quantitative Evaluation Model of Group User ExperienceZhu Wang, Xingshe Zhou, Haipeng Wang, Hongbo Ni, Ruijuan WuSchool of Computer ScienceNorthwestern Polytechnical UniversityXi’an 710072, Shaanxi, P. R. Chinatransitwang@gmail.comABSTRACTThis paper explores the problem of user experienceevaluation, in particular the quantitative evaluation of groupuser experience, in the ubiquitous computing environments.Firstly, the classification and definition of four differentcategories of user groups are proposed and the notion ofgroup user experience is introduced. Secondly, we analyzethe quantitative evaluation of group user experience fordifferent user groups and establish a uniform evaluationmodel for group user experience. Particularly, we employtwo quantitative metrics, user rating and user attentionduration, as the main criteria for evaluating user experience.At the same time, the intercommunication and differencesamong group members in the capacity of informationacquisition, the degree of correlation with other membersand the weight of impact to the overall group userexperience are taken into account to form a generalquantitative evaluation model of group user experience fordifferent user groups. Finally, we evaluate the effectivenessof the proposed model with preliminary experiments.Author KeywordsUbiquitous computing, evaluation model, group userexperienceACM Classification KeywordsC.4 [Performance of Systems]: Modeling Techniques, H.5.3[Information Interfaces and Presentation]: Group andOrganization Interfaces—Evaluation/methodology, I.6.5[Simulation and Modeling]: Model Development.INTRODUCTIONWith the rapid development of ubiquitous computingtechnology, the evaluation, especially the quantitativeevaluation, of ubiquitous computing systems has become animperative research topic. However, the evaluation ofubiquitous computing systems is extremely difficultbecause of the inherent characteristics of these systems,such as adaptability, heterogeneity and invisibility.Ubiquitous computing takes a user-centered approachthat focuses on providing users with personalized services,such as personalized item recommendation, personalizedinformation presentation, etc., in an unobtrusive way. Itaims at creating more attractive and more personalized userexperience, therefore the evaluation of user experienceCopyright is held by the authors.<strong>UbiComp</strong> '08 Workshop W2 -- Ubiquitous Systems Evaluation (USE '08)September 21st, 2008This position paper is not an official publication of <strong>UbiComp</strong> '08.become an important aspect of ubiquitous systemsevaluation. Furthermore, individuals tend to be members ofgroups. For instance, an investigation about the museum,which has been widely adopted as a validation platform forubiquitous computing technologies, showed that only 5%visitors went to the museum all alone, while 45%participated in a guided tour, 30% came with children and20% went to the museum with friends [8]. As a consequent,in order to certify whether ubiquitous computing systemshave enhanced experiences of both individuals and groupseffectively, evaluation models for user experienceespecially group user experience become indispensable.This paper attempts to build a uniform quantitativeevaluation model for group user experience, based on thein-depth analysis of the concept of user experience and theclassification of user groups. We employ two quantitativemetrics, user rating and user attention duration, as the maincriteria for evaluating user experience, and at the same timetake into account both the intercommunication and thediversity among group members (e.g., the receptivity ofinformation, the familiarity with the other members and theimpact extent to the group) to form a general quantitativeevaluation model of group user experience for different usergroups.The rest of this paper is organized as follows: Section2 discusses previous work relevant to this paper. In section3, we present the classification of user groups and thenotion of group user experience. Section 4 describes theevaluation model of group user experience according todifferent user groups and proposes a uniform model ofgroup user experience for different user groups. Preliminaryexperiments are presented in section 5. Finally, Section 6concludes the paper.RELATED WORKA very limited number of research works have beenconducted on the quantitative evaluation of user experienceby so far. Masthoff, J. et al. [5] discussed, based onInteractive TV, the quantitative evaluation of satisfactionexperienced by individuals when sequences of TVprograms are recommended according to different kinds ofalgorithms. This work aimed to model and to predict thesatisfaction experienced by individuals, where satisfactionis treated as an affective state. It proposed modifications tothe algorithms to deal with the effect on an individual’ssatisfaction of that of others in the group. As for thequalitative evaluation of user experience, several39
frameworks with respect to different aspects of concernhave been proposed. Cawthon, N. et al. [2] put forward aconceptual model to evaluate the aesthetic effect withinuser experience, and suggested that it was imperative todevelop a user-centered evaluation method that concernsmore than task efficiency metrics. Mahlke, S. et al. [4]proposed a research approach to the experimental study ofemotional experience and its connections to othercomponents of user experience, and put forward a model ofuser experience that integrates interaction characteristics,instrumental and non-instrumental quality perceptions,emotional user reactions and overall judgments of systemquality. Mourouzis, A. et al. [7] presented a qualitativeevaluation framework for specifying and measuring the useroriented interactive products and especially emphasized thedeterminant influence that accessibility performs when itcomes to the evaluation of user experience.All the above mentioned evaluation models for userexperience have several common grounds. First, all thesemodels concentrate on the evaluation of individual userexperience, and none of them deals with the evaluation ofgroup user experience. Secondly, most of these modelsemphasize the importance of the emotion factor, which issomething quite difficult to evaluate, while seldom havethey analyzed or evaluated user experience from theperspective of knowledge acquisition. Lastly, all thesemodels, except for the one proposed in [5], evaluate userexperience in a qualitative rather than a quantitative manner.The main difference between our work and the existingones is that we focus on the quantitative evaluation of groupuser experience from the perspective of knowledgeacquisition.DEFINITION AND ANALYSIS OF GROUP USEREXPERIENCEUser ExperienceTo build an evaluation model of group user experience, wemust understand the meaning of user experience. Variousdefinitions of user experience have been proposed.Cawthon, N. et al. [2] argue that user experience is “asubject commonly tied to interactive applications –typically software and web interfaces which holisticallydescribes the relationship a user has when using anapplication and the resulting product of this interaction”;Goto, K. [3] defines user experience as “the overallperception and comprehensive interaction an individual haswith an company, service or product”; and in Wikipedia[11], which is a free web-based on-line knowledge base,user experience is defined as “a term used to describe theoverall experience and satisfaction a user has when using aproduct or system”.From these definitions, we can safely draw aconclusion that user experience is something people feelbefore, during and after they have interacted with a system,service or product, in that, user experience is to some extentan emotional state. However, considering that emotion issomething really difficult to evaluate, in this paper wewould not concentrate on the emotional aspects when itcomes to user experience, but rather on user’s knowledgeexperience, where knowledge comprises the user’s cultural,historical and aesthetic acquisitions. For instance, whenvisiting a museum, the user experience mainly refers to theexperience aroused by the cultural and historical knowledgeacquired from the exhibits.Classification of User GroupsGenerally speaking, the relationship and familiarity amongmembers in different kinds of user groups vary from one toanother, leading to distinct individual behaviors in differentgroups. For instance, when visiting museums with a touristgroup, people tend to concentrate on the nature and thecontent of the exhibits, and there is hardly anyintercommunication as their attention is more focusedtowards what they see than towards their own social group.On the contrary, people touring with their family wouldtypically focus on their family members, trying to make theexhibition understandable and the visit enjoyable. On theother hand, when touring with friends, people are usuallyconcerned not only with what they see but also theintercommunion with their friends.Considering the diversity of user groups, it is useful tocategorize them in a systematic manner that makes it easierto distinguish and comprehend and also facilitate theevaluation of group user experience. We, therefore,introduce a classification scheme for user groups based onthe criteria of whether the positions of group members areequal and how familiar group members are with each other.Thereby, user groups can be divided into homogeneousgroups and heterogeneous groups according to therelationships among group members. Homogeneous groupsrefer to the groups in which positions of members are equaland members have the same privileges. Friends and touristgroup belong to this kind of groups. On the other hand,heterogeneous groups are defined as groups in whichmembers are unequal and have different privileges. Familyis of this kind of groups. Similarly, according to the extentof group members’ familiarity to each other, user groupscan be divided, in another dimension, into tightly coupledgroups and loosely coupled groups. Tightly coupled groupsare those whose members are close to each other and theintercommunication plays an important role. Family andfriends fall into this type. On the contrary, loosely coupledgroups refer to the groups in which members are relativelyestranged and the intercommunication is not so frequentand important. Tourist group is of this kind.As a consequence, we introduce four distinctcategories of user groups — the tightly coupledhomogeneous groups, the loosely coupled homogeneousgroups, the tightly coupled heterogeneous groups and theloosely coupled heterogeneous groups.Group User ExperienceUsers can be either individuals or members of groups;similarly, user experience can be categorized into eitherexperience of an individual user or the overall experience of40
a group of users. We, therefore, introduce the concept ofgroup user experience. In contrast to individual userexperience that describes an individual’s experience ofknowledge, culture, history or aesthetics, group userexperience describes the overall experience acquired by auser group, including not only each member’s directindividual experience but also the indirect experienceacquired through intercommunication among groupmembers. For instance, suppose that you are visiting amuseum together with several friends, you can acquireexperience from what you see, which is direct experience,and at the same time you can also acquire experience fromwhat your friends see through intercommunication withthem which is indirect experience. Group user experience isthe composite of both each group member’s directexperience and indirect experience.Apparently, different types of user groups would resultin different kinds of evaluation models of group userexperience. Consider tightly coupled heterogeneous usergroups, such as a family, children are superior to theirparents when they visit a museum because, as we havementioned above, parents do not care what they seethemselves so much as what their children see. From thispoint of view, the experience of children is just theexperience of their parents. Therefore, the evaluation modelof this kind of user groups should give a heavier weight tothe members with higher priority than the others and shouldtake the intercommunication among members into account.On the other hand, the evaluation model of loosely coupledhomogeneous groups should give the same weight to eachmember and should not calculate the intercommunication.In the following section, we will introduce a generalquantitative evaluation model of group user experiencewhich is suitable for different kinds of user groups.QUANTITATIVE EVALUATION MODEL OF GROUPUSER EXPERIENCEAt the beginning of this section, we list the notations to beused in the evaluation model as follows. G : a user group. u : a group member. i : a item. R( ui , ) : the rating for item i given by groupmember u . Impact( u, i ): the revised rating for item i given bygroup member u . Au ( ) : the items that have been visited by groupmember u . AG ( ): the items that have been visited by any memberof group G . Gi (): the members who have visited item i . Eui ( , ): the experience of user u acquired from itemi . Eu ( ): the direct experience of user u . Eu ( ) : the indirect experience of user u . EG ( ): the overall experience of user group G .Quantitative Evaluation of Individual User ExperienceWe first introduce the quantitative evaluation model ofindividual user experience. For quantitative evaluation,quantitative parameters must be selected in advance.Currently, the most widely used evaluation parameter isuser rating, which thereby is also adopted as one of theparameters in this paper. One hundred scales, from 1 (thelowest experience) to 10 (the highest experience), aredesigned for the value range of user ratings. To improveaccuracy, user ratings are revised via the following twosteps.Normalization. It is possible that an individual’s rating maybe too low or too high. This can be revised throughnormalization. We apply normalization to user ratings asfollow. Rvi (,)vG()iGroupAverRating() i | Gi ( )|, i A( u), (1) R( ui , )iA( u)IndividualAverRating( u)| Au ( )|, (2)R( u, i) GroupAverRating( i)Normalized( R( u, i)) , i A( u).IndividualAverRating( u)(3)In the above equations, GroupAverRating()i is theaverage rating for item i given by members of groupGi () and IndividualAverRating( u ) is the average ratingof user u .Making the rating quadratic. An investigation by Masthoff,J. showed that the relationship between user experience andthe ratings they give are not linear, that is, for example, thedifference between the rating 6 and rating 7 is not the sameas the difference between the rating 9 and 10. Quadratic is abetter measurement than linear [6]. We use the followingequation to apply quadratic.Quadratic( R(,)) u i R(,) u i R( u,)i . (4)Combining equations (3) and (4), we have the reviseduser rating Impact( u, i ) asImpact( u, i) Quadratic( Normalized( R( u, i))). (5)After revision through the above mentioned two steps,Impact( u, i ) is a more accurate evaluation parameter thanthe original user rating. However, even though two usersgive the same ratings to a certain item, it is still very likelythat their experiences on this item are different. This may becaused by several distinct factors, an important one ofwhich is the user attention duration. So, besides user ratings,we import the user attention duration as another evaluationfactor. In this paper, we introduce user attention duration41
though Tui ( , ) / Toi ( ) , in which To( i ) is the averageattention duration of historical users on item i , and Tui ( , )is the attention duration of user u .Combining the user rating and the user attentionduration, we define the experience of user u on item iasTui ( , )Eui ( , ) Impactui ( , ) . (6)To()iBased on equation (6), we introduce the definition ofindividual user experience asTui ( , )Eu ( ) Eui ( , ) Impactui ( , ) . (7)To()iiA( u) iA( u)Quantitative Evaluation of Group User ExperienceAs we have mentioned, group user experience include notonly each member’s direct experience but also indirectexperience. In other words, group user experience is thesum of each member’s direct experience and indirectexperience. At the same time, different types of user groupswould result in different kinds of evaluation models ofgroup user experience. In this section, we will discuss thequantitative evaluation of group user experience accordingto the four different types of user groups.Case 1: Tightly Coupled Homogeneous GroupsFor a tightly coupled homogeneous group, on the one hand,the relationships among members are equal and themembers have the same privileges. This means that eachmember’s direct experience has the same weight in theevaluation model of group user experience. On the otherhand, members are close to each other and theintercommunication plays an important part, so the indirectexperience should be taken into account in forming groupuser experience. We define the quantitative evaluationmodel of group user experience for this kind of user groupsasEG ( ) [ Eu ( ) Eu( )] , (8)withuGTi () E( u) ( u) Impact( u, i), and ( u)To()iiA( G)iA( u)( 0 ( u) 1 ) is the receptivity of user u whencommunicating with the other members; Impact( u, i) isthe revised average rating for item i given by groupmembers who have visited item i ; Ti ( ) is the averageattention duration of item i given by group members whohave visited item i .Case 2: Loosely Coupled Homogeneous GroupsSimilarly to the tightly coupled homogenous group, on theone hand, members of a loosely coupled homogenous grouphave the same privileges and each member’s directexperience has the same weight in the evaluation model. Onthe other hand, members of this kind of groups areestranged to each other and the intercommunication can beignored. Therefore, we define the quantitative evaluationmodel of group user experience for this kind of user groupsasEG ( ) Eu ( ). (9)uGCase 3: Tightly Coupled Heterogeneous GroupsFor a tightly coupled heterogeneous group, on the one hand,the relationships among members are unequal and membershave different privileges. This means that each member’sexperience has different weight in the evaluation model. Onthe other hand, members are familiar to each other and theintercommunication plays an important part, so the indirectexperience should be taken into account. We define thequantitative evaluation model of group user experience forthis kind of user groups asEG ( ) { ( u) [ Eu ( ) Eu( )]} . (10)uGIn equation (10), ( u)( 0 ( u) 1 ) is theinfluence of user u to the overall group user experience.Case 4: Loosely Coupled Heterogeneous GroupsSimilarly, the evaluation model of group user experience forloosely coupled heterogeneous groups is defined asE( G) [ ( u) E( u)]. (11)uGIt must be pointed out that although group members oftightly coupled user groups are familiar to each other,generally speaking, during their intercommunication not allthe items are discussed, maybe only those most impressingand interesting items are involved. This means that theindirect experience a user acquired is usually less thanEu ( ) as defined in equations (8) and (10). Therefore, weintroduce a parameter (0 1 ) to describe thediscussion lever of a user group, where relates to thefamiliarity extent of group members. Similarly, for aloosely coupled user group, although its members areestranged to each other, there still is intercommunicationand the indirect experience should been taken into account.As a consequence, the evaluation model of group userexperience for two types of homogenous user groups can bedefined in a uniform format asE( G) [ E( u) E( u)] . (12)uGSimilarly, the evaluation model of group userexperience for two types of heterogeneous user groups canbe defined in a uniform format asEG ( ) { ( u) [ Eu ( ) Eu( )]} . (13)uGAccording to equations (8)-(13), we find thatquantitative evaluation models of group user experience fordifferent types of user groups have a similar format. In fact,equation (12) is a special modality of equation (13), wherethe value of ( u)is 1. Therefore, the quantitativeevaluation models of group user experience for fourdifferent categories of user groups can be expressed in auniform format using equation (13).42
During the above discussion, user groups are dividedinto four categories, and the quantitative evaluation modelof group user experience for each kind of group has beenstudied separately. However, an actual user group could bemuch more complex, and a single user group may includeseveral independent and distinct subgroups, for instance, atourist group may comprise several subgroups of family andfriends. For such complex and mixed groups, the evaluationmodel will become much more complicated. Inspired by [1]in which a method for combining subgroups’ preferenceshave been proposed, we divide a mixed group into severalsubgroups and each subgroup falls into one of the fourgroup types previously defined. The experience of eachsubgroup is calculated separately and the overall experienceis acquired by aggregating each subgroup’s experience.Evaluation model of such user groups is defined asEG ( ) ( Gi) EG(i), (14)Giwith ( G i) represents the influence of subgroup G ito| Gi|the whole group and ( Gi) ( Gi) , where| G | ( G i)(0 ( G i) 1) is the weight of subgroup Gi.PROTOTYPE IMPLEMENTATION AND EXPERIMENTThe museum has proved to be an effective platform for thedemonstration and evaluation of innovative ubiquitouscomputing techniques, because of the inherent mobility ofpotential users, a wide diversity of attractive materials forpresentation, and the potentials of tourism and associatedmarkets [9].We have developed a prototype system of intelligentmuseum named iMuseum to evaluate ubiquitous computingtechniques [10]. It provides adaptive and personalizedservices, such as route navigation, exhibit recommendationand information presentation, on both the individual andgroup level. In iMuseum, the primary goal is to produce amultifaceted system that accompanies visitors andaugments their overall museum experience. In order tovalidate the evaluation model of group user experienceproposed in this paper, we designed an experiment based oniMuseum.Experimental DesignWe assume that a group of three visitors (Jim, Eva and Ben)are visiting the museum and this group may fall into one ofthree different categories, i.e. family, friends and tourists.They have visited ten exhibits (marked A-J) and theirratings have been given in Table 1, where blanks denotethat the visitor did not visit that exhibit. The ratings rangefrom 1 to 10, and a larger rating represents a betterexperience.According to group types, we have designed threedifferent scenes for our simulative visitors to mark theiroverall experience:Scene 1: Assume that Jim and Eva are husband andwife, and Ben is their child. The simulative visitors arerequired to give the perceived overall experience of thesethree persons respectively.Scene 2: Assume that Jim, Eva and Ben are peerfriends. The simulative visitors are required to give theperceived overall experience of these three personsrespectively.Scene 3: Assume that Jim, Eva and Ben are membersof a tourist group and they did not know each other beforethis tourism. The simulative visitors are required to give theperceived overall experience of these three personsrespectively.A B C D E F G H I JJim 8 7 6 7 4 3 7Eva 7 7 6 10 8 2 9Ben 9 8 8 10 6 8 9 8Table 1. Ratings by a group of three viewersExperimental Results and DiscussionAs a preliminary experiment, we did a survey on fifteensimulative visitors asking them to give their perceivedoverall experience of Jim, Eva and Ben respectivelycorresponding to the three scenes designed above. Theresult of the survey is showed in Table 2.Scene 1 Scene 2 Scene 3Jim Eva Ben Jim Eva Ben Jim Eva Ben8 9 9 8 8 9 7 8 98 9 10 7 8 8 7 8 86 7 8 6 6 7 5 6 78 8 9 8 8 8 6 7 87 7 9 6 7 8 7 7 87 7 8 6 8 8 9 8 98 8 9 7 8 9 8 9 98 9 9 7 8 9 7 8 87 7 8 7 8 9 7 7 87 8 9 7 8 9 7 8 88 9 9 7 8 9 6 7 98 9 9 7 8 8 5 7 88 8 9 8 8 8 7 8 87 8 9 7 8 9 7 6 86 7 8 7 8 9 7 7 87.4 8 8.8 7 7.8 8.5 6.8 7.4 8.224.2 23.3 22.4Table 2. Experimental data in the three scenes43
Analyzing the experimental data, we can draw thefollowing conclusions:1) For a given role, her (his) average ratings differ fromone scene to another. In the case at hand, scene 1receives the largest rating, with scene 2 the moderateand scene 3 the smallest. This indicates that individualuser experience varies with scenes, and this variance isprobably due to the different relationship andfamiliarity among the group members.2) For a given scene, the average ratings differ from onerole to the other. In this experiment, Jim gives thesmallest rating, with Eva the moderate and Ben thelargest. At the same time, it is noticed that the averageoverall ratings of these three individuals are uniformlylarger than their corresponding original ratings. Thisshows that the individual experience of a groupmember comprises not only the direct experience butalso the indirect one.3) The group user experience differs from one scene tothe other. In this case, scene 1 owns the largest rating,scene 2 owns the moderate one, and scene 3 owns thesmallest rating. It shows that group user experience isrelevant to the group types, and that the experience oftightly coupled groups is usually better than that ofloosely coupled groups.It should be mentioned that this is a preliminaryexperiment. Only part of the proposed model has beenvalidated, and values of several parameters in the model,such as and , have not been given. Our future work willconcentrate on more delicate experiments to decide theparameter values empirically.CONCLUSIONOur work focused on the quantitative evaluation of groupuser experience, especially the user’s knowledge experience,where knowledge comprises the user’s cultural, historicaland aesthetic acquisition. The main contribution of thispaper was the provision of a uniform quantitativeevaluation model of group user experience for differenttypes of user groups, in which user rating and user attentionduration were employed as two quantitative evaluationfactors, and both the intercommunication and the diversityof group members were taken into account. Finally, we dida preliminary experiment which partly validated theeffectiveness of the proposed evaluation model of groupuser experience.ACKNOWLEDGEMENTSThis work was partially supported by the National HighTechnology Research and Development Program of Chinaunder Grant No. 2006AA01Z198, the Doctoral Fund ofMinistry of Education of China under Grant No.20070699014, and the Innovation Fund of NorthwesternPolytechnical University of China under Grant No.2006CR13. The authors thank all the members fromUbiquitous Computing Lab of NWPU for their discussionand implementation of the system.REFERENCES[1] Ardissono, L., Goy, A., Petrone, G., et al. Tailoring therecommendation of tourist information to heterogeneoususer groups. Hypermedia: Openness, structural awareness,and adaptivity, Springer (2002), 280-295.[2] Cawthon, N., Moerem, A. V. A Conceptual Model forEvaluating Aesthetic Effect within the User Experience ofInformation Visualization. In Proc. IV 2006, 374-382.[3] Goto, K. Brand value and the user experience. DigitalWeb Magazine, 2004[4] Mahlke, S., Thüring, M. Studying Antecedents ofEmotional Experiences in Interactive Contexts. In Proc. ofthe SIGCHI conference on Human factors in computingsystems, ACM Press (2007), 915-918.[5] Masthoff, J., Gatt, A. In pursuit of satisfaction and theprevention of embarrassment: affective state in grouprecommender systems. User Modeling and User-AdaptedInteraction, Kluwer Academic Publishers (2006), Hingham,MA, USA, 281-319.[6] Masthoff, J. Group modeling: selecting a sequence oftelevision items to suit a group of viewers. User Modelingand User-Adapted Interaction, Kluwer AcademicPublishers (2004), Hingham, MA, USA, 37-85.[7] Mourouzis, A., Antona, M., Boutsakis, E., et al. AUser-Orientation Evaluation Framework: AssessingAccessibility throughout the User Experience Lifecycle.Computers Helping People with Special Needs, SpringerVerlag (2006), 421-428.[8] Petrelli, D., De Angeli, A., and Convertino, G. A UserCentered Approach to User Modelling. In Proc. UM 99,Springer Wien New York (1999), 255-264.[9] Ryan, N., Cinotti, T., and Raffa, G. Smart Environmentsand their Applications to Cultural Heritage. <strong>UbiComp</strong> 2005Workshop: Smart Environments and Their Applications toCultural Heritage, Tokyo, September 2005.[10] Yu, Z., Zhou, X., Yu, Z., et al. iMuseum: A ScalableContext-Aware Intelligent Museum System. ComputerCommunications, Elsevier Press, 2008.[11] http://www.wikipedia.org/44
Usability Study of Indoor Mobile Navigation Systemin Commercial FacilitiesYutaka Inoue, Takeshi Ikeda, Kiyoshi Yamamoto,Tomohisa Yamashita, Akio Sashima and Koichi KurumataniNational Institute of Advanced Industrial Science and Technology (AIST) / CREST, JST2-41-6 Aomi, Koto, Tokyo 135-0064, Japanyutaka.inoue @aist.go.jpABSTRACTIn this paper, we describe a field experiment of an autonomousmobile system to navigate users and to estimate theself-position indoors, where it is impossible to receive aGPS signal. Many users utilize positional information systemsof GPS. However, because positional informationcomputed using GPS signal is available only in the locationswith satellite signal reception, it is difficult to use GPSfor positioning in indoor environments. Therefore, we havedeveloped an indoor navigation system to provide ubiquitousinformation service like that of a portable navigationsystem that can be used inside commercial and office buildings.The navigation system can display user’s position thatis estimated by beacon signal using license-free radios. Wecarried out a field experiments in large-scale commercialfacilities to evaluate the usability of the navigation interfaceand availability of the indoor navigation service on a smartphone. As a result, we found that the users would like tohave some functions of indoor navigation systems.Author KeywordsPositioning, Position estimation, Indoor navigation, Smartphone,Cell phone, Wireless beaconACM Classification KeywordsC.5.5 [Computer System Implementation]: ServicesINTRODUCTIONWhen considering various services for mobile terminal usingsystems like our indoor positioning system, we mustconsider what services the users’ preference, functions ofthe service, the operation interface, and the screen view. Forinstance, human-navigation services in outdoor environmentsrarely require notice to users about vertical movementsor positions. However, in indoor public spaces,where it is impossible to use GPS, such as commercial facilities,users might use elevators and escalators to go to thetarget location.Copyright is held by the authors.<strong>UbiComp</strong> '08 Workshop W2 -- Ubiquitous Systems Evaluation (USE '08)September 21st, 2008This position paper is not an official publication of <strong>UbiComp</strong> '08.For a usability study of indoor navigation services, we conducteda field experiment in large-scale commercial facilitiesto investigate the usability of the indoor navigation serviceon a mobile terminal. Our indoor navigation systemmight be developed so that it can guide a user around commercialfacilities. Moreover, the system must be evaluatedby typical users.We describe the usability of an indoor navigation system ona smart phone to use position information in an indoor environment,and results of the experiment. Furthermore, wediscuss effective indoor navigation functions and the interfaceconsidering users’ opinions obtained through the experiment.FEATURES OF THE INDOOR NAVIGATION SYSYTEMWe have developed an indoor navigation system consideringusability. The indoor navigation system service has thefollowing features. Showing the current position of the user in a floor map. Changing the floor map according to the user’s position.Showing routes from a current position to a destination.Figure 1 shows a user’s current position expressed using acircle in the center of the display screen. As the user movesfrom left to right on a floor, the user’s position in the screenis updated by the navigation system. Moreover, when theuser moves to another floor, the system automatically recognizesthe current floor and changes the user terminal mapto the floor map.Usually, a navigation route is displayed on a floor map onthe terminal screen as shown in Fig. 2(a). When the userreaches the points of navigation events, such as an intersectionon the route or in front of an escalator or elevator, aguidance picture like that shown in Fig. 2(b) is displayed onthe screen along with a beep sound. The screen presentsguidance to lead the user to the destination. The guidance isshown using multimedia: natural language, pictures (e.g.,icons, arrows), and photographs of the location. Consequently,the user can reach the destination merely by followingthe guidance. Advice by the screen announcementincludes right turn, left turn, floor changing via escalator orelevator, and destination arrival.45
transmitted from radio beacon devices installed in indoorenvironments. The radio beacon device is small and lightweight.Therefore, it is possible to attach it in an inspectiondoor on the ceiling. A beacon receiver to be carried with theuser is small and cable-less.menu(a) Map View.Figure 1. Example of Positioning Result.The battery-driven radio beacon devices areinstalled in environment. Beacon devicestransmit beacon signals (license-free radios).Beacon1Beacon4User’s deviceBeacon2Beacon signal receiverPlease go to thediagonally forwardleft, and up to byescalator.Please go to thefourth floor.Beacon5BluetoothconnectionBeacon6User’s deviceRestroom for babiesBeacon3User’s deviceMobile information device(Cell phone or smart phone)Figure 3. Architecture of Positioning System.As depicted in Fig. 3, the position is estimated on a smartphone with a beacon receiver that receives signal data4FHere is baby’s roomfor changing diapers.(b) Navigation View. (c) Arrival Guide.Figure 2. Example of Routing Guide Screen.EXPERIMENT IN COMMERCIAL FACILITIESIn this experiment, we intend to collect diverse opinionsfrom ordinary users. The users actually operated the userterminal of the indoor navigation system in the building andreported widely various opinions about the navigation system.Experiment EnvironmentWe conducted an experiment to investigate users’ demandsfor the service in a large-scale commercial building. Thebuilding is known as not only as a shopping center but alsoas a sightseeing area in Yokohama City. We selected thebuilding so that the participants in the experiment would beable to seek and obtain various services in the real world.To guide the users to various destinations, we created adatabase of locations in the building, e.g., stores, bathrooms,sightseeing spots, and so on. A smart phone with a touchpen interface (FOMA M1000; NTT docomo Inc.) was selectedas the target terminal with which a user can inputmany destinations graphically. The interface is highly interactive;the user merely pushes the intended image on thescreen, such as a picture of a store, using the touch pen.The field experiment was conducted at Yokohama LandmarkPlaza building, which is adjacent to the YokohamaLandmark Tower 1 . As shown in Fig. 4, Yokohama LandmarkPlaza has five floors; each floor in the building hasshops, restaurants, hair salons, and so on. The floor area isabout 10,000 [m 2 ]; the center part of a floor is the blow-by.Therefore, the user can receive the positioning signal sentby the radio beacon devices installed on each ceiling onother floors.Radio beacon devices were installed in the second floor, thethird floor, and the fourth floor: the user can use the navigationsystem from the second floor to the fourth floor. Theradio beacon devices were installed at a ratio of one unit forabout 200 [m 2 ] on those floors. It is not necessary to installthe radio beacon devices uniformly because the user canspecify a self-position if the beacon receiver carried by theuser can receive one or more beacon signals.The field experiment was carried out for five days duringNovember 2007. Several kinds of participants took part inthe experiment. The disaggregated data are of 37 participants:5 students, 27 homemakers, and 5 elderly people.The participants in the experiment move inside the building,using the smart phone and beacon receiver, as shown in Fig.1 Mitsubishi Estate Co. Ltd.: The Landmark Tower Yokohama2-2-1, Minatomirai, Nishi-ku, Yokohama, Japan.46
11%3%0%0%30%19%5%3%0%11%56%Notifyed immediately after watching screen.Notifyed after compairing screen with arround present location.Notifyed after sevral compairing screen with around present location.Notifyed after compairing screen with around present location and walking around.Not notify after compairing screen with around present location and walking around.The other.(a) Guidance screens.62%Always, opportune notice.Generally, opportune notice.Half-and-half opportune notice and ill timed.Generally ill timed.Always ill timed.The other.(b) Guidance timing.0% 3% 3%3%3%0%19%19%35%19%40%Possible to input data immediately and it is very useful.Possible to input, generally understood how to operation.Although usage is unclear, possible to operate,Although ask staffs for the experiment about usage, data input operate own.Impossible to understand, thus all input operation entrust to staffs.The other.(c) Navigation interface.56%I would like to use, even when the receiver is required.I would like to use, if the receiver is miniaturized.I would like to use, if the receiver is unnecessary.Neither necessary nor unnecessary.I do not want to use it.The other.(d) Usage of cell phone.3) The difference of guidance timing also occurs fromprecision error. The error results from the differencebetween a user’s position and estimated position in thesystem. Although the precision of location estimatingchanges according to number of radio beacon units installedin the environment, not many units can be installedin a building as a practical consideration. Forthat reason, other sensors can be attached to the user’sdevice to enhance the positioning precision.(c) User interface.In the questionnaire about an input to smart phone of thedestination of the navigation in experiment, almost all participantsresponded that they were able to understand theFigure 6. Result of Questionnaire in the Experiment.operating instructions and used the navigation function (Fig.6(c)).We consider that anybody can use the input interface easilybecause the interface of the smart phone design is easy tounderstand. For instance, the destination is chosen bytouching a picture images and illustrations of shops, restaurants,and so on.(d) Users’ needs for cellular telephone services.Although users utilized the smart phones prepared for us inthe experiment, we found users’ preference use of the serviceby which the indoor navigation service is also carriedout in a cellular telephone. The questionnaire results depictedin Fig. 6(d) show that about 74% of participants an-48
swered that they would like to use such a system if the beaconreceiver were miniaturized, or if the beacon receiverwere unnecessary.Conversely, it is a minority view that the user would notlike to use the service in a cellular telephone. Therefore,although users’ needs for indoor navigation are high, forpopularization of services, it is important that usage conditionsalso include the device configuration.DiscussionBased on the result of the experiment conducted at YokohamaLandmark Plaza, we can discuss users’ needs for indoornavigation services. Results of the questionnaire toparticipants provided feedback that the users desire use ofthe indoor navigation service if the service can operate inpopular, practically used devices such as cellular telephones.Moreover, in the opinions of participants, users were unsurewhether the walking direction matched the map aspect onthe smart phone’s screen when the user was walking usingthe indoor navigation service, after moving to another floorby escalator or elevator, after turning a corner, and so on.The disorientation occurred because the map screen displayaspect on the user’s terminal is fixed. Although the sense ofdirection depends on the person, in some situations, theusers noticed no difference between a self-direction in thereal environment and the aspect of map displayed on thesmall screen. Also, the floor design of Yokohama LandmarkPlaza has similar architecture throughout the entirearea. To reduce loss of motion by disorientation, heading upof the map through self-direction using an electronic compasssensor in the cellular telephone must be effective,which is our future work for this system.We were acquired users’ opinions about the advantages anddisadvantages of our indoor navigation system becauseevaluated the system by the several kinds of users. The systemwas evaluated by two survey methods, that is, one isdescription format and the other is group discussion. Althoughgroup discussion can hear the detailed opinions ofthe users, the survey method takes much time and energy.In the feature, we would like to consider how to effectiveinterview methods.REATED WORKIn recent years, position information services such as navigationservices have received much attention in the contextof civil life, home life, industry, and so on. In outdoor situations,car navigation systems that specify self-position andwhich provide directions to the destination are useful as asubstitute for human navigators to such locations. Moreover,when advanced traffic information systems [1][2] are appliedto car navigation systems, it is also possible to show aroute with consideration of traffic and accident informationrelated to the present.However, because the systems have difficulty receivingsignals of Global Positioning System (GPS) in indoor environments,some alternative positioning systems are proposedto use GPS in the locations where it is impossible toreceive a GPS signal from real satellites. The Pseudolite-GPS [3] and GPS Re-radiation [4] Systems are well knownas alternative systems to utilize GPS.Pseudolite-GPS is a system using a transmitter that emitsthe pseudo-GPS signal generated by simulations. However,the system has difficulty receiving signals at close distanceand at distant locations from the transmitting antenna.Moreover, it is difficult to obtain correct time synchronizationaccurately between the system and GPS satellites. TheGPS Re-radiation System receives real GPS signals in openfield areas, then forwards them with a cable, and transmitsthem to indoor environments. The system cannot be used inareas that cannot also receive GPS signals outdoors. Additionally,it is necessary to install many GPS receiving antennasoutdoors to raise the position tracking precision.Therefore, various non-GPS methods are often applied toindoor positioning systems. Active Bats [5] and Cricket [6]are techniques that can detect positions by receiving signalssent from transmitter devices. Typically, these systems increasethe number of installed devices if the areas to recognizethe user’s position become broad.In practice, RADAR [7], PlaceLab [8], EKAHAU [9], andAirLocation II [10] are methods using the strength of radioelectric field of Wi-Fi signals. Improving these methods’positioning precision is difficult because the electric fieldstrength becomes unstable for changing of Wi-Fi radiotransmission power. Ubisense [11] uses ultra widebandtechnology (UWB) for positioning, but it is impossible torecognize the self-positions of users on their own portabledevices.We have developed an indoor positioning system in considerationof the shortcomings of the systems described above.The system can operate on a portable information terminalsuch as a cellular telephone by receiving radio beacon signalsfrom beacon devices installed in the environment. Thesystem operates autonomously without server access; theinstalled beacon devices can be driven using batteries attachedto the devices. Consequently, our system also preservesuser privacy.FUTURE WORKSIn our system, a guidance picture is displayed at a pointdistant from a fixed distance. Therefore, we are developinga technique for adjusting guidance points to resolve thisproblem. Moreover, to show guidance pictures with optimizedtiming on the screen, we consider an appending function,which modifies it according to walking speed, whichis acquired in real time by another sensor. Furthermore, weare considering enhancement of the positioning precision toattach other sensors in the user’s device [12]. Future systemsmight incorporate miniaturization of the beacon receiver,integration as IC of the device, and integration withcellular telephones.49
CONCLUSIONFor this study, we have developed a system for an indoornavigation service that is intended for implementation notonly on smart phones but also on cellular telephones.Moreover, we presented results of an experiment in YokohamaLandmark Plaza for an indoor navigation system conductedusing beacon devices.Yokohama Landmark Plaza has a blow-by in the center ofeach floor above the ground floor, which means that it isdifficult for users utilizing the service to recognize motionto another floor. In the building, many customers come toshops and restaurants; the people are passing through usingthe passages. We carried out the experiment to investigatethis indoor navigation service in such a realistic environment.In the experiment, we administered questionnaires to elicitcomments related to experiences of indoor navigation in thecommercial building. Consequently, we acquired usefulopinions related to the navigation system and position informationservices, such as the interface, its operation ability,and the screen information. Moreover, we confirmedthe possibility of correct function for navigation serviceusing indoor position information in this real environment.ACKNOWLEDGMENTSWe thank City of Yokohama, Mitsubishi Estate CompanyLimited, Musashi Institute of Technology, IncorporatedNonprofit Organization VMCY and Vitaminmama CompanyLimited for their cooperation to our indoor navigationexperiment.REFERENCES1. Yamaguchi, M., Kitamura, T., Yoshida, T. , Horiuchi, T.and Takeuchi, K.: "Trial Application of the UTMS DynamicRoute Guidance Systems", In Proc. the 3rd InternationalConfer-ence on Intelligent Tutoring Systems,Orlando, USA (1996).2. Fujimoto, N., Namizuka, T., Takeuchi, K., Kitamura, T.and Ogura, M.: "The Dynamic Route Guidance Systemof Nagano UTMS", In Proc. the 5th International Conferenceon Intelligent Tutoring Systems, Seoul, Korea(1998).3. Stone, J., LeMaster, E.A., Powell, J.D. and Rock, S. M.:"GPS Pseudolite Transceivers and their Applications",Institute of Navigation National Technical Meeting, SanDiego, California, USA (1999).4. HNRRKIT: "Hanger Network GPS Re-Radiating Kit",(http://gpsnetworking.com/) (2008-05-05).5. Addlesee, M., Curwen, R., Hodges, S., Newman, J.,Steggles, P., Ward, A. and Hopper, A.: "Implementing aSen-tient Computing System", IEEE Computer Magazine,Vol.34, No.8, pp.50-56 (2001).6. Priyantha, N. B., Chakraborty, A. and Balakrishnan, H.:"The Cricket Location-Support System", In Proc 6thACM Inter-national Conference on Mobile Computingand Networking (ACM MOBICOM2000), Boston, MA,pp.32-43 (2000).7. Bahl, P. and Padmanabhan, V. N.: "RADAR: an inbuildingRF-based user location and tracking system",IEEE Info-com2000, Vol.2, pp.775-784 (2000).8. LaMarca, A., Chawathe, Y., Consolvo, S., Hightower,J., Smith, I., Scott, J., Sohn, T., Howard, J., Hughes, J.,Potter, F., Tabert, J., Powledge, P., Borriello, G. andSchilit, B. "Place Lab: Device Positioning Using RadioBeacons in the Wild", In Proc. of the 3rd InternationalConference on Pervasive Computing 2005(PERVASIVE2005), Munich, Germany, pp.116-133(2005).9. Ekahau: "Setting the Standard for Wi-Fi based EnterpriseVisibility Solutions", (http://www.ekahau.com/)(2008-06-15).10.AirLocation II:(http://www.hitachi.co.jp/New/cnews/month/2006/07/0713.html) (2008-06-23).11.UbiSense: "Local position system and sentient computing",(http://www.ubisense.net/) (2008-06-24).12.Sashima, A., Inoue, Y., and Kurumatani, K.: "Spatio-Temporal Sensor Data Management for Context-AwareServices", In Proc. of the International Workshop onAdvanced Data Processing in Ubiquitous Computing(ADPUC2006) (2006)50
Clinical Proof-of-Concept –AEvaluation Method forPervasive Healthcare SystemsJakob E. BardramIT University of CopenhagenRued Langgaards Vej 7, DK-2300 Copenhagen, Denmarkbardram@itu.dkABSTRACTPervasive Healthcare – i.e. designing pervasive computingtechnologies for healthcare usage – is an especially promisingarea within pervasive and ubiquitous computing research.However, it is extremely difficult to evaluate suchsystems because establishing clinical evidence for medicalbenefits would require longitudinal, randomized, doubleblind,placebo-controlled trials involving a homogeneouspatient population and medical condition. This would notonly require huge resources in terms of clinical staff and patientparticipation, but would also require the technology tobe fully developed and ready for large scale use. The latteris simply not feasible when doing technological researchinto new types of pervasive healthcare technologies. In thispaper, I suggest the method of ‘Clinical Proof-of-Concept’as a method for evaluating pervasive healthcare technologiesin order to establish the clinical feasibility of the technologybefore entering large-scale clinical trials. The method hasbeen applied in a couple of cases and I report on lessonslearned from this.INTRODUCTIONApplying Ubiquitous and Pervasive Computing technologiesfor healthcare purposes is gaining increasing interest and isgrowing into a research field of its own called ‘PervasiveHealthcare’ [3, 1]. The research questions and the technologiesbeing investigated within Pervasive Healthcare are quitediversified ranging from using biomedical sensor technologyfor patient monitoring and prophylactic treatment, to mobileand context-aware systems inside hospitals. PervasiveHealthcare has a lot in common with established medicotechnicalresearch areas like biomedical engineering, medicalinformatics, and telemedicine, but is distinct in its fundamentalapproach and goals; pervasive healthcare systems areoften designed for patients and not for clinicians, and theyembody technologies growing out of the ubiquitous computingresearch, including sensor technology, context-awareand mobile computing, large interactive displays, etc. Similarto Ubiquitous Computing research, Pervasive Health-Copyright is held by the authors. Permission to make digital or hard copiesof all or part of this work for personal or classroom use is granted withoutfee provided that copies are not made or distributed for profit or commercialadvantage and that copies bear this notice and the full citation on the firstpage.<strong>UbiComp</strong> ’08 Workshop W2 – Ubiquitous Systems Evaluation (USE ’08),September 21st, 2008, Seoul, Korea.This position paper is not an official publication of <strong>UbiComp</strong> ’08.care research is specifically targeted towards technology –i.e. aiming at understanding, designing, building, and testingnew types of pervasive computing technologies for healthcarepurposes.A common methodological approach to ubiquitous computingresearch is to design and implement a technical ‘Proofof-Concect’for a proposed new ubiquitous computing technologyor application, and subsequently evaluate this implementationin a limited setup. Marc Weiser defined the conceptof a technical Proof-of-Concept as:The construction of working prototypes of the necessaryinfrastructure in sufficient quality to debug the viabilityof the system in daily use; ourselves and a fewcolleagues serving as guinea pigs. [8].Looking at the research questions posed by pervasive healthcare,this research approach seems to be lacking some rigorin order to investigate whether the technology solve healthrelated challenges. We would, for example, never be able tounderstand or evaluate to which degree a technical prototypefor elderly people would be successful, if it is only tried outby our colleagues in a research laboratory.From a medical perspective a technical proof-of-concept isnot acceptable for introducing new medical technology ortreatment. In most healthcare systems, clear clinical evidenceneeds to exist before a new medical technology is putinto use for patient treatment. Evidence-based medicine [7]is the clinical methodological approach for establishing thisevidence. Evidence-based medicine categorizes differenttypes of clinical evidence and ranks them according to thestrength of their freedom from the various biases that besetmedical research. The strongest evidence for therapeutic interventionsis provided by systematic review of randomized,double-blind, placebo-controlled trials involving a homogeneouspatient population and medical condition. In contrast,patient testimonials, case reports, and even expert opinionhave little value as proof because of the placebo effect, thebiases inherent in observation and reporting of cases, anddifficulties in ascertaining who is an expert.Such strong evidence is, however, impossible to obtain whilewe are still in the research and development phase of newtechnology. So an important question is how we can strike abalance between these two extremes; design and implementlimited technical proof-of-concepts which at the same time51
are suited to provide sufficient clinical evidence for furtherresearch and developmentIn this paper, I suggest a methodological approach called‘Clinical Proof-of-Concept’ which is aimed at creating initialclinical evidence for the medical benefits of a pervasivehealthcare technology. This approach has been used in acouple of cases and I will report on these cases, how the clinicalproof-of-concept was carried out, and what we learnedfrom these cases.The contributions of this paper is the presentation of themethodological approach of a Clinical Proof-of-Concept togetherwith specific examples of its use in two cases. Bysuggesting this approach, it is my aspiration that more pervasivehealthcare technologies can be subject to initial evaluationand scrutiny before entering large scale clinical trials,while at the same time actually being put into test in a limitedreal-world deployment. Using this approach, a more incrementaland experimental approach to the construction ofpervasive healthcare technologies can be achieved, which inthe end will lead to developing more appropriate and usablepervasive healthcare technologies. At the same time, the approachwould enable us to reject and dismiss those technologies,which show little clinical promises before large amountof resources are spent on developing the technology and runningclinical trials.CLINICAL PROOF-OF-CONCEPTTo rephrase the definition from Marc Weiser, I am defininga Clinical Proof-of-Concept (CPoC) as:The construction of working prototypes of the necessaryfunctionality and infrastructure in sufficient qualityto investigate evidence for improving health in dailyuse for a suitable period of time; a limited but relevantset of people serving as subjects.More specifically, the technology should be a working prototypethat is usable (but not necessarily user-friendly), workson its own, and is focused on addressing specific researchquestions. This technology should be deployed in a realclinical setup, should be used by real users (researchers arehands-off), for a short, but sufficient period of time, which –depending on the research question – may range from 1 dayto 3 months.For example, you may want to test a system for monitoringhypertension and evaluate if users are able to control theirown blood pressure over time, thereby reducing hypertension,which again – according to medical literature – have apositive effect on a wide range of heart diseases. In this case,a CPoC would involve a technical prototype which runs onits own and is able to monitor blood pressure, but it maynot be particular secure, robust, or integrated in a countryspecifichealthcare system. It should, however, be able to runwith limited interference from the researchers, while some‘Wizard-of-Oz’ techniques may be applied. The deploymentwould include a limited amount of people – e.g. 10 – whichis not statistically significant for hard medical evidence, butsufficient for establishing the viability of the technical setupand its use in a real-world deployment. And the trial mayrun for a couple of weeks – rather than the months normallyrequired for a clinical trial.The methods used during this CPoC should be targeted atcollecting evidence, which demonstrate that the technologyseems promising in addressing its specific goal. It may berelevant to gather initial clinical evidence for the medicalbenefit of the technology. For this purpose, trying to measuresome clinical effects is essential during the CPoC. For example,in order to establish any clinical effect in the monitoringof hypertension, blood pressure data may be compared overthe time span of the CPoC and questionnaires regarding thepatients’ awareness and handling of their blood pressure maybe issued and analyzed.Even though the clinical evidence may be biased by differentfactors and hence not as strong as would be requiredin Evidence-Based Medicine, providing initial clinical evidencefor the working of the technology is still essential inorder to justify further development and evaluation. Furthermore,the Clinical Proof-of-Concept may simultaneouslywork as a ‘dry-run’ for testing the data collection methods,which later are to be used during the clinical trial. For example,if a questionnaire is handed out to the participants, thisquestionnaire and the timing of it may be subject to changebased on experiences obtained during the clinical proof-ofconcept.Apart from establishing initial clinical evidence, a core purposeof a CPoC is to investigate the usefulness and usabilityof the proposed solution. To a certain degree, I would arguethat this is the main purpose of a CPoC for two reasons.Firstly, the clinical benefit of a pervasive healthcare technologymay be significantly diluted if the technology is hardto use for the patient. For example, it is obvious that if theblood monitoring technology is hard to use, then limited effecton hypertension management may be found during theclinical trial. Secondly, it is essential to catch and remedysuch usability problems in an early phase before resourcesare invested in developing the technology, producing it inlarge numbers, and deploying it for a clinical trial.These arguments may seem trivial. However, some sort ofusability problems are often hard to discover and are oftenunexpected. By running a CPoC which actually puts thetechnology to a test in a real-world setting with real usersfor a certain period of time, many of the more complex usabilityproblem may surface. And often, ideas for changingand improving on the technology arise when seeing it in actualuse and by working closely together with the users tofind a solution to the problem.Methods for usability inspection would typically be qualitativein nature, involving observations, questionnaires, andstudies of perceived usefulness and usability.Figure 4 show the temporal progression of research methodsas the technology is developed and mature. Time-wise,52
Figure 1. The timing of a Clinical Proof-of-Concept isbetween a laboratory proof-of-concept and a full clinicaltrial.a clinical proof-of-concept lies in between the technical laboratoryproof-of-concept and a full-scale clinical trial.CASESIn order to illustrate how a CPoC can be used in pervasivehealthcare research, I will use two cases as examples. Thefirst case is concerned with home-base blood pressure monitoring,and the second case is concerned with developingcontext-aware technologies for improving patient safety insidethe operating room. These two case are very distinct inmany respects – technology, users, deployment settings, andgoals – but as such, they illustrate the breath of the CPoCapproach.Blood Pressure MonitoringThe first project was concerned with home-based monitoringof hypertensive patients. Hypertension is a direct cause of anumber of heart diseases, including congestive heart failureand stroke, and substantial clinical evidence indicates, thatfrequent blood pressure monitoring helps prevent hypertension[6]. For this reason, many pervasive healthcare projectshave addressed hypertension. This project was done in 2002when state-of-the-art blood pressure monitoring was basedon a cuff. Our goal was to deploy the technology in a limitedpilot study and perform a CPoC (even though we didnot call it that at that time). The technology for home-basedmonitoring consisted of a suitcase with a traditional bloodpressure monitor, a PDA, and a GSM modem as shown inFigure 2.In this project, the suitcase were given to the patients by theirgeneral practitioner (GP). The system had three main features:(i) it allowed the patient to measure the blood pressureseveral times a day and this data was sent to a central serverfor the GP to observe; (ii) the GP could prescribe medicinesand the patient could indicate that (s)he was complying tothe prescription; and (iii) it enabled communication betweenthe patient and the GP, using both text and voice messaging.During the first months of a longer deployment period, wecarried out a series of interviews and field studies of thishome-based monitoring and treatment system. This studyFigure 2. A patient using the home-based monitoringsystem in a briefcase for monitoring her blood pressure.was focusing on studying issues of medical treatment, divisionof work, communication, patient self-understanding,and the technology in actual use [2]. Our study – in accordancewith most medical studies of home-based monitoringof hypertension – gave evidence that this kind ofblood pressure monitoring provides more accurate measurements.Our findings, however, also revealed that the relationshipbetween the GP and the patient changed when this newcomputer-mediated home-based treatment for hypertensionwas introduced. More specifically, we found four specificaspects of this transformation caused by pervasive monitoringand treatment technology:• A new division of work emerged, which transferred theact of monitoring and interpreting the blood pressure datafrom the GP to the patient.• The medical treatment of hypertension and the life qualityof the patient was improved. However, new demands formonitoring the incoming data and the patient’s progressionin treatment were inflicted upon the GP.• The communication pattern between the patient and GPwas fundamentally changed from a contextual rich conversationto an asynchronous message exchange.• Because the patient was more involved in the monitoringand treatment of hypertension, he or she became moreself-aware on the nature of high blood pressure and whataffects it.This clinical CPoC was insufficient to establish clinical evidencefor improved hypertension treatment of the patients.For this purpose, the time frame of the study was too short,the sort of methods applied insufficient for determining clinicalevidence, the number of patients were too small, and nocontrol group was involved. The study, however, were sufficientlylarge to study, understand, and argue that this kindof home-based monitoring would transform the patient-GPrelationship and make the patient capable of managing theirown blood pressure in a more efficient way. And since previousclinical studies have shown that regular self-conscious53
attention to your blood pressure reduces the risk of hypertension,this was clearly a strong indicator that this kind oftechnology would be useful.At the same time, the CPoC revealed a series of usabilityand deployment issues which needed to be looked into beforerunning larger scale trials involving a larger amount ofpatients and GPs. The technology were subsequently improvedand deployed in a large clinical trial with 10 GPs,120 patients, and a control group.Context-aware Patient SafetyThe Context-aware Patient Safety and Information System(CAPSIS) monitors what is going on inside the operatingroom and use this information to show timely medical datato the clinicians, and to issue warnings if any safety issuesare detected [4]. CAPSIS monitors events like the status ofthe operation; the status and location of the patient; locationof the clinicians who are part of the operating team;and equipment, medication, and blood bags being used insidethe operating room. This information is acquired andhandled by a context awareness infrastructure, and a specialsafety service is used for overall reasoning which actions totake or warnings to issue. The goal is to supplement humansafety vigilance with a machine reasoning counterpart.CAPSIS was deployed and tested in a CPoC where it wasused for one day by a full surgical team performing simulatedoperations inside an operating room. In total, 8 operationswere executed during the day, involving both operationswith no warnings as well as different types of warnings,including wrong patient, wrong operating table, wrongblood, and incomplete team. In addition, medical records,radiology images, and the operation checklist were presentedon displays using the context-aware triggers. A picturefrom the CPoC is shown in Figure 3. Everything weredone exactly as real surgeries, except that no real patientswere involved and the acting patients were not sedated or actuallycut. The acting patients, were, however treated as anyreal patient, including being admitted to ambulatory surgeryand scheduled in the scheduling system.The goal was to provide objective measurements on the usefulnessand usability of our design while, at the same time,investigate the detailed user reaction to the system and theuser interface in a more qualitative fashion. For this purpose,we used a multi-method evaluation setup where we (i) askedthe users to perform the operations while thinking aloud, (ii)investigated perceived usefulness and usability based on aquestionnaire [5], and (iii) made a semi-structured followupinterview.Based on this evaluation, the clinicians concluded that thesystem would be very useful for ensuring patient safety andwas very easy to use. Most of the patient safety issues monitoredby CAPSIS were found to improve patient safety, andseveral of the findings resonate with the recommendationsfrom the state-of-the-art regarding patient safety. Moreover,the CPoC revealed a series of usability issues which wehad not captured previously, despite several prototyping ses-Figure 3. The deployment of the system inside the OR;the surgeon and the sterile nurse read medical data onthe screen to the right while the scrub nurse interactswith the patient safety system on the screen to the left.sions. By actually deploying the technology inside the OR,and asking the operating team to use the technology duringclose to real-world surgeries, a wide range of issues surfacedwhich would have not been found otherwise. Especially issuesregarding the physical working environment of an ORand the tight teamwork taking place during surgery surfaced.Some examples of issues that were discovered during thisCPoC include;• The user interface had to be improved in several place,including issues like coloring, highlighting, and font sizeon the screen due to the distance from the operating tableto the screens.• The procedures regarding attaching a RFID enabled armbandto the patient needed to be scrutinized because patientsafety now was depending on that this was done correctly.If the wrong armband was attached to a patient,unpredictable and potential severe safety hazards may occur.• Better support for handling and registering scanning ofblood bags were needed. When moving from a limited testin a lab to a CPoC in the OR where a substantial volumeof blood may be needed, the existing method for checkingcorrect blood did not scale to e.g. 10-20 blood bags. Thereason for this was due to a number of highly interlinkedaspects, ranging from the organizational procedure for orderingand getting blood, to the physical layout of the OR,and the way the RFID technology were working.• Lack of triangulation, which is the medical safety termfor ensuring that a safety check is done by combining thepatient, the procedure, and the clinical staff. Even thoughthis was part of the overall systems design, triangulationdid not work inside the OR on the individual level.• The operating team had to change their safety proceduresjust before surgery in order to leverage the capabilities ofthe system.54
It is important to note, however, that this CPoC setup isnot providing ‘hard clinical evidence’ for improved patientsafety inside the OR. We do not know if this system – ifbuild and deployed – would improve on patient safety. Thiswould require a randomized clinical trial over a longer periodof time involving a control group, which again wouldrequire a full working system ready for large-scale and longtimedeployment. Providing such Evidence-Based Medicineis, however, not the purpose of a Clinical Proof-of-Concept;it is rather to investigate the feasibility of the proposed solutionfor further development. By asking the involved clinicianshow they perceive the system’s potentials for improvingpatient safety, we are given sound indications regardingthe feasibility and directions for further development.Beside this indication of potential clinical evidence for improvingpatient safety, the core benefit from running thisCPoC is the different problematic issues regarding the currentprototype which must be addressed before making alarger clinical trial. As illustrated above, these issues are amixture of technical, usability, physical, and team-orientedaspects which need to be addressed in concert. But most importantly,these complex and interrelated issues would probablynever have been found without running a CPoC. Thenext step would be to incorporate the suggestions for improvementand then apply more rigorous clinical methodsfor evaluating the degree to which the system improves onpatient safety. Note, however, that the only reason for suchan investment is based on the fact, that the CPoC indicatedthat the system potentially would improve patient safety.DISCUSSIONWhat have we learned from our use of clinical proof-ofconceptsso far?First of all, a CPoC reveals a wide range of technologicalproblems and issues. For example, in the blood pressuremonitoring project, the CPoC revealed all sorts of problemswith wires, handling software updates, and sustaining poweron the devices while not in use. In the patient safety project,the CPoC revealed all sort of issues ranging from the workingof the RFID technology to the use of the software onlarge touch-screens. Hence, a CPoC is useful in determiningthe sort of technological issues which are related to realworlduse by real users for a longer period of time and on alarger deployment scale.Second, even though a CPoC seldom is done in a way whichjustify any ‘hard’ clinical evidence, it is still useful in orderto both provide initial clinical evidence for a potentialmedical effect, as well as providing important informationon how this clinical effect should be collected. For example,the clinicians in the patient safety project unanimouslyagreed that the system had the potential for improving patientsafety inside the OR. This do not count as clinical evidence,but nevertheless it encourage further development.At the same time the CPoC revealed that the methods usedfor evaluating the system were appropriate for judging perceivedusefulness, but they were not appropriate for providingclinical evidence for the improvement of patient safetyduring surgery. Hence, a new methodological setup is requiredin any subsequent clinical trial.Third, because the technology is deployed in a real settingfor a non-trivial period of time, a CPoC is well-suited forinvestigating the usability of a pervasive healthcare system.Especially non-trivial usability problems which arise fromcomplex interaction between different types of technologies,users, real deployment settings, and long-term use may bediscovered during a CPoC. For example, the blood-pressuremonitoring CPoC revealed that it was hard for some patientsto type a message to the GP and this functionality was hencechanged to use voice messages instead of text messages.And in the patient safety project, as wide range of usabilityissues regarding the user interface were found.Fourth, due to the real-world deployment a CPoC helps revealand evaluate the physical usage of the technology. Thephysical aspects of the technology is especially important forpervasive healthcare systems since medical devices and systemsare notoriously tied to monitoring or influencing physicalproperties of a human body or a physical environmentin homes or hospitals. For example, a wide range of issuesregarding the physical handling of the blood-pressurecuff and the handling of the PDA were revealed during theCPoC. This subsequently lead to the design of a cartoon-likestep-by-step instruction card, which were place on the frontof the suitcase, as shown in figure 2. In the patient safetyproject, the physical layout of the OR, the physical handlingof patients, blood bags, and instruments turned out to havesignificant impact on the use of the system.Finally, often pervasive healthcare systems needs to existand work in a larger social and organizational context. ACPoC is equally suited for initial investigation of the impactarising from this larger deployment context. Especially inthe blood-presure project we found a significant change inthe division of work and communication between the GP andthe patient, and the CPoC revealed some of the important detailsof how the technology would potentially influence theway the treatment of hypertension were achieved. In the patientsafety project, the CPoC helped judge the fit betweenthe system and the complex and dynamic teamwork takingplace inside an OR.CONCLUSIONIn this paper, I have proposed to apply a Clinical Proof-of-Concept as a methodological approach for evaluating pervasivehealthcare systems. A CPOC involves a focused studyin a real-world deployment setting, involving real patientsand users, while being limited in time, scope, and clinicalrigorousness in the methods applied. By being a steppingstone in the middle of a laboratory-based evaluation and afull-scale clinical trial, the CPoC is able to provide valuableinformation regarding the clinical applicability of the system,its usability, and issues regarding the physical and organizationaldeployment of the system. In this way a CPoC is amore dedicated and cost-effective approach for establishinginitial clinical evidence as well as being a invaluable sourcefor improving the technology at a stage before resources are55
invested in final development and clinical trials.AcknowledgmentsThe hypertension project was done together with AndersThomsen and Claus Bossen. The context-aware safety systemfor operating rooms were done together with NielsNørgaard and the surgical staff at Horsens Sygehus in Denmark.REFERENCES1. J. E. Bardram. Pervasive healthcare as a scientificdicipline. Methods of Information in Medicine,3(47):129–142, 2008.2. J. E. Bardram, C. Bossen, and A. Thomsen. Designingfor transformations in collaboration: a study of thedeployment of homecare technology. In GROUP ’05:Proceedings of the 2005 international ACM SIGGROUPconference on Supporting group work, pages 294–303,New York, NY, USA, 2005. ACM Press.3. J. E. Bardram, A. Mihailidis, and D. Wan, editors.Pervasive Healthcare: Research and Applications ofPervasive Computing in Healthcare. CRC Press, 2006.4. J. E. Bardram and N. Nørskov. Designing Context-awareSafety Systems for the Operating Room. In Proceedingsof Ubicomp 2008: Ubiquitous Computing, Seoul, Korea,Sept. 2008.5. F. D. Davis. Perceived usefulness, perceived ease of use,and user acceptance of information technology. MISQuarterly, 13(3):319–339, September 1989.6. M. A. M. Rogers, D. A. Buchan, D. Small, C. M.Stewart, and B. E.Krenzer. Telemedicine improvesdiagnosis of essential hypertension compared with usualcare. Journal of Telemedicine and Telecare, 8:344–349,2002.7. D. L. Sackett, W. M. Rosenberg, J. A. Gray, R. B.Haynes, and W. S. Richardson. Evidence basedmedicine: what it is and what it isn’t. BMJ,312(7023):71–2, 1996.8. M. Weiser. Some computer science issues in ubiquitouscomputing. Communications of the ACM, 36(7):75–84,1993.56
The Challenge of Evaluating Situated Display basedKeith Cheverst, Nick Taylor, Mark RouncefieldComputing DepartmentLancaster University, Lancaster, UK{k.cheverst, n.taylor3, m.rouncefield@lancaster.ac.ukAreti Galani and Christian KrayICCHS and School of Computing ScienceNewcastle University, Newcastle upon Tyne, UK{areti.galani,c.kray}@ncl.ac.ukABSTRACTIn this paper we discuss the obdurate problems associatedwith evaluating the extent to which technologicalinterventions in particular those based on mobile andubiquitous technologies We report on experiences gained from several deploymentsof ubiquitous systems that share this design goal, andanalyze common issues we observed during real life use ofthese systems. Based on these we discuss some of the keychallenges for evaluating ubiquitous systems of this genre.Author KeywordsTechnological intervention, mobile and ubiquitouscomputing, CSCW, long-term deployment, evaluation,methods, community, situated displays.ACM Classification KeywordsH5.m. Information interfaces and presentation (e.g., HCI):Miscellaneous.INTRODUCTIONOur research is interested in the design of technical systemsthat may prove useful in promoting or 'affording' somesense of community. McMillan and Chavis [11] identifyfour inter-related elements associated with sense ofcommunity:i. membership,ii.iii.iv.influence,integration and fulfillment of needs, and,shared emotional connection.A number of technical systems based around ubicomptechnologies, most notably situated displays, have recentlybeen developed and deployed with the intention ofsupporting sense of community. A good overview of thisCopyright is held by the authors.<strong>UbiComp</strong> '08 Workshop W2 -- Ubiquitous Systems Evaluation (USE '08)September 21st, 2008This position paper is not an official publication of <strong>UbiComp</strong> '08.work is provided in [14] with one of the first systems of thisgenre being GroupCast [10]. Typically such systems focuson highlighting the technical difficulty associated withimplementing the system or the methods used to ensureappropriate and well-informed design. However, in additionto the difficulty of successfully designing and implementingfoster and support a sense of community, is also achallenging problem, due to a number of issues. Forexample, when deploying technologies to supportcommunity it is likely that social practices will shift inorder to accommodate the new technology. Furthermore, itis likely that the technology will be tailored by its users,sometimes in unanticipated ways (i.e. throughappropriation) to accommodate the social practices it isintended to support. For example, technology can reshapenotions of space and proximity and thus the boundaries of-conceptualizing what it means to be local,connected etc. Hence, community is an achieved social obligations, pointing to the ability of technology to reshapeand redefine how people see themselves [13].One of the difficulties of evaluating how well a giventechnological intervention may support notions ofcommunity is that the effect of the intervention isdependent on the interaction between a combination oftechnologies and their affordances (including those broughtabout through the placement of the technologies) andparticular communities and their dynamics. Furthermore,the evaluation techniques themselves must adapt to thesedynamics, evolving alongside the system.In [15] we discuss the need to consider the followingfactors when designing technologies to support notions ofcommunity:1. membership - recognisable members and membershipcategories, allied with recognisable boundaries2. identity and representation - how people can representthemselves and manage their 'identities'3. managing spatial relations - need to manage spatialrelations to integrate the real and the virtual57
4. rhythms - the highly predictable rhythm of everydayactivity sets the grounds for shared expectations andcomprehension of behaviour - successful communitiescarry intelligible rhythms of interaction and awareness- which vary according to the community and is linkedto issues of awareness and 'sense of place'.5. community development - the community should beable to reflect and learn from experience, to develop6. history and change - the ability to develop a historythrough recording and archiving various interactionsThe remainder of this paper is structured as follows. Insection two we describe our general approach towards thedesign, deployment and evaluation of technologyinterventions (where sense of community is at least one ofthe aims) in a range of settings. Next, in section three, wesummarise two of our current deployments for which wewish to evaluate their effectiveness in supporting sense ofcommunity. These two deployments comprise the WrayPhoto Display, a touch screen based interactive system,which is situated in the Post Office of a rural village in theNorth of England, and the Campus Coffee Display, a wallmountedbroadcasting screen, which is situated in a café atthe intersection of Newcastle University campus and thecity main shopping area. In this respect both systems arelocated within the activity zone of established localcommunities and visitors to the area. Finally, we discuss thepertinent issues that we have experienced when consideringthe evaluation of these systems.APPROACHIt is apparent from related literature and our own researchthat it is essential to understand the social and physicalrichness of a given setting in order to avoid inappropriatedesign. Consequently, our approach draws from a range ofapproaches including ethnographic studies, use of culturaland technology probes [6], focus groups and designworkshops. We have investigated several settings in thecourse of our studies including Lancaster Universitycampus, a public café, and domestic settings such as familyhomes and residential care facilities.By using a range of settings we aim to increase ourconfidence in the generality of our findings. Ourmethodology is iterative: observe, design and deploy,observe etc., where these stages are closely coupled and allhold key (technical and practical) challenges.-[5] wherebytechnical modification is rooted in ongoing ethnographicstudy. The evaluation approach, therefore, both informs andis being informed by the evolving character of the system toreflect the dynamic relationship between the system and itssocio-spatial context.SYSTEM DEPLOYMENTSWe have experienced comwith several of our example, with the Hermes office door display system (thatenabled office owners to post awareness related messageson digital displays situated outside their office) we describein [2] how usage of the system was considered by manyusers as directly relating to notions of community, e.g. onedoor display owner made the following comment whenasked why he used the system: know people have to be able to get to my doorplate, andthat probably makes them one of the staff or colleagues,and that affects what information I could put on there and I oh-and-In the following sub-sections we describe two of ourcurrent technology deployments that are undergoingevaluation and which were designed to support notions ofcommunity.The Wray Photo DisplayThe Wray Photo Display [16] is deployed in the Post Officeof a rural village situated in the North of England. Thesystem enables members of the village to post photos (orshort video clips) to be shown on the display and to createand moderate their own photo categories. The photo displaywas conceived as a technology probe and has runcontinuously (capturing log data) in its current location (seefigure 1 below) since October 2006.Figure 1. The Wray Photo Display situated in the Village PostOffice. The Comments Book can be seen just to the right of thedisplay.In order to evaluate the usability and usefulness of thesystem we have held a number of participatory designworkshops and focus groups. However, perhaps the mostuseful single method for obtaining qualitative feedbackregarding the system has been via a comments book whichhas been placed next to the display since its firstdeployment. This book has enabled both members of thevillage and visitors to the village to express their opinionsregarding the display and its content. To date over 6058
individual comments have been left in the comments bookbut suggestions for additional functionality have also beenleft via e-mail. A page from the comments book containinga comment relating to issues of community is shown infigure 2.while waiting at the counter. Nevertheless, the display wasperceived as being beneficial as a reminder about upcominglocal events and complementary to other similar communityresources, such as the weekly newsletter. The slow pace ofthe presentation was also positively received as being inand use of the café.In the course of the focus study we discussed with theparticipants three alternative designs of a more interactivesystem that would enable customers to interact with thedisplay through their mobile phone. The proposedinteractive features would provide a means for visitors tothe café to comment either on the cultural events currentlybeing shown on the screen, or on objects exhibited atnearby museums, or on user-defined topics. Feedback fromthe focus study indicated that, although the public nature ofthe display might serve well the promotion of communityactivities, the ownership of the content, its management,and the protocols of content contribution (including theinteraction mechanisms) would be difficult to negotiate insuch a socially and politically diverse environment.Figure 2. A Sample Page from the Wray Photo DisplayComments Book.The last comment on this page reads:the village, and a delight for those who were born here andIt is interesting to note that this comment speaks of notionsof membership, identity and history that were introducedearlier. Indeed the most popular category of photos viewedon the display is that of historical photos.Campus CoffeeThe Campus Coffee system at a local café (see figure 3) hasbeen running continuously for about two years now [7,8]. Itprovides information about upcoming cultural events in thequarter of the city where the café is located. The initialversion of the system delivered content updated by theresearchers and was designed to be non-interactive andslow-paced. As a new addition to other modes of localinformation in the café, it functions as a low-keytechnology probe.In order to assess the perception of the systemas a source of local information and to look into options forfurther community engagement through the incorporationof interactive features, we conducted brief in-situquestionnaires, observations and focus group sessions. Inline with previous findings, users most frequently classifiedtheir use of the system as opportunistic, i.e. glancing at itFigure 3. The Campus CofRegarding this latter finding, we return to the commentmade in the introduction, and the fact that here what isbeing evaluated is the product of both setting andtechnology.ISSUESIn applying our approach to these deployed systems, wehave come across a series of recurring issues, which wediscuss in this section.How long does a deployment need to be in place?Both the Wray Photo Display and Campus Coffee systemshave been deployed for relatively long periods of time especially in the context of typical ubicomp systems.However, the question remains: how long does adeployment need to be in place before it can sensibly beevaluated against success criteria based on improvedcommunity and coordination in the setting? A key elementof our research methodology is the use of substantialdeployed installations. The long term use of novel59
technologies, especially their collaborative and communityeffects, cannot be deeply understood through short-term tions. This development anddeployment enables longitudinal studies as well as being atechnology demonstrator for dissemination and inspiration.What are appropriate techniques for evaluating technologyprobes with respect to community?We have utilized both qualitative and quantitative measuresbut to-date it is the use of qualitative methods that haveyielded most insight. One problem with the use ofquantitative measures based on log analysis, for example, isthat it is difficult to produce figures on how many differentmembers of a community view the content (not least howthey feel about the content). With the Wray system, we didnot wish for the interaction design to require viewers of thecontent to log themselves in and out of the system, as isoften the case with similar systems [10,4]. There is thepossibility of exploring the use of monitoring devices suchas web cams but these, of course, introduce numerous anddifficult privacy and control issues, see [12] for an initialdiscussion on this topic. We have also highlightedadditional complexity added to this issue by the need toadapt our evaluation approach to individual communitiesand technologies.How to introduce the system to the community?The Wray Photo Display was introduced as a workinginteractive system, and has evolved over time in response touser feedback. With the Campus Coffee system we took aslightly more conservative approach by repurposing anexisting non-interactive and very ambient system with thescope to introduce interactive aspects in response to userconsultation. While both systems are relatively similar inthe function they provide, specifically the delivery ofcommunity/locale related content, the reaction to them hasbeen quite different. In particular, the interactive featuresassociated with the Wray Photo Display have been receivedenthusiastically, but with the Campus Coffee system thesuggestion of altering the design concept of the existingtechnology deployment to one in which a great degree ofcommunity-generated content could be entered anddisplayed received negative reaction. It is interesting tospeculate on how the Campus Coffee deployment wouldhave been received if the initial deployment had been basedon this suggested design concept. The implication forevaluation being that the way a technology intervention isintroduced can have a significant impact on the adoptionand appropriation of the technology (to support sense ofcommunity).CONCLUDING REMARKS AND FUTURE WORKIn this paper we have discussed the difficult issue of how toevaluate the success of technology interventions that havetwo systems presented in this paper, which both share theaforementioned design goal, are based around situateddisplay technologies and have been deployed for relativelylong periods of time and received daily use. The WrayPhoto Display system has certainly received positivecomments from members of the community; however, . With theCampus Coffee system it has been interesting to observethe cost/benefit analysis that has led participants of a focusstudy group to favor calm/controlled content presentationover potential haphazard community generated content.Clearly part of the cost/benefit analysis taking place in thiscase café in thefirst place. Therefore, it highlights strongly the fact thatwith the technology interventions discussed in this paper,what is being evaluated is the product of both setting andtechnology and this reveals the emphasis in situateddisplays. Furthermore, it indicates that an evaluativeapproach that would investigate the correlation betweencommunity dynamics and system usage patters andperceptions might be particularly helpful in the design ofsustainable community-centered technology.As part of our future work, we hope to extend our use ofqualitative evaluation methods but also explore further thepotential of more quantitative methods, such as the use of psychology [3, 9]. We also hope to explore how to designand evaluate technology interventions to support a sense ofcommunity in further different and (again difficult to study)sensitive settings, including rural townships in SouthAfrica.ACKNOWLEDGMENTSThis work is supported by the EPSRC funded CASIDEproject (grant ref: EP/C005589) and a Microsoft ResearchPhD Scholarship. We would like to thank the villagers ofWray and the staff and visitors of Campus Coffee as well asthe student union of Newcastle University.REFERENCES1. Anderson, R.J., and Sharrock W.W. (1993) 'CanOrganisations Afford Knowledge', in Journal ofComputer Supported Cooperative Work (JCSCW) Vol1, No. 3, pp. 143-161. 1993.2. Cheverst, K., A. Dix, D. Fitton C. Graham, and M.Rouncefield, (2008) Situatedness of AwarenessInformation: impact on the design and usage ofawareness systems, Book chapter to appear in:Awareness Systems: Advances in theory, methodologyand design. Springer HCI Series Eds: PanosMarkopoulos and Boris de Ruyter - Springer. 2008.3. Chipuer, H. M., & Pretty, G. M. H. (1999). A review ofthe Sense of Community Index: Current uses, factorstructure, reliability, and further development. Journalof Community Psychology, 27(6), 643-658. 1999.4. Grasso, A. Roulland F. and Snowdon, D. (2006)Informing the community: The roles of interactivepublic displays in comparable settings. In Purcell, P.60
(ed.) Networked neighborhoods. Springer, 373-395.2006.5. Hartswood, M., Procter, R., Slack, R., Voß, A.,Buscher, M., Rouncefield, M., and Rouchy, P. (2002).Co-realisation: Towards a Principled Synthesis ofEthnomethodology and Participatory Design.Scandinavian Journal of Information Systems, 14(2). 9-30. 2002.6. Hutchinson, H., Mackay, W., Westerlund, B.,Bederson, B. B., Druin, A., Plaisant, C., Beaudouin-Lafon, M., Conversy, S., Evans, H., Hansen, H.,Roussel, N. and Eiderbäck, B. (2003) Technologyprobes: inspiring design for and with families. In Proc.of the SIGCHI Conference on Human Factors inComputing Systems (CHI 03), (Ft. Lauderdale, Florida,Apr. 05-10, 2003), ACM Press, 2003, 17-24. 2003.7. Kray, C., Galani, A., and Cheverst, K. (2007) Engagingwith Cultural Content on Ambient Displays. UrbanScreens 2007, Manchester, UK. 2007.8. Kray, C., Galani, A. and Rohs, M. (2008). FacilitatingOpportunistic Interaction with Ambient Displays, inWorkshop on Designing and Evaluating Mobile Phone-Based Interaction with Public Displays at CHI 2008.9. Long, D.A., & Perkins, D.D. (2003). ConfirmatoryFactor Analysis of the Sense of Community Index andDevelopment of a Brief SCI. Journal of CommunityPsychology, 31, 279-296. 2003.10. McCarthy, J. F., Costa, T. J., and Liongosari, E. S.(2001). UniCast, OutCast & GroupCast: Three StepsToward Ubiquitous, Peripheral Displays. Proc 3rdinternational Conference on Ubiquitous Computing,pp. 332-345. 2001.11. McMillan, D.W., and Chavis, D.M. (1986). Sense ofcommunity: A definition and theory, p. 16. 1986.12. Müller, J., K. Cheverst, D. Fitton, N. Taylor, O.Paczkowski, A. supporting local and remote mobile phone interaction the International Journal of Mobile Human ComputerInteraction (IJMHCI): special issue on Advances inEvaluating Mobile and Ubiquitous Systems. 2008.13. Mynatt, E.D., Something old, ComputerSupported Cooperative Work, 7(1-2), 123156, 1998.14. et al (2003) Public and SituatedDisplays: Social and Interactional aspects of shareddisplay technologies, Kluwer. ISBN 1-4020-1677-8.2003.15. Rouncefield, M., K. Cheverst, A. Dix, M. Gibbs and C.Graha in Proc Experience in HCI http://www.infosci.cornell.edu/place/, Sept 2005.16. Taylor, N., Cheverst, K., Dix, A., Race, N. Fitton D.,Rouncefield, M. and Graham, C. (2007). ProbingCommunities: Study of a Village Photo Display. InProc OZCHI 2007.17. Taylor, N., Cheverst, K., Rouncefield, M. andShahram, S. (2008) Encouraging Community Spiritwith Situated Displays, in Proc. of AISB InternationalSymposium on Persuasive Technology, UniversityAberdeen, April 2008.61
Situvis: Visualising Multivariate Context Information toEvaluate Situation SpecificationsAdrian K. Clear, Ross Shannon, Thomas Holland,Simon Dobson, Aaron Quigley and Paddy NixonSystems Research GroupSchool of Computer Science & InformaticsUCD DublinIrelandadrian.clear@ucd.ieABSTRACTOne of the many challenges faced when evaluating contextawareubiquitous systems is to gain some understanding ofthe constant influx of context data into the system. Elsewhere,context has been distilled into more natural abstractionscalled situations with the aim of making these systemsmore understandable and intuitive to develop applicationsfor, though codifying and manipulating these situationsstill presents problems. We introduce Situvis, a toolwe have developed based on the Parallel Coordinates Visualisationtechnique, which assists users by visually representingthe conditions that need to be present for a situation tobe triggered in terms of the real-world context that is beingrecorded in their system, and allows the user to visually inspectthese properties, evaluate their correctness, and changethem as required. We describe the use of our tool with asmall user study.Author KeywordsContext, context-aware systems, situations, situation programming,visualisation, visual data miningACM Classification KeywordsD.1.7 Visual programming,H.1.2 Human information processingINTRODUCTIONIn context-aware systems, context data is derived from multipleheterogeneous sensors. These sensors may be networkedphysical instruments in the environment (measuring factorslike temperature, noise volume or humidity) or software sensorsretrieving information from the web or various data feeds.These context data are voluminous, highly multivariate, andconstantly being updated as new readings are recorded.Situations have been proposed as a higher-level abstractionof context data [8], freeing the user from having to deal withraw context and allowing more expressive adaptations. Situationsare more natural for users to work with, as they definecommonly-experienced occurrences such as a user “takingCopyright is held by the authors.<strong>UbiComp</strong> ’08 Workshop W2 – Ubiquitous Systems Evaluation (USE ’08)September 21st, 2008This paper is not an official publication of <strong>UbiComp</strong> ’08.a coffee break”, or being “in a research meeting”, withoutrequiring the user to understand any of the dozens of distinctsensor readings which may have gone into making up thesesituations. Situations are thus a natural view of a contextawaresystem, whereas the individual pieces of context areeach “a measurable component of a given situation” [10].As the context information available to a context-aware systemat any moment is so extensive, dynamic and highly dimensional,it is a significant challenge for a system observerto ascribe significance to changes in the data or identify emergenttrends, much less capture the transient situations thatare occurring amid the churn of the data.The visualisation of large and complex multivariate datasets, such as those that context-aware system developers workwith, is becoming increasingly crucial in helping those developersto organise and distill data into usable information[2]. Interactive visualisation tools help the viewer performvisual data analysis tasks: exploring patterns and highlightingand defining filters over interesting data.Here, we present Situvis, a scalable visualisation tool for illustratingand evaluating the makeup of situations in a contextawareubiquitous system. Our tool is based on well-foundedsituation specification semantics. By incorporating real situationtraces and annotations, Situvis assists system developersin constructing and evaluating sound and complete situationspecifications, affording them a better understandingof the situation space, and the reliability of modelling withsituations based on real, recorded sensor data. It is a frameworkthat allows developers to understand, at a high level,how their system will behave given certain inputs.The following section provides a formal description of situationspecifications and a review of some challenges facedwhen working with context and situations. We then describethe details of the Situvis tool, including a demonstration ofits utility, followed by an informal evaluation and discussionof its properties.CONTEXTS AND SITUATIONSSituation specificationsBased on our experience with modelling context for adaptivesystems [4, 10], and from the extensive literature on the62
subject [5, 6, 8], we can make some observations: the incomingsources of context are viewed as a finite number ofvariables: either nominal or categorical values, e.g., activitylevels {idle, active, highly active . . . }; or quantitative ordinalvalues which may be defined over some known interval,e.g., noise level in decibels {0, 140}.Location information will typically arrive as individual valuesfor an object’s x, y and z values, and may be recordedby numerous disparate positioning systems, but is modeledas a higher-level abstraction to make it easier to reason with.We have previously completed research that allows componentx, y and z coordinates to be composed into a symbolicrepresentation, given some domain information [15], and socan work with locations as readable as “Simon’s office” or“Coffee Area”. Our visualisation tool can accept either rawsensor data or these higher-order categorised data.Situations are high-level abstractions that serve as a suitablemodel with which to develop context-aware systems. In orderfor a system to be able to recognise situations, they mustfirst be specified. The semantics of situation specificationcan be seen in the work of Henricksen [8] and Loke [11].Based on this work, we make some assumptions about situationspecification so that situations specified using declarativelanguages such as these could simply be “plugged-in”to our tool.Situation specifications are boolean expressions (sometimescalled assertions in computer programming)—they are eithertrue or false, denoting occurrence and non-occurrence,respectively. Assertions may be composed using the logicaloperators AND (∧), OR (∨), and NOT (¬), resulting in richerexpressions. Domain-specific operators can be defined tocomplement these operators. For example, for location wecould define a “distance” operator. The distance operatormay take two arguments and return a numerical value of thedistance between them. Domain-specific operators are alsorequired for situation specification. For example, for manycontext dimensions an essential operator is one that takes avalue and a range and returns true if that value exists withinthe range.We can thus define a situation specification as a concatenationof one or more assertions about contexts, which leadsus to the following formal definition:A situation specification consists of one or more assertionsabout context that are conjoined using the logical operatorsAND (∧), OR (∨), and NOT (¬). Assertions may comprisefurther domain-specific expressions on context, given thatthe required semantics are available.Properties of context-awarenessSituation specifications are essential in achieving two veryimportant properties of context-aware systems: soundnessand completeness [11]. A system is sound if it does not givefalse positives when determining a situation; it is completeif it contains specifications for all situations to be detected.Related to these properties is perceptual distinguishability.If a system state exists that involves multiple situations, theobserver should be able to distinguish between those situations.It may be the case that two situations’ specificationsare satisfied by a given occurrence. In the case of compatiblesituations, this could be due to one situation’s specificationsubsuming another. If the specifications are incompatible,however, we must have a means to re-evaluate them. Situationsare generally specific to behaviours, and, as a result,their compatibility requirements are determined by the compatibilityrequirements of behaviours.The adaptive systems that we are concerned with are usercentric,and so user feedback is an important aspect of theirevaluation. Situation annotation is a particularly useful modeof feedback for us, because it allows us to contrast situationspecifications with actual traces of these situations. It alsoexposes the subjective nature of situations. However, to developsound and complete situation specifications, it is necessaryto capture two facets of reality: those situations thatour specification must successfully characterise; and thosesituations that it should not. Therefore, the annotated situationsare an important guideline, but the traces of undesiredsituations are also important to avoid false positives.Situations can range from the very simple to the very complex,depending on the number of contextual componentsthey are defined over. The more complex a situation becomes,the more difficult it is to pick out similarities or differencesbetween multiple situations in aggregate, withoutthe support of a visual analytics tool. This ability is importantbecause the similarity of one situation to another determinesthe possibility of them occurring together or in sequencewithin a small period of time.Visualisation of context dataThere exist myriad visualisation techniques, from time-seriesto multi-dimensional scatter plot methods, which can be adaptedto the exploration of multidimensional context data.Our focus here is not only on the exploration of such contextdata, but also the scope of the higher order situations,their specification, and data cases which fall outside the setboundaries. The Table Lens, a focus+context visualisation,supports the interactive exploration of many data values in asemi-familiar spreadsheet format [14]. In practice, due to thedistortion techniques employed, users can see 100 times asmany data items within the same screen space as comparedwith a standard spreadsheet layout. Rather than showing thedetailed numeric values in each cell, a single row of pixels,relating to the value in the cell, is shown instead. The TableLens affords users the ability to easily study quantitativedata sets, but categorical values are not well supported.An alternative to a single visualisation are co-ordinated, linkedvisualisation techniques employing brushing and querying.Three linked views of multi-dimensional data—using a PrincipalComponents Analysis (PCA) view, interactive brushing,and dimensional querying with parallel bargrams—areemployed in the Antenna Design Gallery [12]. Here the actionsor queries in any one window or view are reflected in63
all. A user selecting a range within a given dimension reducesthe data cases in the PCA view, and in the element valueshighlighted in the other bargrams. This encourages explorationof a large, multivariate data set, as different facetsof the data can be seen in each view.PARALLEL COORDINATESParallel Coordinate Visualisations (PCVs) are a standard twodimensionaltechnique ideally suited to large, multivariatedata sets [9]. The technique excels at visually clusteringcases that share similar attribute values across a number ofindependent discrete or continuous dimensions, as they canbe visually identified through the distribution of case lineswithin the visualisation [3]. The user can see the full rangeof the data’s many dimensions, and the relative frequenciesat which values on each axis are recorded. These featuresare visible in Figure 1, which shows context data from ouruser study, which we will describe in the next section.PCVs give users a global view of trends in the data whileallowing direct interaction to filter the data set as desired. Aset of parallel horizontal axes are drawn, which correspondto attributes of the readings in the system. In our case, thereadings are records of context data at a certain time, witheach axis representing a sensor in the system. Then, a set ofn-dimensional tuples are drawn as a set of purple polylineswhich intersect each axis at a certain point, corresponding tothe value recorded for that attribute. Discrete and quantitativeaxes can be presented in the same view.Figure 1. Our Parallel Coordinates Visualisation. This is a view of 96overlaid context traces with 8 data dimensions gathered over 3 days.Strong correlations can be seen between the three days recorded: thesubject spent the majority of all three days at their desk (the first valueon the “Location” axis), with some deviations due to coffee breaks orvisits to their supervisor’s office at irregular times.As all the polylines are being drawn within the same area, thetechnique scales well to large data sets with arbitrary numbersof attributes, presenting a compact view of the entiredata set. Axes can be easily appended or removed from thevisualisation as required by the dimensions of the data.As Parallel Coordinates have a tendency to become crowdedas the size of the data set grows larger, techniques have beendesigned to cluster or elide sub-sets of the data to allow thedominant patterns to be seen [1]. Direct interaction to filterand highlight sections of the data encourages experimentationto discover additional information.Hierarchical clustering [7] uses colour to visually distinguishcases that share a certain range of values into a number ofsets, increasing the readability of the diagram. We use asimilar technique to group case lines that are assigned to acertain situation, colour-coding these as a group. Differentsituations can be colour-coded so that the interplay of thecontext traces that correspond to them can be easily seen.EVALUATING SITUATIONS WITH SITUVISDescription & case-studySituation-awareness is commonly applied to adaptive systemsas a means to introduce useful cues for automatic behaviouradaptation. System developers are tasked with codifyingsituations that their system should respond to by tyingtogether loose configurations of sensor readings. Because ofthe constant fluctuation in the values of these sensor readings(due to minute changes in the property being measured, ordue to the accuracy of the sensor), situation definitions arefrequently composed of a set of ranged intervals that give thedeveloper some more latitude to cover more of the samplespace than if they had to define a situation for every possiblecombination of sensor readings. When these ranges areall logically conjoined and the value from each sensor fallswithin range concurrently, the behaviour attached to this situationis invoked.Situvis is built using Processing [13], a Java-based visualisationframework which supports rapid prototyping of visualisationtechniques. 1 Each context dimension is representedin Situvis as a vertical axis. Each axis is divided equallybased on the number of values that could be recorded forthis dimension. For example, the axis for location containssix points representing the symbolic locations that we choseto include in our analysis. A situation trace is representedas a polyline—a line drawn starting at the leftmost axis andcontinuing rightwards to the next adjacent and so on, intersectingeach axis at the point that represents the value thatthe context has in that situation trace. For example if, in agiven situation, a user’s computer activity level is “idle”, andtheir location is “canteen”, and these two axes are adjacent,then a line will be drawn between those two points. Eachsituation trace is plotted on the axes and the result is a viewof all of the situations, significant and insignificant, that occurredin the system over a period of time.In order to carry out our case-study, we required real contextdata with which we could characterise situations. Wechose to gather context data and situation annotations manuallyover a three day period. While the capabilities existto collect these context data automatically, we chose to collectthe data through manual journaling, so that we did not1 You can read more about Situvis and interact with a demo of thesoftware at http://situvis.com.64
Figure 2. A view of the Situvis tool showing 3 days of a user’s context, with traces annotated as being in a “meeting” situation highlighted (left). Thesesituations occurred at many different times throughout the day in two different locations, with a range of values for the other contexts. The user caninteractively expand or contract the situation definition along any of the axes. In this case, they have chosen to modify the situation specification toallow for more colleagues to be present, the noise level to be greater and the possibility of talking on the phone (right).need to factor in issues with the aggregation, uncertainty orprovenance of the context data.Our trial subject recorded their context every fifteen minutes(10am–6pm) for three consecutive weekdays. They capturedcontext in the form of time, location, noise-level, numberof colleagues present, their supervisor’s presence (true orfalse), their phone use (either taking a call or not), calendardata (being busy or having no appointments), and computeractivity. For simplicity, the noise-level was recorded on a4-point scale of quiet, conversation, chatty, and noisy. Likewise,computer activity level was scaled as idle for an houror more, idle for less than an hour, active, and highly active.We defined six symbolic locations: meeting room, canteen,sports center, supervisor’s office, subject’s desk, and a lecturetheatre. Figure 1 shows a view of the Situvis tool withall of these traces plotted together in one view.The subject also annotated what, if any, situation they werein at the time of data capture. These annotations are used inSituvis to identify situations that require specification in thesystem.Specifying situations with contextSituation specifications are structured according to the definitionwe discussed previously. Situvis enables a developerto select all occurrences of a given annotated situation, andadd further cases to this definition using interactive brushingof polylines, or by dragging a range indicator on the left ofthe axis to expand or contract the range of values coveredby this specification. The user can evaluate existing situationspecifications overlaid against actual trace data and seewhere they need to be modified.An example of this process can be seen in Figure 2. Thetrial subject annotated multiple occurrences of a “Meeting”situation. By selecting these traces, it is evident what contextdimensions characterise them. We can see that “Time”and “Supervisor presence” are not useful due to the multiplesplit lines on their axes. Hence they are ineffective whendefining constraints. The specification is clear from the otherdimensions, however, and could be expressed as:{1 ≥ No.colleagues ≤ 2}∧{Location = (meeting room∨ supervisor’s office)}∧{Phone use = none}∧{Computer activity ≥ idle}∧{Noise-level = conversation}∧{Calendar = busy}None of these values alone can characterise “Meeting”, asthe trace data illustrates. Furthermore, each dimension maynot always be available. Situvis allows one to identify combinationsof dimensions which, when taken together can providea good estimation of the situation. For example, “Location”taken with “No. of colleagues” is a good indication of“Meeting”, as the interval that they create does not containpolylines that characterise different situations. This can alsogive system developers an insight into which sensors in theirsystem are the most useful, and which types of sensors theyshould invest in to gain the most added benefit in terms ofthe expressiveness of their system.Situation evolutionWhen existing specifications are overlaid on the trace polylines,the developer can see where specifications are too strongor weak. Constraints that are too strong will cause the systemto sometimes fail in determining when that situation isoccurring. Constraints that are too weak may be wrongly interpretedas an occurrence of the specified situation, when infact a different situation is occurring. When the overlaid situationencompasses traces that are not relevant, the user canstrengthen the constraints. Similarly, the user can weaken65
constraints to include traces that happen to fall outside theexisting specification.We hypothesise that as more trace data is added and annotated,the constraints that we have defined for “Meeting”may be too strong. By overlaying our specification on topof the polylines, it will be obvious where constraints needto be strengthened, weakened or even excluded altogether.Situvis enables a developer to drag the boundaries of specificationsto change the polylines that they cover, essentiallychanging the constraints of the situation.Situation evaluationContext-aware adaptive systems are very sensitive to incompatiblebehaviours. These are behaviours that conflict, eitherdue to device restrictions, such as access to a public display,or due to user experiences, such as activating music playbackwhile a meeting is taking place. Situations are closely tied tobehaviours—they define envelopes in which behaviour occurs.As a result, their specifications are directly responsiblefor compatibility requirements. By harnessing this factor,we can address another key aspect of situation evaluation.Conceptually relating situations to each other from a behaviourcompatibility standpoint is an overwhelming taskfor a developer. We recognise that there are two situationrelationships that may lead to incompatibility:subsumption if a subsumes b, and b occurs, then a will certainlyoccur.overlap if a overlaps b, then a and b may co-occur.Our tool allows multiple situation specifications to each becoloured distinctly. When two or more situations are showntogether, the overlap in their constituent contexts is clear, aswell as the scope of their dissimilarities. This view allowsthe developer to alter constraints where necessary, while theoverlap and subsumption relationships are refreshed and displayedon-the-fly. A screenshot of this scenario is seen inFigure 3.DISCUSSIONWe have shown, using a case-study, the utility of Situvisin the situation specification and evaluation processes. Thetraditional approach to situation specification is subject tolimitations: context constraints are based on static definitionsof these concepts in knowledge representation structures(e.g., ontologies); they are derived from a developer’sconceptual understanding of certain situations; and do notcontain methodologies for ensuring soundness and completeness.To address these limitations, Situvis presents a developerwith a reference point for situation specification andevaluation through the display of actual trace data and situationannotations. The relevance of context to a specificationis made clear, and contrasting situation traces can be used asa guide for specification.Context-aware systems are dynamic—sensors, users and habitsare constantly changing. Hence, we cannot expect situationspecifications to remain static. It must be possible toFigure 3. A view of two distinct situations. The higher blue range isa meeting situation, whereas the lower green range is a seminar thatoccurred after normal work hours. The dissimilarities between thesesituations are clear from the tool, and the specifications can be furtherteased apart if required.re-evaluate them accordingly. Current approaches entail themodification of constraints based on data logs or experience.Situvis allows developers to visually overlay specificationson traces, and tailor their constraints as a result. Unlike traditionalmethods, Situvis clearly depicts cases where constraintsare too strong or too weak.In addition, we have identified a scenario that a tool like Situviscould address in the future. It is concerned with the notionof closeness of situations. Two situation specificationsare close if small changes in context can cause an evolutionfrom one to the other, a property easily identified from contextconstraints. Close situations may be significant as thetransition step from one to the other is small in terms of probablecontext changes. Visualising these relationships in Situviswill allow a developer to identify the following: suggestionsof areas where the situation associated with a behaviourmay be incomplete; and points where the system behaviourmay be unstable. The former is used to increase developerawareness of situation-behaviour associations that they mayhave omitted. The latter is useful for highlighting obtrusivebehaviours associated with close situations—points where asee-saw-like cycle from one to another may occur in a shorttime frame, resulting in an erratic user experience. One canthus introduce inertia by strengthening constraints, makingthe transition step between them larger.Some contexts may be relevant only when combined withother dimensions. Ideally, we would display all of the contextinformation that is available in the system for a particularsituation annotation. A developer could then eliminatecontexts that are not useful based on visual analysis. However,we have yet to evaluate the feasibility of this approachin large-scale systems.Some other context dimensions are also not easily representedon a line. In particular, Location, with its domain66
elations like subsumption, is difficult to represent in twodimensions. We are researching techniques to flatten hierarchiesfor a more intuitive representation.CONCLUSIONS AND FUTURE WORKWe have presented Situvis, a tool in development which usesa Parallel Coordinate Visualisation to illustrate situation tracesand specifications. The tool assists developers in describingsituations through direct interaction, providing a naturalinterface for a developer of context-aware systems. Bystacking many instances of context together in one view, itbecomes simple to inspect the correlation between situationspecifications and the actual situations that occur during deployment.Situvis enables a developer to evaluate the soundnessand completeness of situation specifications within theframework of real data.By visually analysing the overlap of situation specificationswithin their system, the developer can identify where multiplesituations require similar context values to be activated.Such overlaps may imply problems in the situation specifications,as conflicting behaviours may be triggered by conceptuallysimilar situations. Thus, the developer can comparesituations against others, and change the situation’s specificationsto become stronger or weaker as necessary.We are developing a metric of the closeness of situationsfor use in evaluating soundness and completeness. Closesituations may frequently occur one after the other, whichmay lead to unpredictable system behaviour from a user’sperspective. We hope that the Situvis tool will prove usefulin helping to avoid this oscillation.A weakness of the current version of the Situvis tool is thatit does not explicitly support probabilities in situation specifications.In many context-aware applications, robust probabilisticinference is a requirement to handle the naturallyfuzzy data in the system. We are considering the addition ofan overlay which will allow users to set up a probability distribution,though this requires a more in-depth study of thetreatment of uncertainty in situations.We are ongoing in our investigation of properties of situationsthat can be exploited for further evaluation. For example,Situvis could also be used by users of the context-awaresystem as a gateway to user programming: helping them tounroll the cause of a situation activation, so that they cangain insight into why the system began to behave as it did.Acknowledgements: This work is partially supported by anEMBARK Scholarship from the Irish Research Council forScience, Engineering and Technology and by Science FoundationIreland under grant number 03/CE2/I303-1, “LERO:the Irish Software Engineering Research Centre.”REFERENCES1. A. Artero, M. de Oliveira, and H. Levkowitz.Uncovering clusters in crowded parallel coordinatesvisualizations. Information Visualization, 2004.INFOVIS 2004., pages 81–88, 2004.2. P. Ball. Data visualization: Picture this. Nature,418(6893):11–13, 2002.3. S. Card, J. Mackinlay, and B. Schneiderman. Readingsin Information Visualization: Using Vision to Think.Morgan Kaufmann, 1999.4. A. K. Clear, S. Knox, J. Ye, L. Coyle, S. Dobson, andP. Nixon. Integrating multiple contexts and ontologiesin a pervasive computing framework. In Contexts andOntologies: Theory, Practice and Applications, pages20–25, Riva Del Garda, Italy, August 2006.5. J. Coutaz and G. Rey. Foundations for a theory ofcontextors. Computer Aided Design of User Interfaces,2002.6. A. K. Dey. Understanding and using context. PersonalUbiquitous Computing, 5(1):4–7, 2001.7. Y.-H. Fua, M. O. Ward, and E. A. Rundensteiner.Hierarchical parallel coordinates for exploration oflarge datasets. In VIS ’99: Proceedings of theconference on Visualization ’99, pages 43–50, LosAlamitos, CA, USA, 1999. IEEE Computer SocietyPress.8. K. Henricksen. A Framework for Context-AwarePervasive Computing Applications. PhD thesis, TheSchool of Information Technology and ElectricalEngineering, University of Queensland, September2003.9. A. Inselberg and B. Dimsdale. Parallel coordinates: atool for visualizing multi-dimensional geometry. In VIS’90: Proceedings of the 1st conference on Visualization’90, pages 361–378, Los Alamitos, CA, USA, 1990.IEEE Computer Society Press.10. S. Knox, A. K. Clear, R. Shannon, L. Coyle, S. Dobson,A. J. Quigley, and P. Nixon. Towards Scatterbox: acontext-aware message forwarding platform. In FourthInternational Workshop on Modeling and Reasoning inContext in conjunction with Context ‘07, pages 13–24,Roskilde, Denmark, August 2007.11. S. W. Loke. Representing and reasoning with situationsfor context-aware pervasive computing: a logicprogramming perspective. The Knowledge EngineeringReview, 19(3):213–233, 2005.12. A. Quigley, D. Leigh, N. Lesh, J. Marks, K. Ryall, andK. Wittenburg. Semi-automatic antenna design viasampling and visualization. Antennas and PropagationSociety International Symposium, 2002. IEEE, 2, 2002.13. C. Reas and B. Fry. Processing: a learning environmentfor creating interactive web graphics. In SIGGRAPH’03: ACM SIGGRAPH 2003 Sketches & Applications,pages 1–1, New York, NY, USA, 2003. ACM.14. T. Tenev and R. Rao. Managing multiple focal levels intable lens. Infovis, 00:59, 1997.15. J. Ye, A. K. Clear, and S. Dobson. Towards a formalsemantics for pervasive adaptive systems. Underrevision for The Computer Journal, 2008.67
Simulation Framework in Second Life with EvaluationFunctionality for Sensor-based SystemsBoris Brandherm 1 , Sebastian Ullrich 1,2 , Helmut Prendinger 11National Institute of Informatics, 2-1-2 Hitotsubashi, Chiyoda-ku, 101-8430, Tokyo, Japan2Virtual Reality Group, RWTH Aachen University, 52074 Aachen, Germany{boris, helmut}@nii.ac.jp, s.ullrich@ieee.orgABSTRACTThis paper describes a simulation framework for sensorbasedsystems utilizing “Second Life”, a popular virtualthree-dimensional multi-user online world. Withthis platform, the components of a sensor-based systemcan be mapped to (or, represented by) virtual counterparts.The intuitive user interface of Second Life and itscomprehensive visualization support evaluation tasks ofubiquitous computing applications. Developers can directlycontrol and manipulate virtual counterparts ofreal devices. In this way, different settings of a sensorbasedsystem can be tested. The main contribution ofour work consists of a bi-directional interface betweensensor-based systems and Second Life.ACM Classification KeywordsI.6.7 Simulation and Modeling: Simulation Support Systems—EnvironmentsGeneral TermsDesign, ExperimentationAuthor KeywordsSimulation, testbed, sensor-based systems, evaluation,Second LifeINTRODUCTIONUbiquitous computing environments and sensor-basedsystems are highly active fields of research. Many excitingnew devices are being developed and the amountof powerful and versatile sensors is rapidly increasingthrough the advances in embedded systems and technologicalevolution.The implementation, testing and evaluation of new ubiquitoussystems in a real environment are laborious tasks.Significant time and effort has to be spent on designingand testing prototypes and simulators in order to avoidCopyright is held by the authors. <strong>UbiComp</strong> ’08 Workshop W2 –Ubiquitous Systems Evaluation (USE ’08) September 21st,2008 This position paper is not an official publicationof <strong>UbiComp</strong> ’08.unforeseen problems, e. g. , regarding optimization, beforethe system is actually installed. While simulatorsfor specific types of sensors are available, it is still difficultto evaluate a heterogeneous complex system. Hencethe visualization of all the simulated sensor data is desirableand an intuitive interaction capability to changethe parameters and spatial position of the devices wouldbe helpful to optimize the system.Because of these requirements, we propose a three-dimensional(3D) virtual environment for the simulation,testing and evaluation of sensor-based systems. Besidesextensive research in virtual reality, nowadays even gameengines and multi-user online worlds provide convincing3D environments. So, instead of creating a new3D-engine, we decided to use the 3D environment ofSecond Life [14]. In Second Life (SL), 3D content includingbuildings and props can be created easily, andanyone can interact with the environment in the formof an ‘avatar’ (a human-controlled graphical representationof the user).The rest of the paper is structured as follows. We startwith a brief review of related work. To motivate themerit of our simulation framework, we then report onthe experience with an existing sensor-based system.After that, we explain two different approaches to simulation.First, we describe a rapid-prototyping approachfor SL, and discuss its benefits and shortcomings. Second,we describe our own simulator framework [3, 16],and explain its functionality with respect to evaluationof sensor-based systems. We give an example whereour system is used to evaluate the performance of anindoor-positioning system. The paper concludes with adiscussion and summary.RELATED WORKCurrently, the development, testing and evaluation ofnew systems is realized in different ways, ranging fromreal-world testing and evaluation [4] and miniature mockupsfor prototyping, to software-based simulators [1,11]. Recent testbeds are MoteLab [17] for wireless sensors,eHomeSimulator [1] for smart environments, andubiBuilding Simulator [11] for large scale context-awaresystems. While these software-based testbeds are farmore practical than physical models, all of them arelimited to testing in two-dimensional space.68
Ubireal [10] is a 3D simulator for smart environments.Yet, its focus lies on systematic testing to verify rulesand user-specified programming between different smartdevices and sensors. There is no support for interactiveexploration and testing. Another simulator, calledTATUS [12], is based on the Half-Life game engine. Thesystem focuses on human interaction with ubiquitouscomputing environments rather than the setup of suchenvironments.While all these approaches demonstrate promising features,they either (1) do not work as testbeds for simulation,or (2) provide specialized (non-generic) solutions,or (3) lack 3D interaction with the simulated virtualenvironment.Let us now take a closer look at solutions that feed realworlddata from sensors into SL and/or SL data into thereal world (e. g. to control a device). In [8] data froma specialized power-plug based sensor network are fedinto the virtual world by means of a (latency restricted)SL script-based implementation of a XML-RPC protocol.The data is used for visualization but there is nosupport for interaction with it. [9] is a work where sensorsembedded in commercial mobile phones are usedto infer real-world activities (whether the user is idle,walking or running), that in turn are mapped to visualmetaphors in the virtual environment. [5] reports abouta real-world control panel that can both control objectsin the virtual world of SL and in turn be controlled bythem. Changes to the knobs or pushbuttons in the realworld are translated to their virtual counterparts in SL,and pushing the virtual buttons controls the LEDs onthe real world control panel.Although these approaches demonstrate interesting results,(1) they are not generic, (2) they don’t provide adirect bi-directional feedback loop (e. g. if we control areal device via the virtual counterpart from inside SLand the status of the real device changes this change isimmediately fed into and represented in SL again andvice versa.) and (3) they don’t take into account thecontext of the devices in the environment (e. g. the positionand the orientation of a sensor can be crucial forthe system behavior like a indoor positioning system).Because of the lack of interactive and generic solutions,we have created a bi-directional simulation frameworkfor SL [3]. This system has been extended from a scriptedsimulation within SL to a more flexible interface andwill be described by an example application.EXAMPLE APPLICATIONPositioning systems are often used in ubiquitous computingenvironments. As a simple motivating examplefor our simulation framework, we chose an existing indoorpositioning system [2]. Sensor placement for sucha system is a non-trivial task as it depends on severalfactors such as the infrastructure, the amount and typeof available sensors, and interferences.Figure 1. Example of the simulated positioning systemin Second Life with a Visitor Avatar experiencing thesystem and a Developer Avatar who is interactively adjustingthe properties of a virtual RFID tag.The system described in [2] features different kinds ofsensors and emitters: infrared beacons and radio-frequencyidentification (RFID) tags. The accuracy of thepositioning system depends on the good placement ofthese sensors and emitters in the environment. Theuser carries a mobile device, which is equipped with thecorresponding sensors. On this device the position ofthe user is computed based on the received sender dataand afterwards displayed on a 2D map on the device.When the system was installed in the environment, initialtrials to improve accuracy by adding additionalemitters failed. Furthermore, in boundary regions ofthe emitter field some unexplainable artifacts appearedin the position calculation. These open issues could beresolved easily in our SL based simulation system, asdescribed in the following sections.RAPID PROTOTYPING IN SECOND LIFEOur first approach was to investigate the simulation capabilitiesof SL. Therefore we used the official API of SLthat is called “Linden Scripting Language” (LSL). Thisprogramming language allows one to assign scripts toin-world objects. With over 300 library functions anddifferent data and message types, scripts can controlthe behavior of virtual objects and communicate withother objects and avatars (users of SL). Limitations ofLSL include time delays for movement of objects (0.2sec) and memory constraints for scripts (16 KB). Theseconstraints have a high impact on the achievable simulationaccuracy, response times, and achievable simulationcomplexity within SL.To simulate the previously discussed positioning systemwe created virtual objects in SL that represent RFIDtags and can be positioned within the virtual environmentinteractively (see Fig. 1). Visitors who wish to be69
VirtualEmitterEstimatedPositionVirtualEmitterSignal StrengthSignal StrengthVirtualPDAwithRFIDSensor Figure 2. Conceptual overview of the example application:the virtual PDA reads the signal strengths of thevirtual emitters and calculates an estimated position. positioned by the system in SL have their avatar take acopy of a PDA object. The virtual PDA embeds a LSLscript that is the core of the simulated positioning systemand performs the calculation of the position. ThePDA communicates with the virtual emitters and takesthe signal strength to estimate the position, just as thereal system (see Fig. 2). In the real world application,the result is shown on a 2D map on the PDA. In SL thecalculated position is visualized in three dimensions, asa floating sphere in the virtual environment (see Fig. 1).If a user logs in to SL as a “visitor avatar”, he or shecan experience and interactively test and evaluate thesensor-based system. As a “developer avatar” the usercan additionally adjust the virtual sensors and devicesin the virtual environment.The artifacts in the example application could be experiencedin the simulation in SL. In both cases the signalrange of the RFID tags has been too high compared tothe distance of each RFID tag to another. This explanationwas found after interactive testing (repositioningthe sensors and adjusting their sender range). Consequently,the best results were achieved with just a smalloverlapping of the RFID signals.Benefits of this approach include the ability of rapidprototyping of coarse simulations with reduced complexityand no need for additional software or servers:the scripts in SL reside within the objects. Shortcomingsof this approach are the aforementioned limitationsof the scripting language. Additionally, it can be verytedious or even impossible to map the functionality ofan existing system into LSL. A better solution is toprovide an interface to reuse existing systems, this approachis described in the following section.SIMULATION FRAMEWORK WITH TWIN-WORLD MEDIA-TOROur architecture (Fig. 3) consists of three components:(1) the Twin-World Mediator, (2) a sensor-based sys-Figure 3. Architecture that embeds existing sensorbasedsystems (2) with Second Life (3) through theTwin-World Mediator (1).tem, and (3) the SL 3D environment. The main task ofthe Simulation Framework is to provide an interface toexisting systems, sensors and simulators and to mediatethe exchange of data with SL for visualization andinteraction.In the following we first describe the architecture inmore detail. To illustrate the usage of the system, weshow how we embedded our example application.Components of the ArchitectureThe Twin-World Mediator (1) consists of the Mediator,the Message Proxy, the Interface and a database. Thekey component of the simulation framework is the Mediatorwhich handles the data exchange between MessageProxy, Interface and the database of the simulationframework. It ensures the data exchange of the componentsof the sensor-based system with their virtualcounterparts in SL.A sensor-based system(2) typically consists of softwaresystems and sensors & devices. Simulators are usedfor unavailable sensors and devices. The componentsof the sensor-based system register as listeners throughthe interface for the desired data.The Message Proxy connects to Second Life(3) and gathersdata about the components in SL and sends them tothe Mediator. We are especially interested in the stateof the avatars, the virtual sensors & devices, and thevirtual environment because they represent the virtualcounterparts of the sensor-based system which is to betested based on their data. Obstacles in the virtual environmentsuch as walls and other objects can influencethe simulation.70
virtual sensors and devices). In those objects we haveembedded specific LSL scripts to send the updates tothe message proxy (see below).Update Scripts for Virtual ObjectsThe example LSL script (shown in Fig. 4) continuouslysends updates about position changes and/or rotationwith a predefined refresh rate (here 20 times per second).During each refresh cycle first the rotation andthe position of the object are determined by the functionsllGetRot and llGetPos. The new values are thencompared with the previous values in order to determinewhether the rotation and/or the position of theobject has changed. Only the changes are transmitted(function llSay) to keep the traffic low. It depends onthe object which refresh rate is necessary and which object’schanges (e. g. rotation, position, size or color) hasto be transmitted. For example, for a RFID tag onlythe position is important and a refresh rate of 4 timesper second is sufficient. The scripts are rather easy tounderstand and therefore quite easy to adapt for theirspecific task.Figure 4. Example of an update script for virtual objects,which informs about changes of position and/or rotationand is implemented in the Linden Scripting Language.One of the most important differences to previous andrelated work is that the message proxy uses communicationmethods of both the scripting language LSL,and the libsecondlife API [7]. (Libsecondlife is an unofficialAPI that interfaces SL as a client and enablesaccess to data of the virtual environment.) Thus theperformance can be improved, technical limitations likethe time limitations of the XML-RPC method of theLSL are circumvented, and SL can be interfaced moreeffectively.System SetupIn the following we explain how to integrate an existingsystem to our architecture. As an initial step the simulationframework has to be prepared for the specificsimulation task. The developer has to register the existingsensor-based system with its hard- and software,in order to inform the simulation framework which data(from SL or other components) are required for the simulationtask. This is done by registration as listenerthrough the interface for the desired data.In our example the sensor-based system consists of thePDA positioning software, and a simulator for the behaviorof the RFID tags. The required data from SLcomprises the coordinates and the orientation of theemitters, sensors, and avatars.The Twin-World Mediator configures the message proxyaccording to the registered listeners. Then, the messageproxy connects to SL and continuously listens (inSL) for the requested data and communicates it to thedatabase of the Twin-World Mediator. Some objectsare static and their data will be gathered only in theinitial step (e. g. parts of the virtual environment likewalls), whereas other objects are potentially moving; sothey have to report about their changes (e. g., avatars,Simulation UpdateAfter the system has been initialized, the Twin-WorldMediator synchronizes the update loops of the sensorbasedsystem and of SL to allow for development andtesting with 3D interaction and visualization. As saidbefore, the static data is collected only once (to savebandwidth) and sent to the database of the Twin-WorldMediator.In the second step the message proxy continuously collects(in an infinite loop) all the subscribed dynamicdata and sends it to the mediator. The Twin-WorldMediator notifies data changes to the listeners of thecomponents of the sensor-based system. Then the componentsprocess this data and send the results back tothe Twin-World Mediator. Data which is meant to bevisualized in SL is sent via the message proxy to SL.In the case of our example (the indoor positioning system),the coordinates of the virtual RFID tags in SL aresent to the RFID-simulator. The coordinates and orientationsof avatars are also sent to the simulator. Thesimulator computes the results and sends them back totheTwin-WorldMediator,whichinturndeliversthedata to the positioning system. In our case the PDApositioning system has been slightly modified in order71
odies) then our approach would facilitate the evaluationof a sensor-based system and it even would enableto compare two different sensor-based systems with thesame data under different conditions. Figure 5. Basic evaluation of an indoor positioning systemby comparing different sensor ranges and measuringthe accuracy/deviation (i) sensor range 5 meters and(ii) sensor range 6.5 meters.to be able (i) to receive the simulated sensor data of thevirtual RFID tags, and (ii) to provide the estimated userposition for the Twin-World Mediator.The positioning system sends its results (the estimatedposition of the avatar) to the Twin-World Mediator.The message proxy takes this data and visualizes it inSL. We use a sphere to indicate the estimated position ofthe avatar in SL. In this way, the developer can inspectthe results of the positioning system in SL (see Fig. 1).In the following section we show how this can be extendedfor the evaluation of a sensor-based system.EXAMPLE EVALUATION OF SENSOR-BASED SYSTEM[4] reports about the evaluation of the accuracy of ainstalled tag-based location system (Ubisense [15]) andthe influence of the human body on it based on thefact that many tag-based systems use communicationfrequencies that cannot pass easily through the humanbody. To measure the accuracy of the system, they usea combination of definitions suggested by [6].As a simple example how our approach could be usedfor the evaluation of a sensor-based system we comparethe accuracy with different system settings. To measurethe accuracy of the estimated position the deviationis computed by calculating the distance betweenthe real position of the avatar and the estimated position.The measured deviation of the estimated positionis displayed on the top of the positioning sphere (seeFig. 5). Obviously, the evaluation of a sensor-basedsystem with our approach heavily depends on the qualityof the used simulators. If the simulator takes intoaccount obstacles for the sensors (like walls or humanIn Fig. 5, the aforementioned indoor positioning systemis tested with two different sensor ranges of theRFID sensor. RFID tags are placed on a uniform gridwith 6 meter spacing. The Positioning Sphere I indicatesthe estimated position for a RFID sensor witha sensor range of 5 meters and shows a deviation of0.4041 meters. Positioning Sphere II, which indicatesthe estimated position for a RFID sensor with a sensorrange of 6.5 meters, shows a better accuracy (deviation0.0246 meters) than Positioning Sphere I. Thus the issuesthat have been encountered with the real system(as mentioned before in Example Application), could beevaluated in a virtual setup and lead to the conclusionthat the best results are achieved with a small overlappingof the RFID signals. With the current RFIDtag placement in the environment Positioning Sphere IImatches this condition better than Positioning Sphere I.So far, we compared the system behavior of the sameindoor positioning system with different sensor rangesand placements of the RFID tags in the environment.But obviously, modified versions of the current underlyingalgorithm or completely distinct algorithms could becompared with each other (using their best sensor rangeand RFID tag placement in the environment). For theevaluation of systems other metrics than the deviationcould be desirable. The values of these parameters canbe fed into the system via the Twin-World Mediator anddisplayed on the top of the positioning sphere as well(by a short LSL script). In addition to text-display,color-coding and resizing can also be realized with LSL.DISCUSSION AND CONCLUSIONSThe paper proposes a novel simulation framework basedon the 3D virtual environment of SL, which can be usedas an evaluation testbed for sensor-based systems. Acore feature of our approach is the bi-directional interactionwith our Twin-World Mediator. Events fromthe real world are reflected to the virtual world and viceversa.With the example of a positioning system we have illustratedhow our simulation framework can be used andhow the virtual environment can be utilized for evaluationand optimization purposes.Furthermore, the architecture is flexible and extensibleand thus ensures that new sensor types, such as temperaturesensors, accelerometers, or light sensors, canbe included. Spatial characteristics of devices can bemodeled and visualized to easily identify problems andinterferences, e. g. when walls or other objects in thevirtual environment influence the characteristics of thedevices. Sophisticated simulators can also be adaptedand connected to the system. Metrics for evaluation72
purposes can be updated via the Twin-World Mediatorand visualized in SL.The 3D interaction capability of SL combined with theembedded simulators offers many advantages and opportunities.Virtual sensors and devices can be movedintuitively by ‘direct’ (avatar-mediated) manipulation(Fig. 1) and their parameters can also be changed easilyby editing the object properties through the user interfaceof SL. Most importantly, these changes can also befed back in real-time via the Twin-World Mediator andaffect the connected system.In our future work, we plan to implement a user-friendlyinterface and toolbox for developers of ubiquitous computingsystems. To reach a broader audience and ensurehigher flexibility, the Twin-World Mediator will beadapted to the emerging and open-source virtual worldssystem OpenSimulator [13]. Furthermore, we intendto use the simulation framework for running systematicexperiments of sensor-based systems. Specifically,computer-controlled agents, i.e. SL “bots”, will populatethe environment, and the behavior of the sensorbasedsystem will be evaluated in the multi-agent setting.REFERENCES1. I. Armac and D. Retkowitz. Simulation of smartenvironments. In IEEE International Conferenceon Pervasive Services (ICPS’07), pages 257–266.IEEE Computer Society Press, 2007.2. B. Brandherm and T. Schwartz. Geo referenceddynamic Bayesian networks for user positioning onmobile systems. In Proceedings 1st InternationalWorkshop on Location- and Context-Awareness(LoCA’05), pages 223–234. Springer LNCS 3479,2005.3. B. Brandherm, S. Ullrich, and H. Prendinger.Simulation of sensor-based tracking in Second Life.In Proceedings of 7th International Conference onAutonomous Agents and Multiagent Systems(AAMAS’08), pages 1689–1690. ACM Press, 2008.4. L. Coyle, J. Ye, E. Loureiro, S. Knox, S. Dobson,and P. Nixon. A proposed approach to evaluatethe accuracy of tag-based location systems. InUSE 07: Workshop on Ubiquitous SystemsEvaluation. <strong>UbiComp</strong> Workshop Proceedings,pages 292–296, 2007.5. A. Fundinger. Real Life Control Panel for SecondLife.http://channel3b.wordpress.com/2007/01/24/reallife-control-panel-for-second-life/,January2007.6. J. Hightower and G. Borriello. Location systemsfor ubiquitous computing. Computer, 34(8):57–66,2001.7. libsecondlife. http://www.libsecondlife.org.8. J. Lifton, M. Feldmeier, Y. Ono, C. Lewis, andJ. A. Paradiso. A Platform for Ubiquitous SensorDeployment in Occupational and DomesticEnvironments. In Proceedings of the 6thInternational Symposium on InformationProcessing in Sensor Networks (IPSN), pages119–127, 2007.9.M.Musolesi,E.Miluzzo,N.D.Lane,S.B.Eisenman, T. Choudhury, and A. T. Campbell.The second life of a sensor: Integrating real-worldexperience in virtual worlds using mobile phones.In Proceedings of 5th Workshop on EmbeddedNetworked Sensors (HotEmNets 2008). ACM,2008.10. H. Nishikawa, S. Yamamoto, M. Tamai,K. Nishigaki, T. Kitani, N. Shibata, K. Yasumoto,andM.Ito.UbiREAL:Realisticsmartspacesimulator for systematic testing. In Proceedings ofthe 8th International Conference on UbiquitousComputing (<strong>UbiComp</strong>2006), Springer LNCS 4206,pages 459–476, 2006.11. Y. Oh, A. Schmidt, and W. Woo. Designing,developing, and evaluating context-aware systems.In 2007 International Conference on Multimediaand Ubiquitous Engineering (MUE’07), pages1158–1163. IEEE Computer Society, 2007.12. E. O’Neill, M. Klepal, D. Lewis, T. O’Donnell,D. O’Sullivan, and D. Pesch. A testbed forevaluating human interaction with ubiquitouscomputing environments. In Proceedings of the 1stInternational Conference on Testbeds andResearch Infrastructures for the DEvelopment ofNeTworks and COMmunities, pages 60–69. IEEEComputer Society, 2005.13. OpenSimulator. http://opensimulator.org.14. Second Life. http://secondlife.com.15. P. Steggles and S. Gschwind. Ubisense-a smartspace platform. Technical report, Ubisense, May2005.16. S. Ullrich, B. Brandherm, and H. Prendinger.Simulation Framework with Testbed forSensor-based Systems in Second Life. InProceedings of 10th International Conference onUbiquitous Computing (<strong>UbiComp</strong> 2008) DemoSession. ACM, 2008.17. G. Werner-Allen, P. Swieskowski, and M. Welsh.MoteLab: a wireless sensor network testbed. InIPSN ’05: Proceedings of the 4th internationalsymposium on Information processing in sensornetworks, pages 68–73. IEEE Press, 2005.73
Design and Integration Principles for Smart ObjectsFahim Kawsar, Michael Beigl, Kaori Fujinami, Gregor Schiele,Jin Nakazawa, Susanna Pirttikangas, Tsutomu TeradaWORKSHOP GOALS AND TOPICSTagging everyday objects with sensors, actuators and buildingan instrumented environment are recent practices in industryand academia. In fact, the smart object domain hasmatured over the years. The combination of Internet andtechnologies like near field communications, real time localization,sensor networking etc. are bringing smart objectsinto commercial use. Several successful prototypesand applications have already demonstrated and deployed.However, the lack of commonality among the design principlesand the underlying infrastructures of these projects ishindering the exciting future of smart object systems. Webelieve the primary reason behind this phenomenon is onemissing rationale for the design and integration of smart objects.Now it is the time to focus on current practices andalign on some key issues to continue the rapid progress ofsmart objects. The intention of DIPSO 2008 is to bring togetherresearchers and practitioners from a wide variety ofdisciplines with the goal to discuss, identify, share experiencesand formalize key issues surrounding the challenge ofbuilding scalable, interoperable smart objects and associatedsystems. Instead of narrowly focusing on new technologies,we are more interested in extracting practices from existingsystems and in refining them through collaborative discussions.The immediate goal will be to investigate the key issuesfrom a variety of angles influenced by the experienceand the background of the participants. The ultimate goalwill be to formalize the design and integration rationale ofsmart objects and to define research challenges to stimulatefurther research. Some key challenges that will be addressedin the workshop include:1. Design, Development and Representation of Smart Objects:What are the design principles for smart objects?How to describe smart objects, what information do theycarry, where does this information come from, what qualityattributes does this information need to have? What isthe relationship between the physical nature and the digitalfunctionality of smart objects ? What kind of frameworkis suitable for selecting sensors and actuators? Whatkind of smart objects are suitable for a specific applicationdomain and why? What are the difficulties in buildingeconomically feasible smart objects?2. Integration and Co-operation Models of Smart Objects:What is the best approach to integrate smart objects intopervasive applications? Do we need an external dedicatedinfrastructure or should objects be built with communicationcapabilities? How to remonstrate the resource constraintsof embedded platforms? How to represent theecological relationship of smart objects? How to deploysmart object systems? How to enable end users to entail asmart space?3. Interaction Paradigm: What is the appropriate interactionparadigm of smart objects? How to incorporate thesmart features to an object while keeping its interactionmetaphor intact? What novel enabling technologies arerequired to support the interactions ?4. Application Scenarios with Smart Objects: What kindsof application scenarios will be benefited from what kindof smart objects? What kinds of services are expectedfrom smart objects by applications? What are the drivingeconomical factors that will influence smart object basedapplication developments?5. Critical Success Factors: What are the critical factors forthe success of smart objects and how are they addressed?This may include, e.g. usability, security and energy efficiency.We need a much better understanding of smart objects to approachthe above mentioned challenges. In order to improveour understanding of these topics and to facilitate discussions,the workshop will be structured around the followingthree agendas :1. Identifying the modalities of smart objects and smart objectsystems?2. Identifying the primary design principles of smart objects.This can be decomposed into two questions: How to mapan objects digital functions into it’s physical appearanceand how to select the augmentation role considering theirpotentiality and affordability in applications?3. Identifying the appropriate way of integrating and deployingsmart objects in existing or new environment. Identifyingthe role of end users in deployment tasks?Expected OutcomeWe hope, the workshop will contribute in establishing a multifacetedresearch community in the smart object domain area.The expected outcomes are:1. Survey of state-of-the-art work on smart object systemsincluding the overview of existing prototypes and applicationscenarios.2. Design and integration rationale of smart objects focusingon the existing practices that will provide a solid basefor the rapid progress of smart object systems and stimulatingfurther research in this area by identifying futuredirections.74
Advanced Middleware Support on Wireless Sensor NodesDaniel Barisic, Guido StrombergInfineon Technologies AG81726 Munich, Germanydaniel.barisic,guido.stromberg@infineon.comABSTRACTState of the art solutions employ gateways for protocol translationbetween wireless sensor networks (WSNs) and IT systems,which results in significant management overhead forWSN deployments. In this paper, we investigate the feasibilityof IT middleware support on the sensor node itself toeliminate the need for gateways. A major challenge in thisrespect is the storage of relatively large network messagesinside a sensor node, which might easily exceed the availableresources. This turns the efficient utilization of memory intothe key requirement for middleware support on sensor nodes.In order to cope with this, we derive and analyze a genericlayer model for protocol processing and inspect implicationson the memory requirements for each layer. Cross layer optimizationis employed to gradually develop an architecture inwhich application relevant information is directly extractedfrom network packets, which drastically minimizes the overallmemory consumption. We finally present the first implementationof a Universal Plug and Play (UPnP) protocolstack for sensor nodes. Measurements confirm the feasibilityof UPnP support for even highly restricted nodes and suggestthat support for more complex protocols is possible.Author KeywordsWSN, Middleware, SOA, UPnPACM Classification KeywordsD2.11 Software Architectures: Domain-specific architectures,C2.4 Distributed Systems: Distributed applicationsINTRODUCTIONMotivated by the vision of ubiquitous computing, researchon wireless sensor networks (WSNs) aims at the developmentof small, intelligent, networked sensors and actuators.These are used to create added value in diverse applicationdomains like home automation, habitat monitoring, military,industrial automation or safety. Advancements in this areahave already brought forth solutions in form of hardwareand software [3] that are mature enough to be adopted inreal world applications [10]. Having mature technology as aCopyright is held by the author/owner(s).<strong>UbiComp</strong>’08 Workshop 4: Design and Integration Principles for Smart Objects(DIPSO 2008), September 21, 2008, Seoul, Korea.This position paper is not an official publication of <strong>UbiComp</strong> ’08Michael BeiglDistributed and Ubiquitous Systems Group,Technical University Braunschweig38106 Braunschweig, Germanybeigl@ibr.cs.tu-bs.debasis, the question on how to leverage the potential of WSNsbecomes more and more important. Some researchers envisionautonomous WSNs which use in-network processing tosolve a certain task [7, 8]. For this purpose, new programmingapproaches and communication protocols have beendeveloped. In other areas, like e.g. industrial automation, theWSNs are envisioned to extend the reach of IT systems intothe physical world [4, 9], thus calling for the convergence ofWSNs and IT. To this end, communication between WSNsand IT systems has to be facilitated.In IT systems, the interoperability of basically arbitrary systemsis desired. This motivated the vast adoption of the ServiceOriented Architectures (SOA) paradigm and its implementationin form of the Web Services suite, which facilitatesinteraction on a high abstraction level. For the purposeof interoperability, programming and platform independenttechnologies like e.g. XML and HTTP are used. These technologiesare usually considered to impose high requirementson computing power and memory. For WSNs, the communicationmechanisms are dominated by the resource constraints(energy, computational capabilities, memory) of thenodes, so that typically efficiency is prioritized over interoperability.State of the art solutions overcome this conflict by the use ofso called gateways [6, 9]. The gateways, which are powerfulnodes at the edge of a WSN, map the WSN traffic to ITcompliant communication and thus preserve the freedom touse efficient communication means inside the WSN. However,the introduction of gateways leads to a dependency onan infrastructure for the use of the WSN. This restricts desirablefeatures of WSNs like ad-hoc connectivity as a gatewayneeds to be installed before any interaction with the WSN.Moreover, the gateways themselves need to be maintainedand therefore require additional management effort. Further,errors inside the gateway will make the WSN unaccessible.This turns the gateway into a single point of failure.The next evolutionary step is the support of IT communicationprotocols directly on a sensor node, thus eliminatingthe need for gateways. A first step has already been made inthis direction with the creation of the IETF working groupon IPv6 over lower-power wireless network [2]. Support ofthe IP protocol allows WSNs to homogeneously blend intothe IT landscape, as already shown by state-of-the-art sensorapplications [4]. However, these approaches leave the supportof higher level protocols (above IP) inside the sensornode an open research issue. While IP provides a general75
asis for interaction, it focuses on the delivery of data ratherthan on semantic interaction. In contrast to that, IT middlewaresdefine means to explicitly model and share the servicesprovided by the participants. This allows the easy creationof complex, distributed applications without detailedknowledge about the underlying technologies. Due to thelack of middleware support on sensor nodes, these advantagesare only available for WSNs to a limited extend.In this paper we will present an approach to facilitate middlewaresupport directly on sensor nodes to overcome theseshortcomings. To this end, we investigate the bottlenecksof middleware support using the Universal Plug and Play(UPnP) as an example. Following architectural considerations,we will propose an optimization for protocol stacks onsenor nodes to reduce the consumption of memory. Finally,our results are used to build a prototype implementation ofUPnP for the Sindrion [5] sensor node platform. Measurementsshow that UPnP support is feasible even on restrictedsenor nodes.UNIVERSAL PLUG AND PLAYUniversal Plug and Play (UPnP) is a widely used and commerciallyaccepted middleware that allows devices to be describedand controlled over the network. A peer-to-peer philosophyis inherent to UPnP, so that no central componentis needed to facilitate interaction among the participants ofa UPnP network. As we are interested in the realization ofUPnP on a sensor node, we need to understand the requirementsimposed by UPnP.Functional Features and ProtocolsThe main features incorporated in UPnP [11] are Addressing,Discovery, Description, Control and Eventing. The hierarchicalview of the protocol stack is shown in Fig. 1.Figure 1. Layer Model for UPnP Protocol SuiteFor Addressing, UPnP requires each participant to obtain anIP address via DHCP or Auto-IP. Support for this mechanismis trivial and can be expected to be provided by any IPenabled device. In order to facilitate Discovery, which is thedynamic look up of devices and services in the network, theSimple Service Discovery Protocol (SSDP) is used. SSDPmessages are communicated via UDP unicast (HTTPU) ormulticast (HTTPMU). The relevant information is encodedas plain text in specific HTTP header fields. Thus, SSDPrequires a node to receive and transmit HTTP messages inthe magnitude of 100 bytes as well as to conduct text parsing.Via Description, devices provide a description of theircapabilities to the network. The description is given in XMLformat and transferred via HTTP. A node has to support thetransmission of the descriptions, whose size is in the orderof kilobytes. Control is the mechanism of invoking theso called actions using the Simple Object Access Protocol(SOAP), which relies on XML message exchange via HTTP.A sensor node has to support reception and parsing of theSOAP/XML messages as well as the transmission of the responses.The size of all these messages are in the order ofkilobytes. For Eventing, UPnP employs the General EventNotification Architecture (GENA), which specifies meansfor (un-)subscription of observers and asynchronous eventnotifications. Similar to SSDP, GENA uses specific HTTPheaders to transport the information for (un-)subscriptions.The event notifications consist of an XML message that istransferred via HTTP. To this end, a node needs to supportHTTP message parsing and the transmission of the event notificationswith similar size as SOAP responses.Summing up, in order to make WSNs natively UPnP compliantthe sensor nodes have to support parsing of incomingHTTP headers (for SSPD, GENA) and XML messages (forSOAP). Further, the reception and transmission of messagesin the order of kilobytes has to supported.MIDDLEWARE STACK ARCHITECTURELet us now consider the implementation of the UPnP protocolsuite on a sensor node. As UPnP uses layered protocols,the implementation will naturally follow these layers.In order to support generic statements on the issue of middlewaresupport, we will not investigate the implementation ofall UPnP protocols in particular but rather define a generic,coarse-grained layered stack architecture. We will use thisarchitecture to identify and solve bottlenecks of middlewaresupport on sensor nodes.Layer Definition• Application layer: This is the highest layer of our modeland realizes the application logic. It uses the features ofa middleware to implement its functionalities. For UPnP,the application layer contains the implementation of UPnPdevice and service logic using the features of UPnP, asdescribed earlier.• Middleware layer: The middleware layer provides the middlewarefeatures like Discovery, Control, Eventing, etc. tothe application. To this end, it translates between the semanticsof the middleware protocols and their representationin a message. For UPnP, handling of the protocolsSSDP, SOAP and GENA is located in this layer. Theseprotocols specify how the UPnP semantics for e.g. eventingsubscription are encapsulated in messages, i.e. whichHTTP headers carry relevant information and in whichformat.• Messaging layer: The messaging layer is responsible forthe delivery and reception of complete middleware messages,using the underlying transport protocols. For UPnP,the support of HTTP over TCP and UDP (HTTPU/MU) isprovided in this layer.• Transport layer: The transport layer is responsible for theend to end delivery of packets over the network. To thisend, it covers issues like fragmentation, routing and physicaltransmission. With regards to the UPnP protocol, the76
transport layer supports TCP, UDP and IP. Note that weignore the lower layer communication layers in this studysince we assume them to be given.Information FlowLet us now investigate the information flow through the genericmiddleware stack architecture, depicted in Fig. 2, inorder to understand the implications of the architecture onmemory consumption.Incoming MessageThe transport layer receives and handles incoming packetsand therefore needs at least one buffer to store such a packet.The size of the buffer depends on the physical packet size,which is normally defined in the MAC protocol. For theIEEE 802.15.4 protocol, the maximum packet size is 127bytes. The Sindrion MAC protocol supports 512 bytes perpacket. The messaging layer composes the incoming packetsto a message, which is then provided to the middlewarelayer. As discussed earlier, the message size can be relativelybig (in the case of XML messages) and thus will requirea bigger buffer than for the MAC layer. Further, itis possible to receive multiple messages at a given point intime. Therefore, parallel reception of messages has to beaccounted for. This means that, in a straight-forward layerbasedimplementation, multiple message buffers need to berealized.The middleware layer extracts the middleware relevant informationfrom the messages. The information handled insidethe middleware layer requires less storage size than inthe message layer (discussed in the next Section). Finally,the application layer receives the information from the middlewarelayer and extracts the relevant information.Outgoing MessageThe transmission of an outgoing message is initialized bythe application. To this end, information about the type ofthe message and possible parameters is prepared and passedto the middleware layer. The middleware layer encapsulatesthis information into the middleware compliant format (e.g.HTTP header fields and XML tags). The message layer createsthe complete message as required for transportation overthe network. Similar as above, it is possible that multiplemessages are transferred at the same time, e.g. event notificationare sent to multiple observers in parallel. Thus, abuffer for multiple messages is required. The transport layerhandles the transmission of single packets and therefore requiresa single packet buffer.Memory BottlenecksConsidering the memory requirements discussed above, weconclude that the queuing of incoming and outgoing messagesconsumes a considerable part of the overall memory.If we consider an exemplary UPnP stack, which e.g. shouldbe capable of queuing five incoming and five outgoing messageswith a maximum message size of 1,5 kilobyte, we need15 kilobyte of RAM only to store the messages. This requirementcan hardly be covered by existing sensor nodes,like the Mica2 (4 kB of RAM) or the Tmote Sky (10 kB ofFigure 2. Four Layered Stack ArchitectureRAM) [3]. Therefore, we need a way to minimize the memoryconsumption.OPTIMIZATION CONSIDERATIONSIn the previous section we have inspected an architecture forlayered protocol handling in which the storage of incomingand outgoing messages have been identified as a memorybottleneck. In order to cope with that, we will investigate amore compact storage of information.Messaging LayerThe messaging layer usually requires large buffers to storethe messages communicated over the network. As these messagesserve the purpose to realize middleware features, weleverage middleware knowledge to optimize their storage.The middleware provides side information about messagetypes, message structures, possible parameters, etc. whichallows for a compressed storage of information. To this end,different compression approaches can be folowed. For example,instead of storing the parameters of an UPnP actioninvocation as an XML structure (e.g. 0), they can be stored as a key value pair of parametername and parameter value (e.g. newStatus,0). Additionally,parameter values can be stored considering their data types,thus allowing for a more compact binary encoding insteadof ASCII encoding like used inside a message. This showsthat queuing on the middleware layer is more favorable thanstraight-forward message queuing.In order to leverage this for our stack architecture, we mergethe messaging and the middleware layer (see Fig. 3). Insteadof assembling messages from incoming packets, weextract and store information relevant to the middleware onthe-fly.The same principle is applied to the outgoing communication,for which packets are created directly from thecompressed data. The benefit of this approach is that the relativelylarge message buffers are replaced by smaller bufferscontaining only the compressed information. In order to realizethis, we require a protocol handler that supports messagingand middleware protocols simultaneously. At thesame time, we can also leverage the cross layer idea for protocolhandling, as only the features of the messaging layerneed to be supported that are actually required by the middleware.E.g. , in UPnP the HTTP support can be restricted77
to support POST and GET messages as only these are usedby SSDP, GENA and SOAP. In summary, this means thatby merging the messaging and middleware layer, we minimizethe memory consumption as well as the complexity ofthe stack. This brings us one step closer towards realizingmiddlewares on sensor nodes.For the stack architecture, this means that the extraction andstorage of application information is beneficial for the memoryconsumption. To this end, messaging, middleware andapplication layer are merged and only application specificbuffers are implemented (see Fig. 4). As a result, the protocolhandling inside the stack considers application knowledgeand is therefore optimized per application. However,the manual optimization of protocol handling is a tediousand error prone task. Thus, the automatic generation of astack is recommended. To this end, a generator for UPnPstacks has been developed. It is presented in the next Section.Figure 3. Three Layered Stack ArchitectureMiddleware LayerIn the previous discussion we have used middleware specificside-information to store a message in a more compactform. We now apply the same concept to reach even highercompression as we use application specific side-information.When we optimize the stack for a specific application, onlyinformation relevant for the application needs to be stored.This information is likely to require even less memory. Whilethe middleware compression has to reflect the full featureset of the middleware, the application layer does not. Forexample, in UPnP and also other protocols (DPWS, Webservices) resources are identified using URIs (Universal ResourceIdentifiers) or UUIDs (Universal Unique Indentifers).While these identifiers are suggested to be long in orderto guarantee their global uniqueness, a practical applicationwill only support a limited amount of resources. As a result,URIs and UUIDs can be represented in an application specificway using only a few bits rather then a few dozen ASCIIcharacters. Further, application knowledge can also be usedto store parameters of actions in a more efficient way. Whilethe middleware layer uses information about data types (e.g.’int’) for compression, the application knowledge allows theconsideration of value ranges (e.g. ’0 -9’) which leads tohigher compression.Figure 4. Two Layered Stack ArchitectureTransport LayerUntil now, we have subsequently minimized the memoryconsumption of the stack, leaving buffers only on the applicationlayer and the transport layer. The transport layer containsa buffer for incoming and outgoing messages which hasthe size of a maximum MAC packet. As sensor nodes onlyprovide half duplex communication, a single buffer shouldbe sufficient. In order to realize a single buffer solution wemerge application and transport layer, resulting in the architecturedepicted in Fig. 5. Incoming packets are parsed directlyon arrival in order to free the buffer as soon as possible.For the same reason, outgoing packets are writteninto the buffer only directly before transmission. The resultis that even features like retransmission, used in reliabletransport protocols like TCP, can be supported efficiently. Inour approach, every transmitted packet is stored in memoryin its compressed form. When a retransmission is required,the packet is decompressed into the buffer and transmitted.Therefore a packet only occupies the buffer when absolutelyneeded.Figure 5. One Layered Stack ArchitectureSummaryIn this section we have discussed the optimization of thememory consumption of middleware stacks for sensor nodesin general. Application specific compression of data hasbeen identified as the most efficient means to capture the informationnecessary to represent the global state of the stack.Therefore, aggressive cross layer optimization has been applied,which aims at the direct conversion of a packet intoapplication information (and vice versa). In order to achievethis, an application specific protocol handler, that supportsmultiple protocols at the same time, is required. As a result,a stack has to be created per application and is therefore ideallygenerated.78
In the following we will present an implementation of a UPnPstack that follows these design considerations. As we willsee, our optimization approach results in a significantly reducedmemory footprint. This finally allows the executionof the stack directly on a sensor node, thus underlining thebenefit of our findings.PROTOTYPE IMPLEMENTATION OF EMBEDDED UPNPSTACKAs underlying basis for our investigations, we use the Sindrionprototyping platform [5]. The Sindrion node is composedof a 16 bit controller @ 11 MHz, 128 kB RAM and2 MB ROM. Its RF unit allows communication in the 868MHz band with approximately 50 kbps transmission rate. Aproprietary operating system as well as IP protocol supportare available. A so called network adapter allows access tothe nodes on IP level from a PC, which is the basis for directnode to PC interaction.The UPnP stack is written in plain C and it consists of a smallstatic core which is extended by a set of generated, applicationspecific modules. These modules are created via a Javabased code generator that uses the UPnP device and servicedescriptions as input and creates the C modules and headerfiles as an output. The developer customizes the generatorby specifying, among other parameters, how many connectionsare served in parallel (queue size) and how many eventsubscribers are supported in parallel. The protocol handlinginside the stack is build around a Boyer-Moore type of textsearching algorithm for SOAP and HTTP parsing. The necessarypreprocessing of application specific search strings isconducted by the code generator at compile time. For theoutgoing messages, application specific message templatesare created by the code generator. The templates are compressedusing an ASCII encoded dictionary. This allows thedecompression to be implemented using only little dynamicmemory. When a packet is transmitted, the relevant part ofthe message is decompressed directly into the transmissionbuffer.In order to evaluate the memory consumption, we have generatedvarious stacks which differ in the supported UPnPservices, message queue size and number of eventing subscribers.The presented measurements show the RAM consumptionof the modules of the UPnP stack (not includingthe packet buffer, which imposes a fixed offset of one MTUsize depending on the underlying communication protocol).The values have been directly extracted from the linker MAPfile, thus representing actual and not hypothetical values.Table 1 shows measurements for a simple service, where themessage queue size and the number of eventing subscribersare varied. In a first step, the service consists of a single’GetStatus’ action that delivers a boolean value and does notsupport eventing. In its minimal form, the stack only requires154 bytes. Even when we increase the number ofmessages that are served in parallel to five, the memory consumptiononly increases moderately to 230 bytes. In a secondstep, we have modified the simple service to supporteventing of a boolean value. The ’GetStatus’ action remainsthe same. In its minimal form, the stack, including eventingfunctionalities, consumes 390 bytes. Although the absolutememory consumption is still quite low, we can seean increase of over 100% in comparison to the stack withouteventing. This is partially due to the fact that eventingrequires exchange and storage of a URL and hostname, toidentify an event subscriber. These are lengthy strings andbare no potential for applicaiton specific compression, asthey can be defined freely at runtime by the subscriber. Asa result, the stack requires 1106 bytes in order to implementthe service with five parallel subscribers. In summary, theoverall memory consumption of the stack is still low enoughto fit into current sensor nodes (like Mica, Tmote Sky, Sindrion).However, we also see that eventing is a relativelycostly feature with regard to memory consumption.Scenario A B C D E#Messages 1 5 1 3 5#Subscribers - - 1 3 5RAM in bytes 154 230 390 726 1106Table 1. Measurements for a simple ServiceIn a second step, we analyze the influence of the device andservice complexity on the memory consumption. To thisend, we have generated stacks for the standardized UPnPdevices Binary Light and Dimmable Light, and a standardizedtemperature sensor service out of the HVAC specification.The corresponding measurements shown in Table 2 revealthat the complexity in terms of number of services andactions does not have a dominant influence on the memoryconsumption of the stack. Although the Dimmable Lightdevice provides twice as many services and actions as theBinary Light, the memory consumption is merely the same.The difference of a few bytes originates from using an integerparameter instead of a boolean. Further, the HVACdevice consumes more memory although hosting fewer servicesand actions. The reason for this is that a string basedvariable with arbitrary content needs to be supported to representthe application context of the service. This variablehas a similar effect on the memory consumption as the URLused for eventing.Device TypeBinary DimmableLight LightHVAC#Services 1 2 1#Actions 3 6 3RAM in bytes#Msg. = 1#Subscr. = 1390 394 468#Msg. = 5#Subscr. = 51110 1122 1388Table 2. Measurements for Standardized UPnP Devices/ServicesIn summary, we conclude that we have realized a UPnP stackwith a low enough memory profile to be suitable for sensornodes. Furthermore, we have seen that the UPnP devicecomplexity does not have direct influence on the memoryconsumption. Therefore, an elaborate representation of a79
senor node’s functionalities in a UPnP network is possiblewithout resulting in higher memory requirements. However,parameter types and values should be chosen carefully inorder to allow efficient storage. For example, restricting astring parameter to an enumeration that only consists of afew distinct values instead of defining it as a generic stringresults in smaller memory requirements. In UPnP, this canbe done by defining so called ’allowed value lists’ for theparameters inside the service description.RELATED WORKDifferent approaches to support IT protocols on embeddedsystems can already be found in literature. The most prominentapproach to facilitate Web services on embedded systemsis the gSOAP toolkit [12]. Its unique feature is a bindingbetween C/C++ code and SOAP elements, which allowsimplementation of Web Services on strongly typed C structures.To this end, the code for de-/serialization is created perapplication, using the WSDL description of the web service.As a result, programming of applications is simplified andthe speed of parsing and generating messages is increased.However, the cross layer optimization idea, presented in thispaper, is only partially reflected in gSOAP. Although applicationspecific code is generated, it only accounts for the datatype translation between C and SOAP. The core functionalitiesare wrapped inside a static module, which does not useapplication information for optimization. Further, gSOAPstores the complete incoming and outgoing messages in abuffer, which we have seen as a burden for the memory consumption.Intel [1] provides a toolkit for the development ofUPnP applications. Code generation is used to create an applicationspecific UPnP stack as well as skeleton methods, inwhich a developer can add the application logic. We witnessa stronger employment of the cross layer optimization here,as even code for message parsing is specifically generatedfor the application. However, information about the applicationis not used to reduce the memory consumption. Similarto gSOAP, outgoing messages are generated via genericfunctions which create the complete message inside a buffer.In summary, we see that the generation of application specificstacks is a common technique. The discussed toolkitshowever do not leverage the available information to the fullextend to optimize the memory consumption.CONCLUSIONIn this paper we have discussed the challenges of IT middlewaresupport on sensor nodes. We have seen that middlewaresupport requires the handling of multiple, large messagesin parallel, which easily requires more dynamic memorythan available on a sensor node. To this end, the reductionof memory consumption of the middleware stacks is acrucial issue. Analyzing the layer model of a generic middlewarestack, we have seen that higher layers tend to havemore side information about messages and therefore allowfor a more compact representation of the message content.In order to leverage this, we have proposed an architecture inwhich messages are not stored in their on-wire format but ina compressed, application specific form. In order to achievethe highest compression, the stack implements applicationspecific protocol handling. This calls for code generationtechniques to create application specific middleware stacks.Finally, a prototype implementation proved that support ofUPnP on sensor nodes is actually possible, which is a findingthat exceeds the state-of-the-art. In its minimal form,the stack requires 154 bytes of dynamic memory, which issuitable for even highly restricted nodes.REFERENCES1. Intel Software for UPnP Technology.http://www.intel.com/software/upnp/, 2007.2. Ipv6 over low power wpan (6lowpan). Technical report,The Internet Engineering Task Force, 2008.3. J. Beutel. Metrics for sensor network platforms. InProc. ACM Workshop on Real-World Wireless SensorNetworks (REALWSN 06), pages 26–30. ACM Press,New York, June 2006.4. European 6th Framework Project. PROMISE - ProductLifecycle Management and Information Tracking usingSmart Embedded Systems. http://www.promise.no/,2005-2008.5. Y. Gsottberger, X. Shi, G. Stromberg, T. F. Sturm, andW. Weber. Embedding Low-Cost Wireless Sensors intoUniversal Plug and Play Environments. In EWSN,January 2004.6. M. Isomura, T. Riedel, C. Decker, M. Beigl, andH. Horiuchi. Sharing sensor networks. In ICDCSW ’06:Proceedings of the 26th IEEE InternationalConference<strong>Workshops</strong> on Distributed ComputingSystems, page 61, Washington, DC, USA.7. P. Levis and D. Culler. Mate: A tiny virtual machine forsensor networks. In International Conference onArchitectural Support for Programming Languages andOperating Systems, 2002.8. S. R. Madden, M. J. Franklin, J. M. Hellerstein, andW. Hong. Tinydb: an acquisitional query processingsystem for sensor networks. ACM Trans. DatabaseSyst., 30(1):122–173, 2005.9. M. Marin-Perianu. Decentralized enterprise systems: amultiplatform wireless sensor network approach. IEEEWireless Communications Magazine, 14(6):57–66,2007.10. T. Riedel, C. Decker, P. Scholl, A. Krohn, andM. Beigl. Architecture for collaborative business items.In ARCS, volume 4415 of Lecture Notes in ComputerScience, pages 142–156. Springer, 2007.11. UPnP Forum. Universal Plug and Play DeviceArchitecture 1.0. http://www.upnp.org, June 2000.12. R. van Engelen and K. Gallivan. The gsoap toolkit forweb services and peer-to-peer computing networks,2002.80
Using the Connected Home Platform to support user tasksas orchestrations of smart objects servicesApostolos MelionesInAccess NetworksAthens, Greecemeliones@inaccessnetworks.comAchilles KameasHellenic Open University & ComputerTechnology InstitutePatras, Greecekameas@{eap, cti}.grDimitrios EconomouInAccess NetworksAthens, Greecedecon@inaccessnetworks.comABSTRACTThe ATRACO project uses the ambient ecology metaphorto conceptualize a space populated by connected smartobjects and services that are interrelated with each other,the environment and the people. User activities aresupported by the implementation of ubiquitous computingapplications deployed over this ambient intelligence space.In this paper we present a possible realization of theATRACO vision using the Connected Home Platform, acommercially available system adopted and evolved byATRACO in order to provide network adaptation andcontext-aware services. A flexible and distributed contextawareservice model is introduced using the OSGi andUPnP frameworks. UPnP is used to unify the existingnetwork infrastructure comprising of heterogeneoustechnologies and protocols at the IP level. Furthermore, weintroduce a context-aware service model and provide anexample of orchestrating context aware services with thesupport of the platform.Author keywordsUbiquitous computing, smart objects, service orientedarchitectureINTRODUCTIONContext-aware systems are an emerging genre of computersystems that help add some forms of intelligence to oursurroundings. It is well-established that context-aware(sentient) systems should address three basic requirements,i.e. sensing, inference and actuation [3]. In the ATRACOproject [2] we use the Ambient Ecology metaphor toCopyright is held by the authors.<strong>UbiComp</strong> '08 Workshop September 21st, 2008Christos GoumopoulosComputer Technology InstitutePatras, Greecegoumop@cti.grconceptualize a space (Ambient Intelligence – AmI –space) populated by appliances, devices, and context awareartefacts and services that are interrelated with each otherand the environment [5]. Adding context awareness toartefacts can increase their usability and enable new userinteraction and experiences.Ubiquitous context-aware computing has been around forseveral years. Several projects have produced a host ofdifferent applications. Research in these projects is mainlydriven by scenarios of AmI introduction into people’sactivities, which can be classified into six main activitydomains: home, office, health, shopping, learning andmobility. Research issues can be clustered in thoseconcerning computing, communications, interfaces,embedded intelligence, sensors and actuators [7].In the context of Disappearing Computer initiative [4], theconcepts of smart tags and smart objects were developed;these were used to compose distributed ubiquitouscomputing systems. The research that was initiated withDisappearing Computer, and other related initiatives(Presence, Global Computing) continued into FP6 in thecontext of several IPs. Among these, the Amigo project [1]focused on the usability of a networked home system bydeveloping open, standardized, interoperable middleware,which will guarantee automatic dynamic configuration ofthe devices and services within this home system thussupporting interoperable intelligent user services andapplication prototypes. Along the same lines, TEAHA (TheEuropean Application Home Alliance) is proposing amethod of secure service usage and discovery using acommon proposed interface and set of methods that ensurethe ease of use, privacy and interaction between clustersthat implement different communication protocols [8].In this paper we present the application of the ConnectedHome Platform (CHP) in supporting the realization ofambient ecologies. CHP uses a flexible and distributedcontext-aware service model based on the OSGi and UPnPframeworks. Furthermore, we introduce the context-aware81
service model and provide paradigms of context awareservices that build upon perceptual and context awarecomponents of the platform.ACTIVITY SPHERESNowadays, people achieve their goals by decomposingthem into tasks (that is, by forming plans) and them byrealizing these tasks with the help of objects or services intheir surroundings. Goal achievement depends on theavailability of the appropriate objects or services(henceforth called resources); people adapt their plansaccording to the available resources or the specialcharacteristics of the environment. Thus there is a tightcoupling between plans and resources that determines thedegree of goal achievement.One of the research goals of the ATRACO project is todecouple plans from resources. The basic concept we use isthe “Ambient Intelligence sphere” or “activity sphere”. Anactivity sphere is intentionally created in order to supportthe realization of a person’s specific goal, which isdescribed as a set of interrelated abstract tasks. This plan isabstract and contains only descriptions of the resources itrequires; thus, it is independent from any particularconfiguration. The sphere is deployed over a particularAmI space and uses its resources to help its owner realizethe tasks that lead to the achievement of the goal.The ATRACO system supports this context-basedtransition from abstract to concrete. For each sphere, anATRACO system is realized by the respective ControlAgent, which can run on a PDA or a home server andcontains the user goals and associated plans. Based onthese, it discovers the available resources which could beused for task realization. When such resources arediscovered, abstract tasks become concrete and each isassigned to a Task Agent; the realization of each concretetask can be thought of as a ubiquitous computingapplication. Thus, the AmI space becomes the platform onwhich ubiquitous computing applications that are part of anATRACO sphere are realized.The explicit configuration of a sphere requires thediscovery of the resources in the ecology and theirorchestration based on virtualized descriptions of theirproperties, capabilities and services. One could assume thatthese descriptions are made available through standardizedprotocols (i.e. as UPnP headers) or not (i.e. usingproprietary meta-data).In the former case, the approach adopted in ATRACO is touse the services of the Connected Home Platform, whichprovides the Control Agent and the Task Agents withdescriptions of resources and protocols. In the latter case,we first construct a local ontology for each resource andthen we apply ontology alignment in order to merge localontologies into a global sphere ontology which contains alldata and knowledge necessary to realize an activity sphere[6]. In the rest of the paper, we shall focus on the formercase.CONNECTED HOME PLATFORMThe Connected Home Platform (CHP) is a commerciallyavailable platform that offers a complete set of smart homeservices running on top of existing broadband servicebundles, thus implementing a connected homeenvironment. It is based on the flexible MRG-110-6 HomeController (referred also as Domotic Controller) ofinAccess Networks, which can be easily integrated intowireless or wired LAN and provides access over LonWorksand KNX/EIB control nodes.The main platform module is the home gateway, whichcoordinates all the individual smart objects and providesadd-on functionality. Figure 1 depicts the home gatewaysoftware architecture. We assume that smart objects can befound in the AmI space, which offer a variety of services.The communication between the artifacts and the homegateway is based on the Lonworks and wireless Z-Waveand Zigbee protocols. Moreover, a Service Node is hostedat the operator premises. It is responsible for serviceprovision and management, as well as for providing secureremote access to the home. The service node contains allnecessary elements for service lifecycle management,introduction of new services, remote monitoring, watchdogtimers, handling of user subscriptions per service package,ratter & charger, plus the ability to render the graphical oraudio content depending on the user terminal capabilitiesfor home remote access.UI AdaptationLayerLONbundleHome Control APIEIBbundleAutomationServicesOSGiJAVA VMZwavebundleLinux Kernel with NPTLUSB Serial LON EIBSTDOSGiServicesETHEIButilsEIBlibSysprocsSyslibsOther driversFigure 1. Home controller software architectureCONTEXT AWARE SERVICE MODELThe CHP endorses the development, deployment andmanagement of advanced, human-centric, context-awareservices. Applications can exploit the context-awareservices, the advanced user interfaces, and thevirtualization of the home network infrastructure, throughhigh-level mechanisms offered by the platform. CHPadopts OSGi as the defacto standard framework for the82
creation, composition and deployment of services. TheCHP provides a registry for the services and anorchestration engine taking care of the service interaction.CHP further adopts UPnP as the control and managementplane to deliver its services. The CHP enables a flexiblemodel for home application/service development anddeployment, which distinguishes between the followingroles:AmI space infrastructure: The infrastructure consists of thefull range of smart objects (including sensors, devices,actuators, residential gateways, computing and networkequipment) used to provide sensing, networking and basicservices in the home environment. All these UPnPcompatible components, during bootstrapping, will sendpresence announcements advertising their supportedservices. On the other hand, every device or service willlisten for discovery requests. Upon reception of a searchrequest, the device will examine the search criteria and willrespond if a match occurs. Each smart object or serviceprovides, according to UPnP specification, informationregarding service resources and how to use them.Perceptual Components: The perceptual componentsprocess sensorial input based on the range of sensorsinstalled. By using the UPnP model, each perceptualcomponent will discover easily network resources, such assensors, actuators, cameras, microphones, speakers etc.With the use of a control point entity a perceptualcomponent can be fed with appropriate type of information.The perceptual components will provide servicesresponsible for dispatching events to registered controlpoints. These services will also accept actions forconfiguration and initiation of raw information processing.Context Model: Having UPnP descriptions of perceptualcomponents and infrastructure elements at hand, it ispossible to calculate context states. Based on the plan, thesestates can be combined towards identifying higher levelcontextual states (i.e. extracting more sophisticatedcontext).Activity spheres: Activity spheres are considered asapplications that use plans and context models to realizetheir tasks. In the current implementation, the applicationlogic will be specified in terms of service actions to beexecuted over a UPnP object. UPnP objects exist in alllevels of the functional chain and range from simplesensors to complicated software modules. The applicationswill have access: (i) At the infrastructure level, to control,tune or configure sensors, actuators, devices etc. (e.g.towards regulating the environment, or adapting a device tocontext). (ii) At the perceptual component level, toconfigure the perceptual component for optimalperformance or to control it (e.g. start/stop it) through theapplication. (iii) At the context modeling level todynamically adapt (e.g. augment or restrict) the contextmodel. (iv) At the application level, to leverage any othercomputing service that might be available within the UPnPnetwork (e.g. invocation of a software component orapplication).UPNP VIRTUALIZATION OF HOME NETWORKINFRASTRUCTURECHP provides resource virtualization functionality, whichadheres to the UPnP paradigm, for all the devices andnetworking technologies in the domestic environment.Home applications/services, and components for contextawareness and advanced user interfaces regard resourcevirtualization components as a set of UPnP services, whichcan interact by invoking actions and receiving events.UPnP virtualizes all network resources from variousheterogeneous networks into a common communicationmeta-medium. UPnP being agnostic for the origin (Zwave,Zigbee, Lonworks, IP, etc.), implementation (C, C++, Java,Python) and nature (software, hardware) of resources,unifies them as peer objects in the same abstraction layer.The CHP will manage a complete, pervasive, unobtrusiveand networked infrastructure. Figure 2 presents in generalterms the infrastructure. There are various types of devicesinterconnected, using different wired or wireless networktechnologies:Home network infrastructure. The CHP assumes that amodern home can have many devices that can benetworked and controlled remotely. Devices can becomputing, intelligent appliances (white/brown goods,cameras, microphones), sensors and actuators. Thenetworking technologies may be wireline, relying onEthernet, Firewire, Lonworks, KNX/EIB, or wireless,relying on WiFi, Bluetooth and ZigBee. Inside the homedevices can communicate in ad-hoc mode. Such an optionis imposed by the capabilities of many small devices, likewireless sensors.UPnP proxies to non IP networks. The CHP will deliverhigh level context-aware services making use of a widerange of devices and appliances. These devices willeventually belong to heterogeneous networks and for thatreason their virtualization as UPnP devices in the IPnetwork is required. Special devices called UPnP proxiesundertake this responsibility. UPnP proxies bridge IPnetworks with non IP networks representing at the sametime devices belonging to non IP networks as UPnPentities. A UPnP proxy can interface more than one non IPnetworks.Service gateway. The interconnection of the home networkwith the Internet is usually offered through a residentialgateway (referred also as Home Controller), which is alsomanageable through UPnP regarding various networkservices like firewalling, routing, NAT, DNS and DHCP.The service gateway from its nature is provider-neutral andis empowered with OSGi. This enables the dynamicinstallation, update or removal of the software components(OSGi bundles), which finally will compose complex orsimple services.83
Virtualization of resources will facilitate infrastructureexploitation from context-aware components, advanceduser interaction mechanisms and homeapplications/services. The platform will use UPnPmechanisms for the acquisition of signals from the networkinfrastructure (e.g. cameras, microphones). These signalswill be the basis for the creation of (simple and advanced)contextual information that will trigger the homeapplications and services. Additionally, the CHPfunctionality will enable the home applications/services,perceptual and context-aware components to invokeactions, upon the underlying home network infrastructure.The rationale for resource virtualization is that theabstraction and integration under a common umbrella(management/control interface) will provide to homeapplication/service developers a platform that hides thedetails and the complexity of the underlying home networkinfrastructure.Even when a smart object is connected to a non IP network,the system must make it available in the pool of availableresources. Since it cannot join the IP network and advertisethemselves as UPnP devices, the UPnP proxy undertakesthe responsibility to do it on their behalf. A UPnP proxyperforms all the necessary steps so as to ensure IPconnectivity for all devices behind it. Acting as an interworkingunit between a non IP network and an IP one, theproxy starts a new IP session where the device is advertisedas a UPnP device sending a multicast announcement. Theproxy holds deferent profiles for each type of device itrepresents. For each new device type, the proxy updates itsprofile repository. The UPnP proxy is the key element ofthe infrastructure resource virtualization. Each devicebehind a proxy has the same IP address but a differentUPnP address (a UPnP address is a URL pointing to deviceassociated information). That way the proxy is able toaccept remote procedure calls for many devices.Figure 2. General structure of the home network infrastructureThe services, the context events and the actions that can besupported by a device are made known through thevirtualization function performed by the UPnP proxies.Through the virtualization function, the user applications,the perceptual and the context-aware components canmanage and use the infrastructure. Resource virtualizationcan be thought of as an abstraction of some defined devicefunctionality and its public exposure as a service through theCHP platform.EXAMPLE APPLICATION SCENARIOConsider the following scenario:84
Suki’s living room has embedded in the walls and ceiling anumber of sensors reading inside temperature andbrightness. He uses an air-conditioning as the main heating /cooling device. The windows are equipped with automatedblinds, which can be turned in order to dim or brighten theroom. For the same purpose, Suki can use the two lampshanging from the ceiling. Suki’s goal is to feel comfortablein his living room.The Control Agent that manages the house contains anabstract plan, which states that, in order to achieve this goal,temperature and brightness have to be adjusted to acomfortable level. These tasks are “assigned” to two TaskAgents. These retrieve abstract descriptions of the two tasksinvolved in this plan from the local database. Then itaccesses the protocol independent Connected HomePlatform installed in the house in order to discover theresources available in the living room and make the taskdescription concrete (i.e. set air-conditioning temperature to22 degrees C). With the help of CHP, each of these agentscan access all devices in the house that relate to oneconcrete task.A touch screen with voice recognition ability that ismounted near the room entrance is used as the main controlpoint. Suki can use the mike in the screen to give voicecommands to his home. All interaction between Suki andhis home is managed by the interaction agent. This agentcan receive Suki’s commands and interpret them with thehelp of CHP. Then, this agent interacts with the variousdevices in order to provide output to Suki using theiractuators.Parts of this ambitious scenario will be realized in thecontext of ATRACO project. For example, Figure 3 showshow control of heating and lighting conditions can beachieved with the help of CHP in order to realize Suki’s“feeling comfortable” sphere. The service can be triggeredby two sources. The first is related to the identification of auser. This identification is done by components that offercontext awareness. Alternatively, the second trigger is acommand issued by a user. In the figure this is representedby the voice interaction agent. Having identified the user,and having at hand additional contextual information, thehome application/service can decide on appropriatecommands towards the networking infrastructure. In theexample, there will be commands towards the lighting andthe heating agents, in the context of a power and climatecontrol services.CONCLUSIONSThe ATRACO project uses the ambient ecology metaphorto conceptualize a space populated by connected smartobjects and services that are interrelated with each other, theenvironment and the people, supporting the users’ everydayactivities in a meaningful way. Everyday appliances,devices, and context aware artefacts are part of ambientecologies. A context-aware artefact uses sensors to perceivethe context of humans or other artefacts and sensiblyrespond to it. Adding context awareness to artefacts canincrease their usability and enable new user interaction andexperiences. Given this fundamental capability singleartefacts have the opportunity to participate in artefact-basedservice orchestration ranging from simple co-operation todeveloping smart behavior. Smart behaviour, then, either inindividual or collective levels, is possible because of theartefacts’ abilities to perceive and interpret theirenvironment.In this paper, we presented one of possible implementationsof ATRACO activity spheres, which uses the ConnectedHome Platform. The CHP enables network adaptation andsupports context awareness for artefacts that participate inthe ambient ecologies using a flexible and distributedservice model based on the OSGi and UPnP frameworks.UPnP virtualizes the home network environment into acommon communication meta-medium.Nevertheless, the vision of ATRACO is to enable thebottom-up composition of services and capabilities of smartobjects, in order to support user task realization in unknownAmI spaces. To achieve this, a semantically rich layer willbe developed on top of the CHP, which will containontologies and agents. The former will describeheterogeneous services and the latter will use CHPresources to adapt the implementation of user tasks.ACKNOWLEDGEMENTThe described work has been partially supported by EU FP7ICT-1-8.2 STREP project ATRACO (Adaptive TrustedAmbient Ecologies), under Grant agreement No. 216837.ATRACO is part of the FET PERvasive ADAptationinitiative.REFERENCES1. Amigo project.http://www.hitech-projects.com/euprojects/amigo/2. ATRACO project.www.atraco.org3. Biegel, G., Cahill, V.: A framework for developingmobile, context-aware applications. In Proc. Percom20044. Disappearing Computer initiative.www.disappearing-computer.net5. Goumopoulos, C. and Kameas, A., Ambient ecologies insmart homes”. The Computer Journal, to be published.6. Seremeti, L. and Kameas, A., Ontology-based high-leveltask composition in ubiquitous computing applications”.In Proc. IE087. SWAMI project report: The brave new world of ambientintelligence. Deliverable D1. http://swami.jrc.es8. TEAHA project.www.teaha.org85
Figure 3. Heating and lighting control using CHP services86
SOEML: A Smart Object Event Markup Language usingTemporal IntervalsTakuro YonezawaJin NakazawaHiroshi SakakibaraGraduate School of Mediaand GovernanceKeio University, Tokyo,Japan{takuro, jin,skk}@ht.sfc.keio.ac.jpGoro KunitoTomohiro NagataResearch LaboratoriesNTT DoCoMo, Inc,Kanagawa, Japangoro@ieee.org,nagatat@nttdocomo.co.jpHideyuki TokudaFaculty of Environment andInformation StudiesKeio University, Tokyo,Japanhxt@ht.sfc.keio.ac.jpABSTRACTThis paper proposes a smart object event markup language.By attaching sensor nodes to everyday objects, users canaugment the objects digitally and apply the objects into variousservices. When creating such smart object services,users should define events, such as bevarage of a cup turnscold or someone sits down on a chair, using physical valuesfrom sensors. The most common event definition forend-users is simply describing threshold of sensor values andboolean operation. When they want to define more complexevents, such as multiple people sit down on chairs or a userstarts to study using a pen and notebook, they need to use aprogramming language. To define such complex event easilywithout complex programming language, we present a newevent description language called SOEML based on temporalintervals among simple events. We also provide users avisual interface to support users defining events intuitively.Author KeywordsEvent Definition, Toolkit, Smart Object, DeploymentINTRODUCTIONTo realize ubiquitous computing environment, technologiessuch as computer, sensor, and network has been improving.Especially, small sensor nodes equipped with various typesof sensors such as thermometer, accelerator, or illuminometerhave enormous potential to create context-aware servicesthat assist a variety of human activities. Our life is filledwith everyday objects, and we often have trouble with them(e.g. lost property ). It is important to achieve the ubiquitouscomputing environment to apply everyday objects intoubiquitous services. Sensor nodes, when attached to everydayobjects, enable us to gather real-world information ascontext. Recently, many researchers have been focusing onthe ubiquitous services with these ”smart objects” [5, 11].With smart objects, users will be able to enjoy the privilegeof ubiquitous technology anytime anywhere in their lives.Copyright is held by the author/owner(s).<strong>UbiComp</strong>’08 Workshop 4: Design and Integration Principles for Smart Objects(DIPSO 2008), September 21, 2008, Seoul, Korea.This position paper is not an official publication of <strong>UbiComp</strong> ’08To realize the smart object services in the home environment,the following two questions must be answered. Thefirst is how to make our belongings smart. We already havea number of everyday objects. Therefore, providing an easyway to make them smart is important. We have addressedthis with uAssociator [13], an easy assoication method betweensensor nodes and objects. The second question, thatthis paper focuses on, is how to create smart object serviceswhich reflect users’ requirements. It is not practical to buildall the services that users may want to use. Therefore anenvironment for users to create services themselves is necessary.The most common smart object applications are describednaturally as a collection of rule-based conditions. MediaCup[5] is a common example: ”when a MediaCup recognizesthat the beverage in the cup is getting cold, MediaCupnotifies a user to drink it quickly.” To create such services,users must define an event by using physical sensorvalues and an action such as sending an e-mail or beepinga sound. Because these definitions are unfamiliar tasks forusers, there has been an increasing effort and interest in developinginfrastructures or toolkits which enables users tocreate context-aware application by themselves. From thepoint of view of context definition, these tools can be classifiedby the following two: low-level toolkits [3, 6] andhigh-level toolkits [7]. While low-level toolkits provide theneeded support for acquiring context, a large amount of codesmust still be written to develop simple sensor-rich applications.On the contrary, while high-level toolkits enables endusersto create simple context-aware applications for theirinstrumented environment, it is impossible to define morecomplex or flexible context. This is because only settingthresholds of sensor values or using boolean operation isnot a sufficient way for defining complex events. For example,”bevarage turned cold” cannot be defined simply as ”ifthe cup’s temperature 40 degrees and then
sat down at the same time” can be useful for recognizinga ”meeting” context. In this case, the event can be definedsuch as ”if more than 3 chairs detect a person’s weight atleast once in 30 sec.” This type of event is so complex thatusers need to write highly complex program.Our purpose is to create a mid-level toolkit which enablesusers who have basic information skills to create both simpleand complex smart object services. To realize the purpose,this paper focuses on a way to define events whichare trigger of smart object services. As shown above examples,it is important to make consideration of temporalrelation between simple events for defining more complexevents. However, it is difficult task for users to define complexevents which concerns temporal concept. For solvingthis problem, we presents a smart object event markup languagecalled SOEML. SOEML is an XML-format language,and it enables users to define events by using interval-basedtemporal operation. Allen argues that all events have durationand considers intervals to be the basic time concept [2].We extended the interval-based temporal operation to definesmart objects events flexibly. SOEML has following threefeatures; 1) it enables users to define complex event by combiningsimple events considering temporal relationship, 2) itenhances reusability of events by separating logic of eventsand target smart objects, and 3) it supports defining flexibleevents which are composed of multiple smart objects as ”ifmore than 3 chairs detect a person’s weight at least once in30 sec”.The rest of this paper is organized as follows. In next Section,we present details of SOEML and its implementation.In Section 3, we discuss features of SOEML. Then, we surveyon related work in Section 4. Finally, we conclude thepaper describing foresight in Section 5.SOEML: SMART OBJECT EVENT MARKUP LANGUAGEIn this Section, we present details of a smart object eventdescription method using temporal relation, called SOEML.With SOEML, users can define both simple event and complexevent easily.StructureSOEML is composed of 5 main elements: ,, , and. Figure 1 shows an overview of these 5 elements.Details of each element is shown below in order.’()*",)$ -./")’()*"!"#$%&’$()*"(+!",&-’(%"./)0&!"#$ %&’()*"+,)$ -./")1!2(3 45"(%"6 (3 7(’42&85$ /2"+678)&"!"#$ %&"’()*"+,)$ -./")!"#$ %&+’()*"’()*"+,)$ -./")1!2(3 45"(%"6 (3 7(’42&8’()*"+,)$ -./")1!2(3 45"(%"6 (3 7(’42&89:,%$ )+012/"%#*’()*"1!2(3 45"(%"6 (3 7(’42&8’()*"1!2(3 45"(%"6 (3 7(’42&89:,%$ )+012/"%#*3#$ -#4%")Figure 1. Overview of elements in SOEML3#$ -#4%")+’()*"+,)$ -./")3#$ -#4%")"’()*"uParttemperature30Figure 2. An Example of Atomic Event TemplateEvent Template and Temporal RelationEvent Template is a basic event model in SOEML. Smart objectevents can be detected by adapting the Event Templateto target smart objects. There are two types of the EventTemplate: Atomic and Composite.• Atomic Event TemplateAtomic Event Template is used for defining primitive events,using a threshold of a sensor value. Figure 2 illustrates anexmaple of Atomic Event Template which defines ”temperatureis less than 30 degrees.” For describing both Atomicand Composite Event Template, elementis used. The ”type” in is used for specifyingwhether the event template is Atomic or Composite.In element , users describeconcrete sensor information. An element contains 3 elements: , and . is used for specifying sensor node types such as uPart [4] orMote. specifies which sensor on the node shouldbe monitored. In case of using uPart sensor node, there are 3types of sensors; temperature, movement and illuminance. is used for setting a certain threshold of sensorvalues. An attribute ”exp” in governs types ofthresholds. We prepared the following 7 types of thresholds;greater, greater-equal, equal, less, less-equal, between andexcept.• Composite Event TemplateComposite Event Template is a complex event which is definedby the correction of two event templates. For combiningmultiple event templates, we use temporal interval logic(see Figure3). In reference [2], a set of 13 relations betweenintervals are defined, and rules governing the composition ofsuch relations controls temporal reasoning. Additionally, wedefined a new relation ”any” to the set to improve SOEML’sflexibility. We present detail of ”any” relation later in thisSection.Figure 4 shows an example of the Composite Event Template.This template relates two Atomic Event Templates by”meets” relation. Element , which hastwo or more elements, is used for definingtemporal relationship between event templates. It has a”type” attribute which defines a temporal relation from 14types of relation shown in Figure 3. In this case, ”type”is set to ”meets” relation. Atomic Event Template ”Some-88
"#$%&’("#$%&’!!"#$%&’()*$+","-’."+ ""%/’0".#$1/"(2"2),34’(%$&(//%$.%/"56$#//%$.%"2),326.&(7"(2/’0".#$11"2),3+"%),3$-%".$(3;/
10!; !< !=!"#$%&’"()%* +$(%,-’# $)+"(./ ’),%"0%12$3%%!"#$%&’"()%* +$(%,-’# $)+"(.4 ’53,%%"0%12$3!"#$%&’"()%* +$(%,-’# $)+"(.!:2(04 ’53,%%"0%12$3!"#$%6()$2785%’9%,-’# $)+"(./ ’),!"#$%"()$2785%’9%,-’# $)+"(.4 ’53,!"#$%"()$2785%’9%,-’# $)+"(.!:2(04 ’53,!"#$Figure 8. An Example of Composite Eventsmart object. On the contrary, Composite Event is used fordefining events which involves multiple smart objects. Figure8 is a Composite Event which defines ”If both a pen anda notebook are moved at least once within certain 10 second.”A Composite Event named ”Studying” has a nestedconstruction. First, it relates a Composite Event named”PenAndNotebookMoved” and time duration ”10 seconds”with a ”during” relation. This means that when the event”PenAndNotebookMoved” occurs within 10 seconds, the event”Studying” fires. The event ”PenAndNotebookMoved” isalso a Composite Event: it relates the event ”PenMoved”and ”NotebookMoved” by a relation ”any”. The relation”any” is a special temporal relation that fires an event whenall inner events fires in any relation. Moreover, when ”any”is used, additional attributes ”firedCondition” and ”fired-Number” can be set to the element fordefining flexible conditions. For example, the code means that when one or more inner eventsfire, the condition is fullfilled. There are 5 types of ”fired-Condition” - more, more-qeual, equal, less-equal and less.By using ”firedCondition” and ”firedNumber”, logical additionor exclusive disjunction can be defined.ImplementationIn this Section, we describe the implementation of the SOEMLsystem. First, we will present the event detection mechanism.Then, we will show the user interface for creatingthe SOEML. We implemented these system with Java andJAXB [1] for XML parser. For defining schema for SOEML,we used XML Schema.Event detectionWe assume that the users will use smart object services inthe home environment where there is one or more computerswhich operates applications, coorperating with sensor nodesmounted on objects. Events which can be detected are highlyinfluenced by temporal intervals which sensor nodes sendpackets to a computer. If the intervals of the packets beingsent are different, it is impossible to evaluate whether thecomposite event occured or not. Therefore, we use sensornodes which send a packet at an equal interval (500 milliseconds).The current detection mechanism for temporalevaluation is based on an event-driven algorithm. When anFigure 9. Time chart of Event Template ”SomethingTurnsCold”event constructing a Composite Event is recognized, a temporalevaluation is executed in every interval (500 milliseconds).Each event stores both the start time and the end time,and the system computes every past events or time durationwhich users have defined. Note that the start time and theend time of Composite Event or Atomic Event which containComposite Event Templates are dependent to inner eventswhich construct the Composite Event/Event Template. Figure9 shows the time chart of the Composite Event Template”SomethingTurnsCold” shown in Section 2. The EventTemplate ”SomethingHot” started from T1 until T2, while”SomethingCold” started from T2 until T3. This temporalorder matches ”meets” relation, and so the CompositeEventTemplate ”SomethingTurnsCold” fires. In this case,while the Atomic Event Template ”SomethingHot” and ”SomethingCold”fires every time when the sensor data matchesthe event, ”SomethingTurnsCold” fires at T2 when ”SomethingHot”and ”SomethingCold” matches ”meets” relation.If ”SomethingTurnsCold” is a part of upper Composite EventTemplate, ”SomethingTurnsCold” is treated as an event whichhas time interval from T1 to T2.User InterfaceWe also implemented a prototype of user interface for describingSOEML. By using the interface, users can load SOEML,visualize its structure and save as XML code. The interfaceprovides a structure of the elements visually with animation(see Figure 10). Users only need to define thresholdsor select applicable elements from comboBox for definingSOEML. This enables users to configure SOEML intuitivelly.For deciding thresholds, users can refer concrete sensordata illustrated in chart. The interface also supports associatingsensor nodes and objects by uAssociator [13]. Thismeans the interface supports users to install smart objectsand define its event.DISCUSSIONWe discuss features of SOEML in terms of descriptive capabilityand reusability.Descriptive CapabilitySOEML enables users to define complex events by correlatingsimple events which is based on thresholds of sensornodes. Because the correlation of events can be definedby 14 temporal interval logics including Allen’s 13 relations90
30Figure 11. Composite Event of ”InMeeting”Figure 10. User interface for editing SOEMLand the ”any” relation that we propose, users can create varioussmart object events without using complex programminglanguage. Let us get back to the example ”if more than 3chairs detect a person’s weight at least once in 30 sec” inSection 1. Though this event is difficult to define with programminglanguage, users can model the events by SOEMLsimply as Figure 11. Figure 12 shows a visualized imageof SOEML which defines a Composite Event ”Meeting”.The event ”Meeting” correlates ”MoreThan3ChairsUsed”event and time duration ”30 seconds” by a ”during” relation.”MoreThan3ChairsUsed” event is also a CompositeEvent which uses the temporal relation ”any”. In this case,”firedCondition” and ”firedNumber” is set for defining thecondition of ”more than 3 chairs being used.” With ”any”relation, users can define flexible events. However, there arelimitations in SOEML compared by programming language.For example, it is impossible to define events which requiresan average of sensor values. Alternatively, it is burden taskto define composite events which includes repetition of anevent. As future work, we will focus to improve flexibilityof SOEML for defining these events.ReusabilityIn SOEML, an event is expressed as a pair of Event Templateand Smart Object. In other words, when users wantto adapt the same event recognition logic to an object, theonly thing users need to do is to change the Smart Objectpaired to the Event Template. This feature boosts up thereusability of SOEML. Additionally, all events are based onsimple threasholds of sensor values. This reduces difficultyfor users to modify SOEML defined by other people. We basicallydo not assume that the users can use the same eventthat they have modelled in a different environment. This isbecause the sensor values that the object detects differs whenthe environment of user changes. Therefore, the feature thata user can use or easily change an event which another personhas made is very important.- ’2 6’*./%#78%(/#19(: %%/.(;1!"# $%&’()*"(’+,%-./0&,-1- ’2 6’*./%#78%(/#1: ’,%(5- =>.,*? *%)1!"# $%&’()*"(’+,%-.234)+,%)- ’()./.’(012 ’,%1#+,%)(32 4%,0151?*%)?*%)?*%)!"#$%&’()*?*%)?*%)Figure 12. Visualized SOEML ”InMeeting”RELATED WORKDey et. el. interviewed 20 people without programmingskills about favorable application for ubiquitous computingenvironment [7] . As a result, 80% out of 371 proposed applicationscan be described with if-then rules. This indicatesthe efficiency of the if-then rule as an end user programmingin the ubiqitous computing environment. Following theseresults, Dey et.el. has built a visual programming environmentwhich enables users to write the if-then rule. However,the definable rules are limited to events possesing a simpleoperation such as boolean logic. Similarly, there have beenmany approaches to define services using the ECA(Event-Condition-Action) rule. Shankar et. el. quoted that the ECArule could not assign conditions before and after firing whichwas a fault for ECA [10]. Shankar adopted the ECPAP rulewhich adds the befor and after rule, and built petri net forplural rules, increasing the number of rules able to change.However, their target users who defines the ECPAP rule isan owner of the room, not the non-expert users. Jung focusedon the users’ mental model, proposing an event definitionmethod using 5W1H [8]. However, to write in a 5W1Hmethod, there must be an environment where the sensor datais able to be understood as context, therefore it is insufficientto use at home or non-instrumented environment.Composite event detection research has been done in activedatabase research. Yoneki et. el. proposed to introduceinterval-based temporal operation to describe events in thesensor network system [12]. They defined 10 types of com-91
posite event operators such as conjunction, disjunction orconcatenation. Though their semantics covers various typesof composite events (e.g. including location information),high level language for defining the events is unconsidered.On the contrary, the Tag and Think [9] is a research usingtemporal relationship to detect events alike ours. In Tag andThink, in order to estimate what the object is from the valuesfrom the sensor nodes attached to the object, developerdefines the relation of the object’s status and the possible statusconsidering the temporal relationship, and evaluates fromthe state transition diagram and the status obtained by theexperimented data. Tag and Think defines the object’s statuswith the amount of change of a sensor at a certain time,therefore it enables estimation with high accuracy to variousenvironment. On the contrary, we have focused on notjust the same object, but on an environment where users candefine events containing multiple objects using the thresholdof sensor nodes. Additionally, the statement of a ”any”relation enables users to define events flexibily.CONCLUSIONTo enable context-aware services to fit user’s life or respondto users’ request, the importance of toolkit will be increasedin the decade ahead. To raelize toolkit for smart object services,this paper presents a smart object event markup languagecalled SOEML. Defining events is an unfamiliar taskfor users, so easy description way without complex programmingis necessary. SOEML enables users to define both simpleand complex event based on threasholds of sensor valuesby using XML format. To define complex event, users canuse various temporal logic. Additionally, we presented newrelation ”any” to improve flexibility of events. SOEML alsoprovides a reusability of event because it splits off logic andits target by using the Event Template.Finally we describe future work. First is an evaluation ofour system. We have plan to execute users study. Secondis cooperating with other sensors such as location sensorsor RFID. By introducing various sensors to SOEML, morecomplex event can be defined. Third is connecting events tovarious actuators. With cooperating information appliances,a toolkit which supports to bootstrap and create smart objectservices can be realized.REFERENCES1. jaxb: JAXB Reference Implementation.https://jaxb.dev.java.net/.2. J. F. Allen. Maintaining knowledge about temporalintervals. Commun. ACM, 26(11):832–843, 1983.3. J. E. Bardram. The java context awareness framework(jcaf) - a service infrastructure and programmingframework for context-aware applications. In H.-W.Gellersen, R. Want, and A. Schmidt, editors, Pervasive,volume 3468 of Lecture Notes in Computer Science,pages 98–115. Springer, 2005.4. M. Beigl, C. Decker, A. Krohn, T. Riedel, andT. Zimmer. parts: Low cost sensor networks at scale.In Ubicomp Demo Session, 2005.5. M. Beigl, H.-W. Gellersen, and A. Schmidt.Mediacups: experience with design and use ofcomputer-augmented everyday artifacts. ComputerNetworks (Amsterdam, Netherlands: 1999),35(4):401–409, 2001.6. G. Chen and D. Kotz. Solar: An open platform forcontext-aware mobile applications. In Proceedings ofthe First International Conference on PervasiveComputing (Short paper), pages 41–47, June 2002. Inan informal companion volume of short papers.7. A. K. Dey, T. Sohn, S. Streng, and J. Kodama. icap:Interactive prototyping of context-aware applications.In K. P. Fishkin, B. Schiele, P. Nixon, and A. J. Quigley,editors, Pervasive, volume 3968 of Lecture Notes inComputer Science, pages 254–271. Springer, 2006.8. J.-Y. Jung, Y.-S. Hong, T.-W. Kim, and J. Park.Human-centered event description for ubiquitousservice computing. In MUE, pages 1153–1157. IEEEComputer Society, 2007.9. T. Maekawa, Y. Yanagisawa, T. Hattori, andT. Okadome. A representation of objects for contextawareness in ubiquitous environments. DBSJ Letters,5(2):945–965, 2006.10. C. S. Shankar, A. Ranganathan, and R. Campbell. Aneca-p policy-based framework for managing ubiquitouscomputing environments. In MOBIQUITOUS ’05:Proceedings of the The Second Annual InternationalConference on Mobile and Ubiquitous Systems:Networking and Services, pages 33–44, Washington,DC, USA, 2005. IEEE Computer Society.11. K.-K. Yap, V. Srinivasan, and M. Motani. Max:human-centric search of the physical world. In SenSys’05: Proceedings of the 3rd international conference onEmbedded networked sensor systems, pages 166–179,New York, NY, USA, 2005. ACM Press.12. E. Yoneki and J. Bacon. Unified semantics for eventcorrelation over time and space in hybrid networkenvironments. In R. Meersman, Z. Tari, M.-S. Hacid,J. Mylopoulos, B. Pernici, Ö. Babaoglu, H.-A.Jacobsen, J. P. Loyall, M. Kifer, and S. Spaccapietra,editors, OTM Conferences (1), volume 3760 of LectureNotes in Computer Science, pages 366–384. Springer,2005.13. T. Yonezawa, H. Sakakibara, K. Koizumi, S. Miyajima,J. Nakazawa, K. Takashio, and H. Tokuda. upackage - apackage to enable do-it-yourself style ubiquitousservices with daily objects. In H. Ichikawa, W.-D. Cho,I. Satoh, and H. Y. Youn, editors, UCS, volume 4836 ofLecture Notes in Computer Science, pages 240–257.Springer, 2007.92
Configuration Method of Wireless Smart ObjectsKarri Nikunen, Hannu Heusala, Jere KomulainenUniversity of OuluDepartment of Electrical and Information EngineeringP.O. box 4500 , 90014 Oulu, Finlandfirst name.last name@ee.oulu.fi+358-8-553-7516ABSTRACTThis paper states that it is possible to reconfigure smartobjects over a wireless network. Smart objects cantransfer processor configurations, memory and otherhardware blocks through a network to other objects.Smart objects can carry several different configurationfiles and apply suitable configurations for specified tasks.Smart objects can also download configuration files overthe wireless network. With a swarm of these FPGA-basedobjects, it is possible to specify a new data processingparadigm: Cognitive Computing. A calculation platformcan easily adapt to the demands of a specific task. Someof the objects can be configured to function as memoryblocks, while others can function as processors or otherfunctional parts.An experimental prototype of the smart object has beenmade and tested. The smart object can send and receivedifferent configuration files and reconfigure itself for newconfigurations.Author KeywordsSmart Object, Cognitive Computing, wirelessconfigurationdevelopment of modern ICs (Integrated Circuit) and forthe current, most applied computing platform: the singlechipprocessor.We have few choices. Either to find a new technologythat allows us to keep following Moore’s Law and to addmore and more gates into logic designs that allow morecomplex systems to be built, or we can start researchingdifferent ways of adding complexity into systems. Andthat process has already begun. Processor companies likeIntel and AMD are bringing out new processors that havea new property: several processors next to each other inone silicon chip. This new way of thinking has madepossible less power consuming, more efficient dataprocessors. Still, there is the limit of how manyprocessors or logic gates can be fitted into one piece ofsilicon until it is not more profitable anymore. Finally,technology will meet its limit when there simply is notany more space available in one piece of silicon. At thispoint, at the latest, new technologies, such as the use ofwireless communication to contact several silicon chips,will have to be introduced..ACM Classification KeywordsH.5.3 Information interfaces and presentation (e.g., HCI):Group and Organization InterfacesINTRODUCTIONCMOS (Complementary Metal-Oxide Semiconductor)technology is at a state where line widths cannot get muchsmaller. Soon line widths will be the size of a few atomdiameters. Simultaneously, digital designs are gettingmore complex as processors and other systemarchitectures evolve. This will lead to a situation where itis not economically profitable to produce silicon wafersthat are big enough. This sets certain limitations for theCopyright is held by the author/owner(s).<strong>UbiComp</strong>’08 Workshop 4:Design and Integration Principles for Smart Objects (DIPSO 2008),September 21, 2008, Seoul, Korea.This position paper is not an official publication of <strong>UbiComp</strong> ’08Figure 1. Prototype of Smart Object with display.What if the demands of computing platform would bedivided among several – even millions of small smart93
objects? If these particles were small enough, they wouldneither use a lot of power, nor heat up excessively. Withsmall size they could be also independent of externalpower [1]. A swarm of these objects would be impossibleto configure one by one, but rather through a wirelessnetwork.REQUIREMENTS OF THE SMART OBJECTSBefore a smart object is capable of functioning as a solid,single member of any swarm, a lot of problems have to besolved.When dealing with a real swarm of smart objects, oneconcern is simultaneous possible configuration processesand any other exchange of data. There are plenty ofoptions on how to configure numerous objects, and theywill be discussed later. Communication standards must beapplied to ensure the transmission of the correct datapackets. Also, the possibility to add more smart objects toany swarm, without any restrictions, will be vital. Everysmart object will be named with an individual ID. Thepossible use of soft-core processor requires extraattention. Attention has to be paid to the design of theprocessor, because there are numerous similar processorsrunning simultaneously. Research for this will be donelater.SizeThe ultimate aim is to create smart objects the size of a tipof a needle, or smaller. This means that the human eyecannot distinguish an object of this size. Such objectscould be spread like powder, wherever a swarm of smartobjects was needed. This means that eventually physicalmanipulation of a single object is almost impossible,considering their small size. Thus, all the commands, dataand configurations would have to be sent over thenetwork.Power FeedThinking of smart objects in swarms makes you realizethat it would be almost impossible to feed power to all theobjects, especially with wires. The objects must carrysome kind of power production and storage within them,in order to achieve functionality in big numbers. The mostprobable means of producing energy for a smart objectwould be solar power or inductive feed of electric power.A very small battery must be integrated into the smartobject to ensure continuous power feed.CommunicationThe smart objects must have a communication device thatenables them to communicate with each other.Communication must be robust enough to ensure a securetransmission. The objects must share the samecommunication standard. The transmission of aconfiguration file is the most critical part of transmittingdata. The radio used in this work [6] is capable of sending32 bytes of data in one data packet. It is used through anSPI (Serial Peripheral Interface) and it uses 2.4 GHz baseband GFSK (Gaussian Frequency-Shift Keying)modulated frequencies.It is vital for the system to be able to send configurationfiles unharmed. This determines the importance of thetransmission in the configuration sequence. Thecorruption of bits will reflect on the appearance of thehardware of the smart object which might even resultphysical damage to the device.ConfigurationPrototypes are configured through Active Serialconfiguration mode [4]. First, a configuration is loadedfrom a computer to an external serial configuration device[5]. The device used in this prototype is Altera EPCS4. Asmart object always reconfigures itself from aconfiguration device. A basic configuration contains logicto operate the radio circuit through the SPI interface and astandard to communicate with other objects. This enablesthe reconfiguration of the smart object. The Basicconfiguration has to follow all the extensions of the smartobject configuration files, because every time an FPGA isreconfigured, it loses its previous configuration, includingthe abilities to use the SPI interface and to communicate.If the basic configuration is corrupted, it can be assumedthat the smart object is not working properly and it cannotbe restored without physical manipulation.Figure 2. Block diagram of a Smart Object.CONFIGURATION SEQUENCEFPGA ON SMART OBJECTNowadays, FPGAs provide the only known technology toenable reconfigurable, efficient calculation platforms. TheFPGA is the brain of a smart object. It can learn byreconfiguring itself with new configurations. This offersunlimited possibilities for the objects, because a swarm ofsmart objects can be reused for different purposes. Asingle object can be configured to have a soft-coreprocessor, DSP properties, or anything that fits into thelimited hardware space. On the other hand, several smartobjects can form e.g. a large amount of non-volatilememory.There are two types of configuration memorytechnologies existing in FPGAs. Configuration94
information of an SRAM-based FPGA is lost after powerhas been switched off. A flash-based FPGA has nonvolatilememory, which ensures that no configuration islost after a power shortage. An SRAM-based FPGA canbe configured directly from the computer, but it can alsouse flash-memory as a source of a configuration file. Aflash-based FPGA is more integrated than an SRAMbasedFPGA with an external configuration device. Ifsome of the memory is left unused from the configurationdevice, it can be used freely as an application memory tostore information in both technologies. This allowsobjects to send generic codes to objects during theconfiguration process. After the configuration, the smartobject can use generic codes, e.g. for setting a radiochannel.A smart object could also be implemented with amicrocontroller. Software that runs the microcontrollercould also be sent over the network and stored into aflash-memory. The microcontroller would be more energyefficient than an FPGA on modern technology, because ofthe leakage current of the FPGA. But because themicrocontroller is software controlled, it meansdramatically slow data processing speed. Although amicrocontroller might contain desired properties such asan analog-to-digital-converter, in the final implementationof a smart object, everything should be integrated in onechip.CONFIGURATION OVER THE NETWORKIn the case of an EP1C6 FPGA device, the size of a rawconfiguration file is 1167216 bits. The size of the SerialConfiguration Device, EPCS4, which is used in theprototype, is 4194304 bits. If compressed, theconfiguration file takes up less space than 1048576 bits,which is one fourth of the total size of the memory. Theradio used in this project, capable of transmitting 32 bytepackages, needs to transmit exactly 4096 packages totransfer one configuration file from one smart object toanother. Altera provides an IP mega function that makesthe implementation of a serial configuration device easier[7]. This mega-function can also be added to the design, ifa NIOS II processor is used.In this prototype, transmission of a configuration file isimplemented as follows: the object that is the receiver setsthe radio to function as a receiver and starts listening tothe channel. The transmitting object sets the radio totransmit and begins to read the configuration memoryfrom the beginning of the memory, 32 bytes at a time.Then, these 32 bytes of data are moved to a payloadbuffer of the radio. Then radio then transmits the dataover the channel to the target object. The transmittingobject has to know the address of the receiving object andboth objects should have the same channel set.The radio has built-in automation that ensures that thedata is sent successfully. After the radio has sent one datapacket, it immediately starts listening to the channel. Ifthe receiver receives a data packet, it sends anacknowledgement to the transmitter immediately. If thetransmitter receives the acknowledgement, thetransmitting object knows that the data has been sentsuccessfully. If the transmitter does not get theacknowledgement within a certain timeframe, it resendsthe current data packet over the channel. Limitations canbe set, how many times transmitter tries to resend onedata packet before it flags an error. Data packets havePIDs (packet ID) to ensure that the same packet is notreceived twice or more as a new packet.When transmitting a configuration file, the configurationprocess iterates itself as long as the whole configuration isread from the original location and sent and stored to thetarget memory of the target object. When everything isdone, the FPGA starts an automated reconfigurationprocess, during which it reads the new configuration filefrom the beginning of the memory and then reboots itselfwith a new configuration.Radio control requires only 4 pins. All the data is guidedthrough serial lines; MOSI and MISO (Master out SerialIn, Master In Serial Out). The radio functions as a slave,the FPGA as a master. The device also has an input SCK,which provides clock feed for the SPI logic. The SCK isgenerated by the logic in the FPGA. A CE is a chip enableinput, which enables the usage of a chip. All thecommands start by setting the CE to logic low. First, aone-byte command word is written to the radio, anddepending on the command, the data is read or written tothe radio. All the logic is done on the rising edge of theSCK. Figure 3 represents the radio control and theconnections required.An IRQ (Interrupt Request) pin works as a flag to pointwhen something has happened in the radio that requiresattention: When a new packet arrives, data is sentsuccessfully, or an attempt to send data has occurred toomany times, the IRQ pin activates. In this project the IRQhas its own FSM (Finite State Machine) that producesinformation for the smart object every time the IRQ isactivated.Figure 3. Radio SPI: inputs and outputsThe transmission and the receiving of a configurationhave their own FSMs, and the SPI has its own FSM. Themain-FSM, the transmission FSM and the IRQ-FSM usethe SPI-FSM. Control of the SPI can also be implementedas a ready-made IP-block if NIOS II architecture is used.95
Over-the-air-programmingOTAP (Over-the-Air-Programming) is a common term insensor network platforms. They have some similarcharacteristics with smart objects. Both are configuredover a network and both are designed to work with smallenergy consumption. There are two major approaches forthe sensor nodes, the work based on microcontrollers [9,10] and FPGAs [11, 12]. Efficient ways of transmitting aconfiguration code to nodes is discussed in [10]. Thefunction of these wireless nodes is to gather informationfrom the environment, and possibly to process theinformation in the node before transmitting the data to thecomputer that assembles gathered data. Intention of thisproject is to get a swarm of smart objects to function as asolid system.ASSEMBLY OF THE PROTOTYPEA photograph of the prototype of a smart objectdeveloped in this project can be seen in Figure 1. Thedimensions of this first prototype are approximately 4 cmper side. The height is approximately 1 cm. The smartobject can nowadays be made much smaller, but thedeveloped first version required some extra properties tobe debugged to achieve the desired functionality.Currently, the dominating component of the object is theFPGA device itself, which measures 22 by 22 mm. [2].Two step-down regulators [8], the serial configurationdevice and the radio circuit are approximately 4 by 4 mm,each.Considering the possibly quite minimal size of a smartobject, the most significant problem is power production.If the smallest existing Flash-based FPGA is used, a smartobject without power blocks could be fitted into thevolume of 1 cm 3 . Professional integration of thecomponents, when the whole smart object is designed intoa mixed-signal silicon chip, will result, in a decade ormore, in a smaller smart object.P idleP RXP TX58,5mW101,4mW81,9mWTable 1. Average Power consumption of smart objectCollecting solar power from this area, when thinkingsmart object the size of 1 cm 3 covered with solar panel,produces an insufficient amount of energy to run orcharge a smart object. This would require a bigger panelthan the object itself. Solar panel technology of todaycannot meet the requirements of this project yet. Use ofinductive Power is not researched in this paper.Table 1 represents power consumption of smart object ondifferent circumstances. Idle Power consumption presentsa state when FPGA has configured itself and is workingnormally. Power consumption of receiver is bigger thantransmitter because receiver has to listen to the channelcontinuously when transmitter operates in bursts. Radiocan be easily turned off after transmission to save energy.If a soft-core processor is to be used in a smart object,more space is needed in the reconfigurable logic. Thismeans a bigger FPGA. A soft-core NIOS II-processorrequires in its smallest version approximately 700 FPGALEs (Logic Elements) [3]. This means that the smallestversions of the processor cores can be implementedseveral times on an FPGA, which is used in this project.An EP1C6, used in the prototype, has 5980 LEs [2]. Thesimplest soft-core processor contains only basicperipherals, and the IP mega function that enables themanipulation of the external flash memory cannot befitted into the EP1C6. Adding a mandatory memorymanipulation property for the NIOS II processor requiresa bigger FPGA.In this project, the transmission of the configuration fileand the functionality of the transmitted configuration filehas been tested and proved to be working. The testing hasbeen made so that the first smart object has beenconfigured to have no outputs. Then, another smart objectwith a more complex configuration has sent itsconfiguration file to the first object. As a result, bothsmart objects have the same more complex configurationworking, and it has proved to be working correctly withsame usage of outputs on both objects.Configuration files with different purposes can also betransferred. Smart objects can carry several configurationfiles depending on the size of the external SerialConfiguration Device. The device used in this project canhold up to 4 different configurations. A configuration thatis going to be driven into the FPGA must always be at a“zero” location in the external serial configuration device.If an old configuration file that is located in “zero”-location is to be saved, it has to be moved before the newreconfiguration process. If an NIOS II processor is used,it is important to be aware of the fact that the program thatruns the soft-core processor is stored in the external SerialConfiguration Device. This limits the number of possibleconfiguration files. Furthermore, if a configuration devicecontains some non-configuration data that needs to besaved, the whole memory cannot be formatted duringreconfiguration.CONCLUSIONThe development of future computing platforms mightrequire some changes to the trends of modern technology.If no new technologies appear, this will mean certainlimitations for the development of modern computingplatforms.Implementation presented in this paper is the mostsuitable method when beginning to research techniquesfor making a swarm of wireless, reconfigurable smartobjects to work together. An FPGA is a more efficientplatform for complex calculations than a microcontroller,96
as possible processor architecture might have to bedesigned specifically for the smart objects.This paper introduces a way to connect small smartobjects wirelessly. Configuration files can be sent andstored into smart objects. The objects can receivedifferent configurations from other objects andreconfigure themselves according to the needs of thesystem, without any physical contact. A swarm of smartobjects offer a solution to the rising demand forcomputing platform efficiency. With some more research,the calculation complexity of the computing platform canbe increased, simply by adding more objects into thesystem. A swarm of smart objects create a new trend ofcomputing – Cognitive Computing.ACKNOWLEDGEMENTWe would like to thank the University Program of Alteraand Nordic Semiconductor for the donation of the devicesand the evaluation boards used to implement theprototypes.REFERENCES1. Heusala H. “Technology Trends and Design Aspectsof Data Processing Cores of Future Small SmartObjects. Proceedings of DIPSO-07. 2007.2. Altera Cyclone Devices.http://www.altera.com/literature/sg/productcatalog.pdf3. Altera Nios II Processor, Wikipedia.http://en.wikipedia.org/wiki/Nios_II4. Active Serial Configuration.http://www.altera.com/support/devices/configuration/schemes/active-serial/cfg-as.html5. Altera EPCS serial configuration device.http://www.altera.com/literature/lit-config.jsp6. Nordic Semiconductor nRF24L01 single Chip 2.4GHzTransceiver.http://www.nordicsemi.com/index.cfm?obj=product&act=display&pro=897. Altera altasmi_parallel Megafunction.http://www.altera.com/literature/ug/mfug_asmi.pdf8. Texas Instruments. TPS62203, 3.3-V Output, 300-mA,95% Efficient Step-Down Converter, TPS 62201, 1.5-V Output, 300-mA, 95% Efficient Step-DownConverter. URL: http://www.ti.com/9. Prabal Dutta; Grimmer, M.; Arora, A.; Bibyk, S.;Culler, D. “Design of a Wireless Sensor NetworkPlatform for Detecting Rare, Random, and EphemeralEvents”; Information Proc. in Sensor Networks, 2005.IPSN 2005. Page(s):497 – 50210.Qiang Wang; Yaoyao Zhu; Liang Cheng;“Reprogramming wireless sensor networks: challengesand approaches”. Network, IEEE May-june 2006Volume 20, issue: 3, pp. 48-5511.Hinkelmann H, Reinhardt A, Varyani S, Glesner M;“A Reconfigurable Prototyping Platform for SmartSensor Networks”. Programmable Logic, 2008 4thSouthern Conference Page(s):125 – 13012.Portilla J, Riesgo T, de Castro A; "A ReconfigurableFPGA-Based Architecture for Modular Nodes inwireless Sensor Networks," in Proc. 3rd SouthernConference on Programmable Logic, 2007, pp. 203-206.97
Randomised Collaborative Transmission of Smart ObjectsStephan SiggDistributed and Ubiquitous ComputingTechnical University of Braunschweig,Germanysigg@ibr.cs.tu-bs.deMichael BeiglDistributed and Ubiquitous ComputingTechnical University of Braunschweig,Germanybeigl@ibr.cs.tu-bs.deABSTRACTWe propose a randomised approach to time and frequencysynchronisation of superimposed received signals from collaborativelytransmitting smart objects. The technique is feasiblewithout communication between nodes and entirely relieson the receiver feedback. It is practical for an arbitrarynumber of received signals and transmitter nodes. The superimposedreceived signal has its maximum constructiveinterference focused on an arbitrary location of a remote receiver.In both, analytic considerations and in a simulationenvironment we demonstrate that synchronisation of severalhundred received signals is possible within milliseconds.Author KeywordsCollaborative transmission, Sensor networks, Optimisation,(1+1)-EA, Smart ObjectsACM Classification KeywordsC2.7.c Sensor networks, I2.m.c Evolutionary computing andgenetic algorithms.INTRODUCTIONIn recent years, computing devices of diminishing size thatembed sensing capabilities, communication and actuationhave become reality [1, 2, 3]. In [4], nodes of 1-4mm 2size are discussed so that a paintable or even sprayable networkof smart objects may be envisioned that seamlessly integratesinto everyday artefacts, cloths or buildings. Consequently,a scenario in which a huge number of communicationdevices pervasively resides in one or several smartobjects is possible. However, at such extreme sizes, energyconsumption and lifetime become major concerns forthe design of sensing, communication and computing hardwarethat is integrated in these smart objects. An ambitioussolution to power supply at these sizes are parasitically operatingnodes that obtain energy, for instance, from solar,environmental movement, temperature change or chemicalreactions in living organisms [5, 6]. The energy consumptionof parasitic nodes is restricted to several ten microwatts.Copyright is held by the author/owner(s) <strong>UbiComp</strong>’08 Workshop September 21st, 2008 This position paper is not an officialpublication of <strong>UbiComp</strong>’08.1This greatly impacts the transmission range of parasitic sensornodes so that information can only be obtained from thenetwork, when the receiver is in direct proximity with thetransmitting nodes which is not feasible in many applicationscenarios [7]. One solution to this problem is to cooperativelytransmit information by distinct nodes of a networkby utilising constructive interference of the transmitted signalsat the receiver. When signal components are simultaneouslyreceived, they add up to a sum signal. If they are notsynchronised, the interference is destructive, which leads toa distorted signal at the receiver. When, however, identicalsignal components arrive at a receiver in phase, the interferenceis constructive and the signal strength is improved. Cooperationcan increase the capacity and robustness of a networkof transmitters [8, 1] as well as the maximum transmissionrange [9] and decreases the average energy consumptionper node [10, 11].The use of constructive interference in sensor networks wasstudied by various groups in the last decade [12, 13, 8, 14,15, 16, 17]. These approaches utilise neighbouring nodesas relays [18, 19, 20] as originally proposed by Cover andEl Gamal in [21]. Neighbouring nodes repeat a recently receivedsignal to achieve a sufficient synchronisation of signalsat a receiver. The major drawback of this approach isthat the nodes are not synchronised wherefore the location atwhich a maximum constructive interference of signal componentsis observed is also a random parameter that dependson several aspects as the placement of nodes, the synchronisationbetween nodes or the environmental reflection of signalcomponents. For practical applications this means thatthe receiver has to relocate to find sufficiently synchronisedsignal components, if there are any.Cooperative transmission is accomplished in the literatureby three distinct approaches: Multi-hop, Data flooding andcluster based.Multi-hop relaying relies on the physical channel. The multihopscenario is interpreted as multi-dimensional relay channel,where communication between all nodes is allowed [22].It has been shown that this approach optimally divides thenetwork resources in terms of information theoretic metrics[23]. With increasing scenario sizes, this approach is, however,not well suited since the number of transmitted bits persquare meter decreases quadratically with the size of the network[24, 25].An alternative approach that bases on flooding the network98
with a message that shall be transmitted is presented in [26,27]. The opportunistic large array (OLA) method utilisesthe constructive interference of spatially related transmissionsignals of nodes in a sensor network. Neighbouring transmittersfunction as relay nodes that retransmit a received signalvarious times. In this approach the network is floodedwith nodes that transmit the desired signal whereby constructiveinterference is created. A related approach is presentedin [16, 15, 28], where the signal is overlaid with whitenoise to increase the probability of constructive interference.However, for all these strategies the maximum constructiveinterference occurs at a random point in the transmissionrange since nodes are not synchronised and also no receiverfeedback is utilised.The third, cluster based approach was first proposed in [29].The basic idea is to build up clusters of collaboratively transmittingnodes that cooperate when sending or receiving messages[23]. In [30] the optimal cluster design is derived. Thisapproach has the benefit that standard routing algorithms aswell as multi-hop theory can be applied with little modification.However, the capacity of a network that follows thistopology is lower than for the previously detailed approaches[25, 31].In contrast to these cooperative approaches we propose toutilise the receiver feedback in order to guide the synchronisationof transmitted signals. By doing this we are ableto synchronise a virtually unlimited number of received signalsat any concrete target location of a receiver without theneed of cooperation between nodes and at a very fast pace.With respect to the fact that no cooperation between nodes isrequired we refer to this approach as collaborative transmission.In the following sections we demonstrate that it is possiblewith collaborative transmission to increase the strengthof a received signal by a factor that is easily larger than 100in a fraction of a second.COLLABORATIVELY TRANSMITTING SMART OBJECTSWe are especially interested in the communication betweenand with smart objects. The focus of this work is on thesensing, computation and communication components of intercommunicatingsmart objects. For ease of presentation werefer to such a network of smart objects as a wireless sensornetwork (WSN), since not the types of smart objects but thenumber of nodes that contribute in communication is relevantfor our approach.We consider the following scenario. A sensor network of ntiny, square millimetre sized, parasitic sensor nodes is deployedwith a high density of sensors per square meter. Theinformation sensed by the sensor nodes is to be transmittedto a stationary remote receiver that is located far off thetransmission range of each single sensor node. The receivercan, however transmit a feedback regarding the measuredchannel quality back to the sensor network. It is possibleto measure the channel quality in terms of impulse responseof a potentially superimposed channel and to estimate thefuture channel state by long-term prediction at the transmitterside. This approach is, for example, investigated by thegroup of Lajos Hanzo at the University of Southampton withfocus on the improvement of MISO and MIMO techniques[32, 33, 34]. It requires, however, ambitious capabilities atthe transmitter and receiver side and is for that reason currentlynot feasible for parasitic sensor nodes.We therefore propose an initialisation phase triggered by theremote receiver. In this phase all nodes simultaneously transmita predefined signal for synchronisation purposes. Theremote receiver compares the received superimposed signalwith the expected sequence and transmits the sum differencebetween both signals as feedback. This feedback guides thesynchronisation process at the sensor nodes. When nodesare sufficiently synchronised, the receiver ends the initialisationphase and requests data. Synchronisation betweentransmitted signals is obtained by phase shifting the basebandsignal at the sensor nodes. This can be accomplishedfor sensor nodes either by utilisation of VCO-elements orby even simpler L/RC-transmitter types. These transmittersenable the easy time/phase shift of a signal by short timealteration of the baseband frequency. In spite of this, thesetransmitter types are highly error prone so that frequencyas well as phase shift are subject to errors. Since the moreexact VCO-elements are, however, way more expensive andare not likely to decrease in cost due to manufacturing conditions,we believe that L/RC-transmitters are the only feasibleway of implementing parasitic sensor nodes that collaborativelytransmit their data.We investigate the synchronisation process and model thescenario as black-box optimisation problem. The search spaceof the problem is given by the combined frequency and phaseshifted received signals. One point in the search space isgiven by one configuration of transmitted signals:∑signali (t) (1)W.l.o.g. we assume that a sinus signal at f base =2.4 GHz istransmitted by the nodes so thatsignal i (t) =A · sin(2π · (f base + f i ) · t + ϕ i ) (2)with phase shift ϕ i and frequency shift f i defines one configurationof signal i. At time interval t a search point C(t)is given by the set of configurations for all received signals.n∑C(t) = signal i (t) (3)i=1The fitness function f fitness : C → R is provided by thereceiver feedback. W.l.o.g. we assume that the optimisationaim is minimisation. We apply a (μ + λ) evolutionaryalgorithm to this problem with μ = λ =1, which meansthat population size as well as offspring population size are1 and the offspring is chosen as the best (in terms of fitnessvalue) individual of these two. Since population size is 1, nocrossover is applied and mutation is the only search operator.The (1+1)-EA is a natural choice in this problem domainsince a population directly refers to one configuration C ofthe sensor network.299
Figure 2. Illustration of periodic relative phase shifts between severalsignals at various frequencies.Figure 1. Illustration of the basic scenario. From iteration i to iterationi +1a mutation is applied to sensor node n.Mutation in the sensor network is obtained without cooperationbetween sensor nodes. Every node decides randomly aftereach period of the transmitted signal whether a mutationis applied. In positive case the phase of the signal is alteredby a random process. As detailed above, this might also resultin frequency alteration. The alteration is maintained infuture iterations when the receiver feedback is improved andis reversed otherwise. This principle is illustrated in figure 1.In the figure, node n alters the phase of the transmission signal.Because the fitness value observed in iteration i +1isimproved, this alteration is maintained also in iteration i +2In the following sections we present analytic results on theoptimisation speed as well as on the performance the approachachieved in simulations.ANALYTIC CONSIDERATIONIn the analytic consideration we aim to estimate the expectedoptimisation time for a (1+1)-EA on the optimisation problem.We assume that the optimisation aim is to obtain perfectsynchronisation between all n received signals. This meansthat all n signals at the receiver have identical phase and frequency.As discussed above, due to the utilisation of L/RC-elementsfrequency and phase are potentially distinct between signals.Consequently the periods of the signals are of distinct lengthas depicted in figure 2. We assume that the actual frequencyof the signals is centred around a base frequency while thedeviation is guided by a random process. We assume a Gaussiandistributed process with a standard deviation of σ. Forthe analytic consideration, we assume that the fitness valueis given by the maximum count of received signals that arein phase:f fitness = max{|Sκω|} i (4)iwhere Sκω i = {signal i (t)|ϕ i = κ, f i = ω}. We assume thata total of k different phase shifts are possible and consider amaximum of l discrete frequencies.As depicted in figure 2, the relative phase shift between signalsof distinct frequencies is not constant over time. However,given any two signals s i (t) and s j (t), the same sequenceof relative phase shifts occurs repeatedly, and therepentance-frequency is given by the lowest common multipleof the period lengths of the signals. The same mutationof one signal can therefore have different impact onthe received sum signal, because the time of mutation alsomatters. Since, however, the mutation time as well as themutation itself are guided by random processes, this propertydoes not impact the analytic consideration. We assumea uniformly distributed mutation probability of p m = 1 n foreach of the n sensor nodes and uniform distribution of allpossible mutation outcomes. Since k distinct phases and ldistinct frequencies are considered, a specific mutation occurswith probability1k·l−1 .In order to estimate the expected optimisation time, we haveto understand the optimisation problem a bit better. Accordingto the fitness function, the individuals with worst fitnessvalue have distinct phase and frequency for all signal i (t) inC(t). Basically, the fitness function is guided by the numberof signals that are received synchronously in phase andfrequency. The maximum fitness value is therefore given bythe number of nodes (n) and it declines every time the largestset of synchronously received signals is increased. We consequentlyobtain a fitness based partition of the search spacewith n partitions. The partition with fitness value f fitnessis then labelled L n−ffitness . The probability to increase thefitness value by at least one is1k · l − 1 · n − f fitness(5)nsince every one of the n − f fitness not synchronised signalsis altered in phase and frequency with probability 1 nand achieves the specific mutation required with probability1k·l−1. The optimisation of the (1+1)-EA is guided bythe fitness function which has the same value for all individualsin L i but differs for all individuals in L j with i ≠ j.3100
Whenever the fitness value is increased due to a mutation,the current layer L i is left by the algorithm. In layer i, atotal of( )n − i= n − i (6)11-bit mutations with probability 1 n · 1k·l−1each suffice to improvethe fitness value. We therefore require that at least oneof the not synchronised signals is correctly altered in phaseor frequency while all other n−1 signals remain unchanged.This happens with probability( )n − i· 1(1 n · 1k · l − 1 · 1 − 1 ) n−1n() (n − i=· 1 − 1 n−1. (7)n · (k · l − 1) n)Since(1 − 1 ) n< 1 (n e < 1 −n) 1 n−1(8)We obtain for the probability s i that L i is left and a layer jwith j
Figure 3. Illustration of the received superimposed signal at various times in the optimisation run.5102
of the sensor network and l and k describe the amount ofvariation in phase and frequency.In a simulation environment we obtained a synchronisationtime of about 17 milliseconds and an amplitude boost of thereceived signal of approximately factor 800 for a network of1000 collaboratively transmitting nodes at 2.4 GHz.We conclude that reasonable movement of transmitting orsending nodes is also possible with such rapid initialisationspeed.REFERENCES1. J. Laneman, G. Wornell, and D. Tse, “An efficient protocol forrealising cooperative diversity in wireless networks,” in Proceedingsof the IEEE International Symposium on Information Theory, 2001, p.294.2. D. Culler, D. Estrin, and M. Srivastava, “Overview of sensornetworks,” IEEE Computer, vol. 37, no. 8, pp. 41–49, August 2004.3. F. Zhao and L. Guibas, Wireless Sensor Networks: An InformationProcessing Approach. Los Altos, CA: Morgan Kaufmann, 2004.4. W. J. Butera, “Programming a paintable computer,” Ph.D. dissertation,Massachusetts Institute of Technology, 2002.5. J. M. Kahn, R. H. Katz, and K. S. J. Pister, “Emerging challenges:Mobile networking for smart dust,” Journal of CommuncationNetworks, vol. 2, no. 3, pp. 188–196, 2000.6. L. Benini, E. Farella, and C. Guiducci, “Wireless sensor networks:Enabling technology for ambient intelligence,” MicroelectronicsJournal, vol. 37, no. 12, pp. 1639–1649, 2006.7. K. Römer and F. Mattern, “The design space of wireless sensornetworks,” IEEE Wireless Communications, vol. 11, no. 6, pp. 54–62,2004.8. A. Sendonaris, E. Erkop, and B. Aazhang, “Increasing uplink capacityvia user cooperation diversity,” in IEEE Proceedins of theInternational Symposium on Information Theory (ISIT), 2001, p. 156.9. A. Scaglione and Y.-W. Hong, “Opportunistic large arrays:Cooperative transmission in wireless multihop ad hoc networks toreach far distances,” IEEE Transactions on Signal Processing, vol. 51,no. 8, pp. 2082–2092, August 2003.10. Y.-W. Hong and A. Scaglione, “Critical power for connectivity withcooperative transmission in wireless ad hoc sensor networks,” in IEEEWorkshop on Statistical Signal Processing, September 2003.11. ——, “Energy-efficient broadcasting with cooperative transmission inwireless sensor networks,” IEEE Transactions on Wirelesscommunications, August 2005.12. J. Laneman and G. Wornell, “Energy-efficient antenna sharing andrelaying for wireless networks,” in Proceedings of the IEEE WirelessCommunication Networking Conference, 2000, p. 294.13. J. Lanemann, D. Tse, and G. Wornell, “Cooperative diversity inwireless networks: Efficient protocols and outage behaviour,”Transactions on inforamtion Theory, vol. 50, no. 12, December 2004.14. R. Nabar, H. Bölscskei, and G. Wornell, “Fading relay channels:Performance limits and space-time signal design,” IEEE Journal onSelected Areas in Communications, vol. 22, no. 6, pp. 1099–1109,August 2004.15. A. Krohn, “Superimposed radio signals for wireless sensor networks,”Ph.D. dissertation, Technical University of Braunschweig, January2007.16. A. Krohn, M. Beigl, C. Decker, and D. G. Varona, “Increasingconnectivity in wireless sensor network using cooperativetransmission,” in 3rd International Conference on Networked SensingSystems (INSS), May 2006.17. A. Krohn, M. Beigl, C. Decker, and T. Riedel, “Syncob: Collaborativetime synchronization in wireless sensor networks,” in Proceedings ofthe 4th International Conference on Networked Sensing Systems(INSS). Braunschweig, Germany, June 2007, pp. 283–290.18. J. Laneman and G. Wornell, “Distributed space-time coded protocolsfor exploiting cooperative diversity in wireless networks,” IEEETransactions on Information theory, vol. 49, no. 10, pp. 2415–2425,October 2003.19. A. Sendonaris, E. Erkip, and B. Aazhang, “User cooperation diversity– part i: System description,” IEEE Transactions on Communications,vol. 51, no. 11, pp. 1927–1938, November 2003.20. E. Zimmermann, P. Herhold, and G. Fettweis, “On the performance ofcooperative relaying protocols in wireless networks,” EuropeanTransactions on Telecommunications, vol. 16, no. 1, pp. 5–16, January2005.21. T. M. Cover and A. A. E. Gamal, “Capacity theorems for the relaychannel,” IEEE Transactions on Information Theory, vol. 525, no. 5,pp. 572–584, September 1979.22. G. Kramer, M. Gastpar, and P. Gupta, “Cooperative strategies andcapacity theorems for relay networks,” IEEE Transactions onInformation Theory, vol. 51, no. 9, pp. 3037–3063, September 2005.23. A. del Coso, U. Sagnolini, and C. Ibars, “Cooperative distributedmimo channels in wireless sensor networks,” IEEE Journal onSelected Areas in Communications, vol. 25, no. 2, pp. 402–414,February 2007.24. A. Scaglione and Y.-W. Hong, “Cooperative models forsynchronization, scheduling and transmission in large scale sensornetworks: An overview,” in 1st IEEE International Workshop onComputational Advances in Multi-Sensor Adaptive Processing,December 2005, pp. 60–63.25. P. Gupta and R. P. Kumar, “The capacity of wireless networks,” IEEETransactions on Information Theory, vol. 46, no. 2, pp. 388–404,March 2000.26. P. Mitran, H. Ochiai, and V. Tarokh, “Space-time diversityenhancements using collaborative communications,” IEEETransactions on Information Theory, vol. 51, no. 6, pp. 2041–2057,June 2005.27. O. Simeone and U. Spagnolini, “Capacity region of wireless ad hocnetworks using opportunistic collaborative communications,” inProceedings of the International Conference on Communications(ICC), May 2006.28. A. Krohn, “Optimal non-coherent m-ary energy shift keying forcooperative transmission in sensor networks,” in 31st IEEEInternational Conference on Acoustics, Speech, and Signal Processing(ICASSP), May 2006.29. C. Shuguang and A. Goldsmith, “Energy-efficiency of mimo andcooperative mimo techniques in sensor networks,” IEEE Journal onSelected Areas in Communications, vol. 22, no. 6, pp. 1089–1098,August 2004.30. L. Pillutla and V. Krishnamurthy, “Joint rate and cluster optimisationin cooperative mimo sensor networks,” in Proceedings of the 6th IEEEWorkshop on signal Processing Advances in WirelessCommunications, March 2005, pp. 265–269.31. M. Gastpar and M. Vetterli, “On the capacity of wireless networks:the relay case,” in Proceedings of the IEEE Infocom, June 2002, pp.1577–1586.32. D. Yang, L.-L. Yang, and L. Hanzo, “Performance of sdma mimosystems using transmitter preprocessing based on error-infestedfinite-predcision vector-quantized channel impulse responsefeedback,” VTC 07 Spring, 2007.33. W. Liu, L.-L. Yang, and L. Hanzo, “Svd assisted joint multiusertransmitter and multiuser detector design for mimo systems,” IEEEICC’08, May 2008.34. C.-Y. Wei, J. Wang, and L. Hanzo, “Exit chart aided irregularconvolutional code design for iterative downlink sdma systems usingimperfect channel state information,” SiPS, October 2007.6103
Experimental Wired Co-operation Architecture of ReconfigurableSmall Smart ObjectsJere Komulainen, Hannu Heusala, Karri NikunenDepartment of Electrical and Information EngineeringUniversity of OuluOulu, Finland(jkom, hhh, karri.pehkonen)@ee.oulu.fiABSTRACTThis paper describes a preliminary study and experimentaldesign of future small smart objects. Especially, reconfigurablesmall smart objects in a solid wired grid are considered.The most important property of future small smartobjects will be their ability to communicate with each otherand effectively co-operate. This can be done in many waysand one is described in this paper. A network of small smartobjects is a network structure which enables objects to forma fabric like physical structure in which objects can communicate.Actually, building small smart objects and theentire network is not possible using present technology becauseof its physical size, but a technology independentstructure and operation can be considered. The networkstructure is based on the idea that small smart objects areconnected to each other and all objects supply data packetsto each other in order to enable communication between allobjects. Objects can also copy their configuration to adjacentobjects which helps to set up and maintain the network.Author KeywordsTransparent structure, FPGA, Packet Transmission.ACM Classification KeywordsH5.m. Information interfaces and presentation (e.g., HCI):Miscellaneous.Copyright is held by the author/owner(s). <strong>UbiComp</strong> '08 Workshop September 21st, 2008. This position paperis not an official publication of <strong>UbiComp</strong> '08INTRODUCTIONDevelopment of integrated circuit's development has alwaysbeen towards smaller and faster components and devices.During last decades, the development has been enabledmainly by continuous progress in IC fabrication technology.Almost every year, silicon chip manufacturers have movedto use smaller pitch width but the basic technology has remainedalmost the same. Switching elements on siliconchips are made smaller and more power efficient by decreasingthe line width. The phase of moving to use narrowerline width which leads to larger number of transistorson a chip has followed Moore's law [5]. Moore's law indicatesexponential growth and it is clear that it can't go onindefinitely. When CMOS (Complementary Metal OxideSemiconductor) line width comes to a point where it can'tbe reduced any more the overall progress in IC technologywill most definitely continue with some other technologythan CMOS.Semiconductor technology has moved to use 65 nm linewidth in manufacturing ICs in 2007 and some 40 nm circuitshave been introduced in 2008 [3]. According to ITRSRoad Map for semiconductors, line width will narrow downto 14 nm by 2020 [6]. With 65 nm technology the area ofone CMOS logic gate (4-transistors) is 1.3 μm 2 . If humaneye can distinguish objects that are bigger than 200 μm butnot smaller it, is possible to implement approximately30,000 logic gates on 40,000 μm 2 area that can't be seen bya human eye. Even if, all the chip area could be used toimplement logic, only some basic functions could berealized with these chips. From now on, in this paper, theseinvisible chips are called small smart objects or just objects.One solution for the problem that individual chips are toosmall to house the logic to perform any practical functions,is to use lots of these small objects to perform the overallfunction. The physical structure could still be invisible, ifobjects are not too close to each other. Small smart objectswould communicate with each other and enable largedesign entities even though individual parts are small. Onekind of transparent computing platform could be madeconnecting objects few millimeters apart from each other.Distance between objects depends on application but inorder to maintain transparency objects can't lie right next toeach other. Possible application for this kind of transparentfabric could be interactive display which could sense manykind of stimuli through its sensors and display the data itprocesses. E.g., objects in display-structure would containlight emitting device (LEDs) therefore one object couldform a pixel on display. Display could also process all datait receives and display the processed data. Some quantitiesthat display could measure are, e.g., temperature, airpressure, air pollution, humidity, light intensity and noise.104
On the display, only objects that have LEDs on would bevisible.There are also possible future applications that need wirelesscommunication between objects and so solid network isnot a good solution for all kind of small smart objectscommunication. One of these future products is nanorobotsthat can be utilized in medical applications. In medical applicationsnanorobots size of a blood cell could followblood vessel and reach almost any part of a human bodyinternally. Specially, in cancer treatment there is two importantfactors that effect patient’s odds on surviving cancer:the cancer has to be diagnosed as soon as possible in orderto start treatment before it is too late. And drug delivery hasto be well targeted to reduce side effects from chemotherapy.Both these tasks could be carried out with nanorobotsthat find tumor cells and kill the cells. [4]Although, mass production of small smart objects is neithereconomically nor technologically possible today, it is worthconsidering beforehand how these objects would functionand communicate with each other. In this paper a simplestructure of solid communication network is introducedIMPLEMENTATION OF DIGITAL LOGICWhen designing digital logic there are in general two optionsavailable to implement the design: Application SpecificIntegrated Circuits (ASIC) and Field ProgrammableGate Arrays (FPGA). Although same operations can berealized with both circuits there are some big differences.Differences between ASIC and FPGA implementations’area efficiency, power consumption and speed have beenstudied in [7]. Differences seem to be quite significant anddon’t really praise FPGA circuits. Area efficiency of FPGAcompared to ASIC varies from 40 times worse when onlylogic elements are used to 21 times worse when FPGA's“hard” blocks, like multipliers and block memories, areused. Dynamic power consumption is approximately 12times bigger with only logic elements in use and only littlebit smaller when “hard” blocks are used. Critical path delayis 3 to 4 times longer with FPGA and figure is the samewith and without “hard” blocks. These numbers illustratesthe supremacy of ASIC over FPGA when considering onlyproperties that are important in completed product that isnot adaptable. FPGA's “hard” blocks mean fixed and optimizedblocks that are supposed to function optimally.Both circuits have their pros and cons. ASIC implementationis much better when considering power consumption,speed and area efficiency. Therefore ASIC is better if objecthas some specific function to fulfill and it will remain thesame entire product life cycle. ASIC implementation requiressubstantially more design effort than FPGA. FPGAhas advantage of being reconfigurable, which means, in thecase of smart objects, that the hardware structure of thelogic inside of one individual object can be configured toexecute different functions at different times. In ASIC implementations,logic configuration has to be fixed duringdesign phase and no changes to the hardware structure canme made after that. This also means, that even though thesilicon area of FPGA implementation is approximately 40times that of respective ASIC area, the difference doesn'tmatter that much if the following three conditions are met.First, the function that is used at once fits on FPGA-circuit.Second, there is lot of small functions that are totally independentfrom each other and only one function has to beexecuted at the same time. And last, the delay due to reconfigurationdoesn't affect operation. These are the basic designconditions that have to be met if considering implementingsuch a big design on FPGA that it doesn't entirelyfit on a FPGA-circuit.Difference in area efficiency is still quite significant andmeans that the same silicon area of an ASIC implementationcan contain up to 40 different variations of that onefunction a respective FPGA area contains. For example,implementation of 40 different variations of a certain digitaldecoder/encoder could be implemented to occupy on ASICthe same area as one version in an FPGA. On the otherhand, some new coding methods could be introduced afterthe ASIC has been made. In this case ASIC can't be modifiedbut FPGA can still get the job done. However, onecommercial FPGA device can contain logic structure whichis equivalent to more than one million 2-input NAND gates.If the digital logic implementation of a smart object’s intelligencefit into a FPGA device containing logic structureequivalent to less than couple of millions of basic gates,then the ASIC implementation is not practical at all.Even though ASIC's logic is fixed, it is not totally out ofconsideration when talking about adaptable function. Thereis a way to use ASIC and still maintain adaptability. Whena processor is implemented on ASIC the logic design isfixed but the program code can be modified. This allowsobject's operation to be modified. On the other hand, wewould still miss some FPGA's properties and if design entityof a small smart object is very small it is very wastefulto use processor that requires a lot more resources thansimple control logic on FPGA. This paper concentrates onthese very small smart objects and therefore processor implementationson ASIC is not considered here.When designing small smart objects there is one more reasonto use FPGA circuits instead of ASIC. Using FPGAs,all individual smart objects in a swarm can have the samedigital hardware structure, because the specific functionalityof an object can be configured separately to all objects.In case of sensor network or some other application thatneeds lot of different components on different objects, usingthe same hardware might be inefficient but could bedone.COMMUNICATION NETWORK OF SMALL SMARTOBJECTSIn this paper a model of a communication network thatcould be used in interactive display application is proposed.105
The structure of network is matrix like network in whichsmall smart objects are next to each other. Example of acommunication network is shown in Figure 1. Blue arrowsare data buses and red arrows acknowledgement bits thatobjects use to tell transmitting object that data is being received.As well as objects data is transmitted through theseconnections also power and configuration are supplied toobjects using these connections.Figure 1. Structure of the communication network. (Only dataconnections are shown)Objects are mainly connected to four adjacent objects andthey are able to send data to two of those on the right andbelow and receive data from two on the left and above. Exceptionsto connections can be made on the edge of networkwhere objects can be connected to other side of networklike it has been done in the Figure 1 or connectors can beleft floating. If connectors are left floating, only one ofsending and receiving connectors can be left floating inorder to ensure individual object's proper function. Theserequirements enables individual objects to be operable butin order to maintain network operations other requirementshave to be taken into account as well.Objects Addressing and Data TransmissionEach object has an individual address that also indicatesobject's position in the communication network. The addressis divided into two parts: row address and columnaddress. In Figure 1, rows are organized horizontally andcolumns vertically. Addresses are formed this way to helpfinding objects in rows and columns. Column and row addressesincrease to right and downwards. The number ofaddress bits depends on how many objects are needed inapplication and how objects are placed in the network. Ifthere is much more columns than row or vice versa longeraddresses are needed than total number of objects wouldrequire.The data from one object to another is transferred in packets.All objects send packets to adjacent object in row orcolumn. Objects can also supply packets in between sendingobject and receiving object therefore objects doesn'thave to be right next to each other to be able to communicate.In every object that supplies packets to other objectsthe packet address is read and according to packet addressobject sends the packet to next object in column or in row.If packet's row address is the same as object's row addressthe object sends the packet in row. Same operation happenswhen column addresses are the same. If the packet addressis totally different compared to object's address the packetwill be sent to next object in row. This means that packetfirst finds the right column and when it is on the right columnit finds the right row. Therefore it is important to makesure that packet can't end up circulating in a row that isshorter than other rows and therefore all the columns can'tbe found.If one of the object's sending connectors is left floating objecthas only one alternative in which direction to send thepacket therefore it doesn't matter what is the address in thepacket. In order to ensure transmission to all objects it isinevitable to make sure that not too many connectors areleft floating. Easiest way to confirm this is to connect allconnectors or check that all objects can be reached by movingfrom one object to another right or downwards.Packet consists three different parts: receiver's address,time-to-live bits and data. Time-to-live bits ensure thatpacket doesn't circulate in network indefinitely if none ofthe objects receive the packet. Every time a packet passesan object packet's time-to-live value is reduced by one. Ifvalue of time-to-live bits goes to zero transmission of thepacket is terminated. The number of time-to-live bits dependson the number of objects because the initial value oftime-to-live bits has to be larger than number of objects inlongest transmission chain in network. The longest transmissionchain is usually between objects that locate in oppositecorners of network.As object can receive packets from two directions and startdata transmission itself at the same time there has to bebuffer to make sure that packets would not get lost even ifobject can't send packets at the same phase as it receivesthem. All the packets that are received and will be suppliedto next object goes to buffer to wait transmission. When thetransmitting part has completed previous transmission nextdata packet goes to transmission and the object sends thepacket to next object. Buffer size and means to avoid bufferoverflows are highly application dependent and are thereforeignored in this paper.Adding New Objects to the NetworkNew objects can be added to network without any changesto overall structure. If the network remain square shapedafter adding new objects connections between objects arelike is demonstrated in Figure 1. To maintain square shape,full rows and columns should be added to network. In somecases, adding individual objects to network could be neededand shape of network will become other than square. Innetwork that is not square shaped, special attention has tobe paid on ensuring communication. In some cases, row orcolumn connector has to be left floating. For example, if a106
ow is shorter than other rows the last object in the rowcan't be connected to the first object in the same row becausefrom this row it is impossible to reach all requiredcolumns. To get rid of this situation, row's last object's rowconnector is not connected. This forces a packet to changerow to a longer row, where it can find all the columns.After physical connection, new objects have to be configured.As required FPGAs are based on SRAM (Static RandomAccess Memory) technology, some kind of bootingdevice is required. Booting device or configuration devicebasically contains configuration data and configures FPGAafter power is turned on. Every reconfigurable smart objectshould contain at least one configuration device or nonvolatileconfiguration memory inside the FPGA. If the configurationmemory is inside the FPGA, accessing the memoryoutside the FPGA should, however, be possible. Copyingconfiguration is being performed by copying configurationdata from one configuration device to another. Thecopying is controlled by the object that has already beenconfigured. So objects don’t actually configure adjacentobjects but give them the configuration data that is beingused in configuration.Although, objects that are not next to each other cancommunicate with each other, they can't copy theirconfiguration to non-adjacent object. Configuration data isbeing transferred from one object to another serially, not inpackets like other data. This is why there has to be directwire between two objects when copying configuration. Tomaintain simple connections only adjacent objects areconnected with these direct wires. This sets limitations, ifthere is different kind of configurations needed and adjacentobject doesn't happen to have needed configuration. Someother means to transfer configuration data is needed. Onepossible way to do this is to include all configurations a partthat enables objects to change their configuration data bythem selves. After this is done, new configuration data canbe sent in data packets to any object. On the other hand,transferring configuration data in packets requires thatobject must be configured to receive packets before it canreceive configuration data from network.After the new object has been configured it notifies that ithas no address. It asks address from objects on the left andabove and both these objects give address to new object. Inpractice, acknowledgement signals are used to inform adjacentobjects that an address is needed. When an object notifiesthat its acknowledgement signal is asserted even thoughit is not sending data, it knows that an adjacent object needsan address. The new address is calculated based on theirown addresses. If network is properly organized both objectsgive the same address. This is one of the reasons whyaddress is separated in row and column addresses and whyaddresses are organized from lowest to highest.Spreading the Configuration Data over the NetworkWhen new objects are attached to the network, adjacentobjects copy their configuration data to new objects and sonew objects become functional without external control.There might be also situations when configuration of allobjects has to be modified and new configuration data hasto spread around entire network. In this case, at least oneobject has to be configured externally of the network,because required configuration doesn't exist in the network.After the first object has been configured the copying ofconfiguration data to adjacent objects can start. Spreadingthe configuration data efficiently and fast is important. Ifobjects are configured one after the other it takes long timeto configure all objects, because configuring even oneobject takes few seconds. At least, when using flashmemory to store configuration data, even erasing content offlash takes few seconds.Configuration time can be reduced by allowing one objectto copy its configuration to more than one object. Sincecopying of configuration has to be carried out with sameconnections than communication one object has only twoobject that it can configure. This limits the total time ofconfiguration but keeps the connections simple. Figure 2shows in which order configurations have to be made inorder to attain optimal total configuration time. The numbersin Figure 2 indicates simultaneous configurations. Forexample, all configurations that are marked with number 4occur at the same time. As we can see configuring networkwhich has 16 objects takes 6 times longer period of timethan configuring one object.Figure 2. Configuration of entire network.Time of configuration can be estimated by equationTtot 2 Tobj ! Nobj1"# $ % , (1)where T tot is time of configuring entire network, T obj time ofconfiguring one object and N obj is the number of objects inthe network.EXPERIMENTAL DESIGN ON FPGAIn order to verify proper function of a communication networkan experimental implementation has been done. The107
Altera Quartus II v7.2SP3 FPGA software was used to implementthe logic design and configure FPGAs. Entire digitallogic was coded in VHDL and one Altera's IntellectualProperty (IP) function was used. At the first stage of design,two Altera DE2 Development and Education boards wereused to verify design. Later, two macro models of objectswere made.Properties of Experimental DesignIn the experimental design, all the required functions weredesigned and tested but the function had to be controlled bythe user. In small smart objects, all functions have to beautomated but at this point of development only separatedfunctions were tested. For example, user has to give commandsto one of the objects to start communication or tostart copying configuration to another object. Objects havefive basic functions: Object can receive its own addressfrom user because first object in the network can't get addressfrom other object. Object can give address to adjacentobject when needed. It can send and receive data and copyits configuration to adjacent object. Besides these five functionsobjects also need to read the data it receives in orderto decide whether the data is meant for this object or tosome other object. If the data is meant for some other objectthe data has to be transferred to next object on the right orbelow. Supplying data to other objects have to be automated.All of these functions can be tested on developmentboards except copying configuration because of restrictionsof HW implementation of the board. In order to test configurationtransfer objects configuration device should beaccessed directly via IO-pins which is not allowed in thedevelopment board. This developed experimental macromodel of small smart object is used to test and verify thecopy operation of configuration data from one object toanother.FPGA Resource UsageThe number of resources the object needs is important figureconsidering how small object could be. On both Altera'sFPGA circuits (2C35 on development board and 1C6 onmodel object) that were used design used 1321 logic elements(LE) and 2048 Random Access Memory (RAM) bits.Although only 2048 bits were needed entire 4 Mb memoryblock had to be used. On this point of view using one bit ofmemory requires just as much resources as using 4 Mb ofmemory. In reality implementing memory using LEs insteadof memory block is reasonable if required memory isvery small. Cyclone FPGA's basic logic element consists ofa 4-input LUT and a D-flip-flop register. The experimentaldesign needed 1197 4-input LUTs and 780 registers. Theused silicon area could be estimated by estimating the areathat ASIC design would require and considering thatFPGA’s area is as much as 20 to 40 times that. On the otherhand, commercial FPGA devices always comes in discretesizes so there are always some left over resources on FPGAcircuits and the final physical size of the implementation isdetermined by the dimensions of the selected FPGA device.[1, 2]Test benchThe communication was tested using development boardsand macro model of a small smart object. The networkproperties were tested on development board, which enabledimplementing 16 objects on same board. On VHDLdesign object formed a component and, at top level entity,there were 16 components connected together. This testingstructure helped testing the data packet routing becauseonly one FPGA was needed. The entire testing structureincluded also one object on separate FPGA because testingobjects that locate on same FPGA doesn't take in to account,that different objects should have asynchronousclock signals.All communicational properties were tested on developmentboards so only thing that needed to be tested on objectsmacro model was copying of configuration. The object'smodels were build in a way that one object was directlyconnected to another objects configuration device soconfiguration could be copied from one object to another.Also communication was tested with model objects butusing only two objects it was impossible to test data packetrouting like it was done with development boards.Both testing structures verified the design to work properly.Although test cases that contains thousands objects and lotof data transferring might reveal some things that need to berevised.CONCLUSIONSmall electronic devices that can be integrated to all kind ofstructures will draw lot of attention in the future. Devicesthat are available every where but don’t need any attentionfrom the user are easy to use. One of these applications isintelligent fabric which could be formed by making verydense network of these devices.This paper introduces a network structure that allows smallsmart objects to co-operate. Objects are able to communicatewith each other and copy their configuration to adjacentobjects. Co-operation is probably the most importantproperty of small smart object because objects are so smallthat instead of having all important properties on their ownthey co-operate and function together like bigger and wellequippeddevice. Ability to copy configuration to adjacentobjects increases networks autonomy and decreases need ofmaintenance. Even if there is lot of objects only one has tobe configured by the user and the rest is left for network. Inthe case, when multiple different configurations are needed,each one of these configurations has to be configured tonetwork at least once.Building an invisible device which in this paper is consideredto be smaller than 200 μm in diameter is impossiblewith present technology. In the future it might be possibleeven with CMOS technology but considering even smallerdevices; it is obvious that some different technology isneeded.108
ACKNOWLWDGEMENTWe would like to thank Altera's University Program for thedonation of development boards and devices used in thisproject.REFERENCES1.Altera Corporation. Cyclone Architecture v1.6, May 20082.Altera Quartus II v7.2 SP33.www.altera.com (reading date 27 th May 2008)4.A. Cavalcanti, B. Shirinzadeh, T. Hogg, J.A. Smith“Hardware Architecture for Nanorobot Application inCancer Therapy”, IEEE-RAS ICAR Int’l Conf. OnAdvanced Robotics, Jeju, Korea, pp. 200-205, August2007.5.Gordon E. Moore ”Cramming more components ontointegrated circuits”, Electronics Magazine 19 April 1965:URL: http://www.intel.com6.International Technology Roadmap for Semiconductors –2007 Edition Executive summary7.Ian Kuon, Jonathan Rose, ”Measuring the Gap betweenFPGAs and ASICs”, International Symposium on FieldProgrammable Gate Arrays (FPGA), Monterey, CA,2008, pp 149-158.109
Using smart objects as the buildings blocks of pervasiveawareness applicationsAchilles KameasHellenic Open University &Computer Technology InstitutePatras, Greecekameas@{eap, cti}.grABSTRACTAwareness systems are a class of computer mediatedcommunication systems that help individuals or groupsbuild and maintain a peripheral awareness of each other.Traditionally awareness systems have been studied at theworkplace, with awareness of co-workers being a usefulby-product of rich media interconnections between them.Awareness systems for informal social use are still in theirinfancy as a technology and as a research area. Suchsystems promise to address pressing social problems:elderly living alone, families living apart for large parts ofthe working week, monitoring the well being of an illrelative, etc. The ASTRA platform, which is beingdeveloped in the context of the EU research projectASTRA, provides a generalized solution to thedevelopment of awareness applications that are based onthe concept of pervasive awareness, i.e., where awarenessinformation is automatically generated as a result of usingpersonal and home devices and smart objects, whichcapture and exchange information about the user semiautonomously.In this paper, we shall present how smartobjects in a person’s environment can be used to captureand convey awareness information under this person’scontrol.Author keywordsUbiquitous computing, smart objects, awareness systems,service oriented architectureINTRODUCTIONPervasive awareness systems are a class of computermediated communication systems that help individuals orgroups build and maintain a peripheral awareness of eachother. Traditionally awareness systems have been studied atthe workplace [2], with awareness of co-workers being auseful by-product of rich media interconnections betweenCopyright is held by the authors.<strong>UbiComp</strong> '08 Workshop September 21st, 2008them. Awareness systems for informal social use are still intheir infancy as a technology and as a research area. Suchsystems promise to address pressing social problems:elderly living alone, families living apart for large parts ofthe working week, monitoring the well being of an illrelative, etc. [8]An approach for conceptualization of awareness systems inthe current domain research proposes the description of theawareness in reference of the activities that a person ismade aware of [13]. Based on this approach, Metaxas andMarkopoulos [3] introduced an abstract formal model ofawareness systems that incorporates related concepts andsupports reasoning regarding social aspects of usingawareness systems. Their model draws the basic notions offocus and nimbus by the work of Rodden et al. [12], whoapplied them in a spatial model of group interaction, inorder to address mutual levels of awareness within a virtualenvironment. Early works in the domain of informal socialcommunication like the concepts developed by thePresence project [6] or the Casablanca project [7] werecreated as installations that users could use as they were.The ASTRA platform, which is being developed in thecontext of the EU research project ASTRA [1], provides ageneralized solution to the development of awarenessapplications that are based on the concept of pervasiveawareness, i.e., where awareness information isautomatically generated as a result of using personal andhome devices and smart objects, which capture andexchange information about the user semi-autonomously.The ASTRA platform and the assorted end-user toolsimplement the principles of Theory of Connectedness, anextension to the focus - nimbus model. Briefly, focusrepresents a sub-space within which a person focuses theirattention, while nimbus represents a sub-space acrosswhich a person makes their activity available to others.In this paper, we shall present how smart objects in aperson’s environment can be used to capture and conveyawareness information under this person’s control. In thenext section, we shall give the basic approach and notionswe use in order to represent the problem domain. Then, weshall describe how the solution to the problem is supportwith ubiquitous computing technology and provide anexample scenario using the proposed technology.110
BASIC MODELLING FRAMEWORKIn order to support the development of awarenessapplications, we consider that people conduct theiractivities within an ambient intelligence space using smartobjects and that it is possible to access and combine theservices offered by these objects. Our approach is based onthe following concepts (Figure 1):! AmI space: An AmI space is to a physical space thesame as to that what an artifact is to an object. To bemore precise, an AmI space embeds sensing, actuating,processing and networking infrastructure in a physical(usually closed) space and offers a set of digitalservices.! Artifacts: An artifact is a tangible object augmentedwith computation and communication capabilities. Itsproperties and services are digitally expressed.! Services: These are offered by an artifact or the AmIspace. They could be considered as virtual artifacts.! Ambient Ecology: It is the set of artifacts contained inan AmI spaces and services offered therein; artifactsmay be connected, thus offering more complexservices.! Plugs: They are the interface of an artifact andconstitute an expression of its properties, capabilitiesand services recognizable by other artifacts or services.! Synapses: They are associations between twocompatible plugs. When a property of a source artifactchanges, the new value is propagated through thesynapse to the target artifact. The initial change ofvalue caused by a state transition of the source artifactcauses finally a state transition to the target artifact. Inthat way, synapses are a realization of the functionalcontext of the artifact.! Spheres: An activity sphere is deployed over theAmbient Ecology of an AmI space and uses itsresources (artifacts, networks, services etc) to serve aspecific goal of its owner. It usually consists of a set ofinterrelated tasks; the sphere contains models of thesetasks and their interaction. The sphere instantiates thetask models within the specific context composed bythe capabilities and services of the container AmIspace and its contained artifacts. In this way, itsupports the realization of concrete tasks.AN EXAMPLE OF AMBIENT ECOLOGIESConsider the following scenario:Students of the Distance Education University (DEU)usually live in disparate locations all over the country. Eachof them has his personal matters, but they all have incommon their studies at DEU. Punch and Judy are twostudents of the “Software Design” Teaching Unit; in thepast week they have been collaborating in order to studyand submit a common project.Punch is 33 years old, single, working hard andovercommitted. He lives in Athens and likes technologyand is keen on using new gadgets he discovers in the shops.Judy is a 27-year old single woman, who lives in a smallapartment in Santorini. She is a travel agent, likes naturalproducts and dislikes technology. Both have installed intheir smart homes an Ambient Ecology to support theirstudy.Figure 1. The concepts of artifact, plug and synapsePunch’s Study sphere consists of the following artifacts:eBook, eChair, eDeskLamp and eDesk. The eDesk cansense light intensity, temperature, weight on it, andproximity of a chair. The eChair can tell whether someonewas sitting on it. The eDeskLamps can remotely be turnedon and off. The eBook can tell whether it is open or closedand determine the amount of light that falls on it. Collectiveartifact operation is accomplished by establishing synapsesbetween the constituent artifacts, in order to realize thefollowing behavior:When this CHAIR is NEAR the DESKANDANY BOOK is ON the DESK,ANDSOMEONE is sitting on the CHAIRANDThe BOOK is OPENTHENTURN the LAMP ON.On the contrary, Judy’s sphere is rather simple and onlyuses the services of an eClock, an eLamp and aPictureFrame. Whenever she starts her study, she sets theeClock timer to 90’ and connects it to the eLamp; after 90’,the eClock alarm goes off (without making any sound, ofcourse) and forces the eLamp to flash two times, via theirsynapse.AWARENESS SYSTEM AND APPLICATIONSThe purpose of an awareness application is to convey aperson’s condition, need or want to a community of userswho have subscribed to this application. Usually, anawareness application is developed by a person, whosubsequently publishes it to a community, or invites peopleto subscribe to it.111
To the ambient ecology concepts described above we addtwo basic concepts that originate from modeling ofawareness:! Focus: A person’s focus is the set of conditions,situations or events that this person is interested in. Aperson’s focus may include another person’s nimbus. Itis modeled as a set of events that happen in thisperson’s AmI space.! Nimbus: A person’s nimbus is the set of conditions,situations or events that this person makes public, i.e.makes them available to become part of some otherpersons’ focus. A person may interact with his nimbusby causing events in his AmI space.Consider a very simple example. Suppose that Punch everynow and then likes to go to the local pub, particularly whenhe doesn’t feel like studying, but he hates going out alone.So he has created a simple awareness application that hecalls “out to the pub” and he has invited his friends to jointhis application.An awareness application can be considered as a set ofconditions and events that convey specific meaning to adefined community of persons. So, regarding the “out tothe pub” application. Punch has created some rules whichsignify when he wants to activate this application; forexample, he wants to go out when he is not studying or notsleeping or not cooking, but he does not want to go outwhen he has company at home. His friends have done thesame; of course, each person can create his own rules thatactivate this application.So, in order to define an awareness application, a personhas to:! Provide a short textual description of the applicationand describe its various instances! Define the conditions that trigger the application – thisis his nimbus! Define the other persons he wants to be aware of thisapplication – they have to include this applications intheir focusSo a community is the set of persons that a person allows tohave access to his nimbus.Note that a person may subscribe to an awarenessapplication published by another person. In this case, hehas to include this application to his focus.Based on this framework, we then describe a ubiquitouscomputing awareness application as an activity sphere,which is instantiated on the ambient ecologies in thedifferent AmI spaces of the various application users [14].Each instantiation makes use of the different resources ineach AmI space and of the artifacts in each ambientecology and is realized as a set of synapses between theartifacts and the provided services into the AmI space. Inorder to manipulate their focus, nimbus and awarenessapplications, people use the artifacts in the AmI space.ASTRA SYSTEMIn order to support the realization of ubiquitous awarenessapplications, we have developed a two-tier architecture inwhich:! A centralized remote server is used to store theawareness application descriptions and the communityprofiles, and! Local (user) servers are used to support theinstantiation of focus and nimbus.ASTRA serverThe ASTRA server runs the ASTRA platform, whichprovides different end-user services and is responsible forintegrating system services, such as ontology manager andservice discovery. The platform adopts a Service OrientedArchitecture (SOA) and makes its resources available asindependent services that can be accessed withoutknowledge of their underlying platform implementation.The platform offers:! Awareness services: These services provide awarenessinformation and are built on the services at the lowerlevel.! Collaborative services: These services are providingabstractions that are relevant to the users when they aredeveloping awareness applications, such as users,communities, and places.! Technical services: These services are necessary tosupport, e.g. the discovery and composition ofservices, both at run time and during end userdevelopment.The ASTRA platform uses TCP/IP networking and WebService interfaces for the SOA components. A open-sourceOSGi implementation called Knopflerfish was chosen forASTRA. OSGi was chosen due to its very elegant and easyway of deploying services.The Awareness Manager supports users in controllingincoming and outgoing awareness information (i.e. theirfocus and nimbus). It is based on a realization of thepublish/subscribe model [5]. People who subscribe to thesame awareness application are regarded as a virtualcommunity. When an event is published by a peer in thecommunity, all the other subscribers are notified.The Community Manager provides representation andmanagement of communities of users of awarenessapplications. This module stores centrally informationabout the addresses and profiles of the communitymembers, and directly cooperates with aAwarenessManager.112
Local subsystemThe local subsystem is built upon GAS and uses GAS-OSas the supporting middleware. We have designed theGadgetware Architectural Style (GAS) as a genericarchitectural style for activity spheres [10]. GAS adopts theprinciples of software component technology and serviceoriented architectures and applies these to the domain ofubiquitous computing, in order to describe the processwhereby people configure and use complex collections ofinteracting artifacts [8]. Thus, a component in theubiquitous computing domain is an artifact, physical ordigital, which is independently built and delivered as anautonomous functional unit that offers interfaces by whichit can be connected with other components to compose alarger system, without compromising its shape orfunctionality. The above definition emphasizes the fact thatany sphere component provides its functionality in the formof well-defined services; these are accessible via interfaces.Each artifact in a person’s AmI space runs the GAS-OSmiddleware [3]. This enables the discovery of artifactservices by the end-user tools and their composition in thecontext of awareness applications. The GAS-OSmiddleware provides ubiquitous computing applicationdesigners and developers with a runtime environment thatcan execute the activity task models, as they areinstantiated on the artifacts that exist in a specific AmIspace. It provides the necessary communication layer aswell as the abstraction layer (interaction model) thatenables an artifact to collaborate with other artifacts andtake part in activity spheres [4].An ASTRA user has to define how his focus and nimbuswill be realized within an AmI space. For example, Punchhas to describe the rules that trigger the awarenessapplication “out to the pub” and also those rules that helpthe local system deduce his current condition. These rulesare defined using the services and states of artifacts in theAmI space. So, Punch could define a rule stating that“when I am not working and it is Sunday evening and Iswitch my TV set off, then I want to go to the pub”. Theinformation necessary for the system to evaluate this rulecan be gathered as follows:! Not working: this information describes Punch’scurrent condition; it can be received from a central“point of intelligence” in the house, or deduced as aresult of a different set of rules, the description ofwhich lies outside the scope of this paper! Sunday morning: this piece of context refers to timeand can be received from a calendar service of the AmIspace! TV set off: this other piece of context can be directlyretrieved from the artifact TV set, which is part of theambient ecology in Punch’s homeWhen this rule fires, then an event is sent by the localASTRA subsystem to the ASTRA server. This event isassociated with the “out to the pub” awareness applicationand is propagated to all of its subscribers by the AwarenessManager.In a similar manner, Punch can define rules describing howhe wants to be notified of events that are caused by theother subscribers in the “out to the pub” application.Examples of such rules are: “when I am in the living room,and the TV set is on display a message on the TV screen,otherwise flash the floor lamp twice”, or “when I am in thekitchen, show message in the photo frame”, etc.Using the GAS approach, people can define their focus ornimbus using artifact combinations. In GAS terms, thismeans that the system or the user has to look for theartifacts that have properties matching the taskrequirements, select the most appropriate ones and combinethe respective plugs into functioning synapses. In the aboveexample, Punch has to create a synapse between the dayplug of an artifact calendar and the on/off plug of the TVset.ASTRA toolsThe ASTRA end user tools use a web interface and connectto the ASTRA platform via a specific API. The toolssupport user management, rule editing, and applicationmanagement, in a way that semantically relates to the focus/ nimbus model, albeit using of a more familiar terminologyfor end users (Figure 2).The SOAP protocol has been chosen for communicationand data exchange between ASTRA tools and ASTRAplatform. SOAP is a simple XML based protocol to letapplications exchange information over HTTP. It is anopen standard maintained by the World Wide WebConsortium – W3C. ASTRA tools implement a SOAPclient using PHP SOAP extension. The ASTRA platformexports its methods as SOAP web services. The toolsinterface is written in XHTML 1.0 Strict, a W3CRecommendation that is compatible with HTML 4.01 andit is supported by all modern web browsers.The tools contain the following interlinked modes:Awareness Connections manager (where the user candefine their Focus or Nimbus), Pervasive Applicationmanager (where the user can associate their awarenessfocus or nimbus to a ubiquitous awareness application), andUser and Communities manager.The approach taken in the ASTRA project, when scaled up,has the risk of imposing a heavy semantic load to the user,as he will have to be able to distinguish between variousnotifications that he will receive and interpret correctly thedifferent events they represent. An obvious solution to thisis to use the screens that are available in the ambientecology (i.e. TV set, mobile, PDA etc) to displaysemantically rich textual messages, or to use voicesynthesis to explain the meaning of the notification. Boththese approaches, however, are intrusive, in the sense thatthey will require the person to shift his attention to the113
event. A more complicated approach that we are lookinginto in the project is to use ontologies to create semanticallyrich descriptions of events and services and then use userdefinedpolicies to deal with conflicts of eventinterpretation. For example, when the notifications for twoevents from different awareness applications are similar,then more detailed information has to be conveyed, so asthe person can distinguish between them.Figure 2. Sample ASTRA end user toolsAN EXAMPLE AMBIENT AWARENESS APPLICATIONNow we shall develop the previous example, so as to usethe ambient ecology to convey awareness information:DEU offers to its students a set of services in order toimprove their communication and collaboration, but alsoaiming to create among them the sense of a community.These services include a forum for exchanging ideas, e-mail accounts and access to teleconferencing facilities.However, these services are hardly a match for the need ofstudents to feel everyday that they are part of a community,that they are not alone in their endeavor. Recently, DEU isoffering an awareness service based on the ASTRAplatform for a trial period of one academic year to thestudent of one specific teaching unit. The ASTRA platformenables subscribed users to form communities and toexchange awareness information and applications betweenthe members of a community.Punch and Judy have taken advantage of the new DEUservice (of course, it was Punch who had the idea; hemanaged to convince Judy by promising that he wouldconfigure her side of the application as well as his). So,Punch created a DEU Study awareness application andJudy subscribed to it. Punch included in his Nimbus theNow Reading state of his sphere and Focused his system onJudy’s Reading state. On the other hand, Judy included inher Nimbus the state of her eClock and her PictureFrame;her Focus was set on Punch’s Now Reading state.In Punch’s side, whenever he turns on his Study sphere, ashis eLamp is switched on, his awareness system sets thevalue of his Now Reading state in his Nimbus. The ASTRAsystem communicates Punch’s Nimbus to Judy. Judy hasFocused on Punch’s Now Reading state, and has connectedit to her PictureFrame; whenever it changes, her eLampflashes and Punch’s picture appears. In parallel, as Punchhas set his Focus on Judy’s Reading state, whenever shetakes a break (as a result of her eClock’s timer reachingzero), his eLamp flashes. Figure 3 shows the awarenesssystem described in the example.CONCLUSIONSIn this paper, we have presented a novel service orientedarchitecture that supports the composition and managementof ubiquitous computing awareness applications. The aimof this class of applications is to support communicationamong people without interfering with their task-at-hand.The architecture presented uses smart objects in theperson’s space as conveyors of this person’s awarenesscondition or want. The person can configure these objectsusing special end user tools, which support the discovery ofartifact services and their combination in a simple way, aswell as the definition of awareness applications using firstorderlogic rules on these services.A two tier system has been developed to support thisservice: in the person’s local space, interaction amongsmart objects is achieved with the use of GAS principles;these allow the integration of artifacts running specializedmiddleware GAS-OS, or other commonly availablesystems, such as UPnP. In the server side, the specializedASTRA platform was developed, which offers services forthe management of applications and user communities.Research on ASTRA project continues in order to evaluateand improve the concepts and tools presented in the paper.ACKNOWLEDGEMENTThe described work has been partially supported by EUFP6 IST STREP project ASTRA (Awareness Services andSystems – Towards theory and ReAlization), under Grantagreement No. 29266.114
REFERENCES1. ASTRA IST/FET Open project, available inhttp://www.astra-project.net/2. Dourish, P. and Belloti, V., Awareness andCoordination in Shared Workspaces. In Proc. CHI 92.3. Drossos, N., Goumopoulos, C., and Kameas, A., Aconceptual model and the supporting middleware forcomposing ubiquitous computing applications. Journalof Ubiquitous Computing and Intelligence, AmericanScientific Publishers, 1(2), 1-13.4. Drossos, N. and Kameas, A., Building composeablesmart objects. In Proc. DIPSO 2007.5. Eugster, P., Felber, P., Guerraoui, R. and Kermarrec, A.,The many faces of publish/subscribe. ACM Computing.Surveys, 35, 114–131.6. Gaver, W. and Hooker, B., The Presence Project.London, RCA: CRD Publishing7. Hindus, D., Mainwaring, S. D., Leduc, N., Hagström,A. E., and Bayley, O., Casablanca: designing socialcommunication devices for the home. In Proc. CHI 01.8. IJsselsteijn, W.A., van Baren, J., and van Lanen, F.,Staying in touch: Social presence and connectednessthrough synchronous and asynchronous communicationmedia. In Proc. HCII 2003 volume 2.9. Kameas, A., Bellis, S., Mavrommati, I., Delaney, K.,Colley, M., and Pounds-Cornish, A., An Architecturethat Treats Everyday Objects as CommunicatingTangible Components. In Proc. PerCom03.10.Kameas, A., Mavrommati, I. and Markopoulos, P.,Computing in tangible: using artifacts as components ofAmbient Intelligent Environments. In Riva, G.,Vatalaro, F., Davide, F. and Alcaniz, M. (eds) AmbientIntelligence, IOS Press, 121-142.11.Metaxas, G., and Markopoulos, P., Aware of what? Aformal model of Awareness Systems that extends thefocus-nimbus model. In Proc. EIS 2007.12.Rodden, T., Populating the Application: A Model ofAwareness for Cooperative Applications. In Proc.CSCW 1996.13.Schmidt, K., The problem with “awareness”:Introductory remarks on “awareness in CSCW”. InProc. CSCW 2002.14.Zaharakis I. D. and Kameas A. D., EmergentPhenomena in AmI Spaces”. The EASST Newsletter,Volume 12 (March 2006 / No. 2006 - 12), pp. 82-96.EASST e.V.Figure 3. The awareness system of the example115
Multi-Tracker: Interactive Smart Object for AdvancedCollaborative EnvironmentSujin Ko * , JunSeok Park † , Jaeseon Hwang * , Jun Park † , Hyuk Lim * and JongWon Kim ** School of Information & Mechatronics, Gwangju Institute of Science & Technology, Gwangju, Korea† Dept. of Computer Science, HongIk University, Seoul, Korea* {sjko, jshwang, hlim, and jongwon}@gist.ac.kr† waterspark@mail.hongik.ac.kr and jpark@hongik.ac.krABSTRACTThis paper introduces a Multi-Tracker which is a nicknameof multi-tracking system as a smart object for advancedcollaborative environment. This Multi-Tracker improvesfunctionalities of infrared laser pointers by embeddinglocation tracking sensors. Whoever uses this pointer can betracked his location and interfaces with a collaborationsystem in a room-based meeting space. The informationfrom the Multi-Tracker is used to provide suitable servicesto each user. We show the usability of this Multi-Tracker bydesigning a few interaction services and adopting this to acollaboration prototype system.Author KeywordsMulti-Tracker, Multi-tracking system, Smart object, SMeetAdvanced Collaborative Environment, Location Tracking,Pointer Tracking, Context-aware based User Interaction,Interaction Manager.ACM Classification KeywordsH5.m. Information interfaces and presentation (e.g., HCI):Miscellaneous.INTRODUCTIONAs Mark Weiser first introduced the term "ubiquitouscomputing" [1], ubiquitous computing environment hasbeen characterized by distributed device networks, humancenteredmulti-modal interaction, unobtrusive hardwaresuch like smart devices, sensors and support of contextawarebased services. For the realization of Mark Weiser'svision, we let everyday objects have embedded processorswhich can sense, monitor and track some environmentalstatus and communicate among others. By doing this, theseobjects support people without their awareness of detailtechnologies and we call them as smart objects.Copyright is held by the author/owner(s).<strong>UbiComp</strong> '08 Workshop September 21st, 2008This position paper is not an official publication of <strong>UbiComp</strong> '08.Some successful prototypes of smart objects are Media Cup[2] and several Aware Objects in AwareOffice [3] such aschairs, windows and doors. In addition, there are somespecific smart user interfaces as smart objects in iStuff [4]such as iButtons, iMike and iSytlus. All these things areattached some processors or sensors. With these smartobjects, we have a new method to interface with a space.Accordingly, the interaction of ubiquitous computingenvironment can be changed to human-environmentinteraction from human-computer interaction. And finallyinteraction will be extended to among smart objects in anenvironment including human.Especially, we considered advanced meeting environmentwith ubiquitous computing technologies. Meetingcollaboration environment has evolved from the past. At thebeginning, the environment requires just ability tocommunicate with many participants. And nowadays theremote participants can join collaboration by sharing theirvideo/audio data at the same time. In this case, to connectwith remote meeting nodes, computing facilities and userinterfaces for them are required. Traditional keyboards andmice are commonly-used interfaces for this purpose.However, for advanced meeting environment, we ask itsmarter and more realistic than ever; even all members aredistributed over the world, we want to feel as if we are all atthe same time and at the same place.To design smart meeting environment, we have to satisfyusers’ expected quality of experience of collaboration. Forexample, even if we don’t know the stored address andname of a displayed document, we expect to move this to adifferent display system or download it to our storage.Without knowing the exact control method of a camcorder,we simply hope to see the captured video stream at thecorner of a meeting room. For these purposes, we needrather new interface tools different from traditional ones.Thus, multimodal interactions are adopted to allow users tooperate in a natural manner like voice, hand or device-basedgestures, eye-tracking, body-movement [5], as well astraditional text-based or graphic based ones called WIMP(Windows, Icons, Menus, and Pointing) [6].116
Therefore, these multimodal interactions help people freefrom computers during collaboration and increaseefficiency of meeting. Especially for meeting collaboration,pointer-based interaction can be easily used to operate ameeting environment. So, we design a Multi-Tracker whichhas location and pointer tracking functionalities and adoptthis smart object to interface with whole meetingenvironment.Research related to multimodal interaction has been carriedout as a part of Human Computer Interaction (HCI). Forexample, various outputs of Dynamic Graphics Project(DGP) Lab. at University of Toronto such as vision wandand the free-hand-gestures recognition has been produced [7,8]. And for pointer tracking, Kirstein and Müller used alaser pointer as an interaction device [9]. Once laser pointerspot is detected by a camera, the coordinates of the spot inthe display was calculated. They use gesture interactionswith turning on or off the laser pointer. Their workstimulated a lot of research on laser pointer basedinteractions.The rest of this paper is organized as follows. Beforeintroducing the design and implementation of Multi-Tracker,we briefly describe the adopted prototype system targetingadvanced collaborative environment, SMeet (SmartMeeting System). And then we present the InteractionManager of SMeet which can control all user interactionsand collects interaction information from a Multi-Trackerprocessed in an SMeet node and suggest a few interactionservices supported in SMeet by using Multi-Tracker. Theimplementation and operation of these services areFigure 1. An SMeet node with multi-tracking System.explained for feasibility of this Multi-Tracker. Finally, weconclude with evaluation and our future work.SMEET AND SMART OBJECTSOur prototype, Smart Meeting System (SMeet) targets anenvironment which enables users to collaborate with remoteparticipants by using a wide range of devices embedded innetworked meeting rooms [10].To construct one SMeet physical node, we use a set ofdevices such as media devices like microphones, speakers,and cameras, display devices such as plasma displays,projectors, or tiled displays, interaction devices likepointing devices, cyber gloves, location trackers and gyromouse and a number of computing machines. All devicesare connected to wired or wireless LAN, and SMeet nodesare again connected by high-performance WAN (Wide AreaNetwork) [11]. Figure 1 shows an SMeet node with a Multi-Tracker and this Multi-Tracker is used as one interactiondevice. Especially, for provision of tasks or services to users,we have a few functional managers. These are Mediator,Display Manager, Interaction Manager, Media Manager,and ACE Connector. Among them, Interaction Manager(IM) manages and supports suitable tasks for users. For thatpurpose, IM equips several functionalities like supporting ofmultimodal and multi-users interaction and management ofwhole objects of a meeting environment such as severaltypes of displays, storage machines or camcorder [12].Among these objects, some of them can be smart, andothers are not. To interface with them, SMeet uses a Multi-Tracker as an interaction device. Finally, we aim at117
interfacing with whole space, but currently, ourimplementation is limited to interface with a display system.MULTI-TRACKING SYSTEMMain interaction services which SMeet provides are two.The first one is pointing service enables a user to point acertain object in a meeting environment and the second oneis location tracking service tracing users’ position in a space.For provision of these services, we design multi-trackingsystem which is integrated with location and pointertracking functionalities. This system is used to operateinteraction between users and a meeting space.Multi-tracking system has four modules which are Multi-Pointer module, location tracking module, pointer trackingmodule and a tracking server. The Figure 2 shows thestructure of multi-tracking system and the real snapshot ofeach module except tracking server is in the Figure 3.! The Multi-Pointer module: it is bar-type and movabledevice having four interaction buttons and it is thething we want to estimate its location. It periodicallybroadcasts a message on the RF channel and anultrasonic pulse at the same time.! The location tracking module: they are attached to aceiling and all of them measure the time difference ofarrival between a RF message and an ultrasonic signalfrom the Multi-Pointer. Then, they report the timedifference to the tracking server.! Pointer tracking module: it is a camera with narrowband pass filter matched infrared pointer.! Tracking server: it finally calculates the location andthe coordinates of pointed spot with the Multi-Pointerand periodically updates it with collectively gatheredtime differences and communicates with interactionmanager to deliver interaction information.And, Table 1 depicts its specification for user interaction ofSMeet.In this multi-tracking system, there are two essentialtechniques. The first one is pointer tracking method andanother one is location tracking method. Next following twosubsections describe these techniques in detail.Pointer TrackingWe used infrared laser pointers and narrow band-pass filtersof corresponding wavelength. These narrow band-passfilters were installed on the cameras to process spots fromspecific laser pointers. In order to detect users’identification as well as the pointing locations, each userwas given a unique wavelength laser pointer (for example,808nm or 850nm).Figure 2. Structure of multi-tracking system.Figure 3. Modules of multi-tracking system.Cameras for each laser were used for tracking laserpointer’s pointing position. An alternative approach fordistinguishing users with laser pointer may be usingblinking patterns. However, synchronization between thecamera and blinking system may be required. We usedinfrared lasers which are not observable by the users. In thiscase, static error between pointing location and detectedlocation (this occurs due mainly to erroneous calibration)may not be perceived by the users.To calculate the laser pointer’s pointing location in a largedisplay, coordinate transform is required. In order tocalculate necessary parameters for coordinate transform, wemeasured the locations of each corner of the display byplacing infrared LED beacons. These locations in cameraspace with given display’s resolution were used to calculateHomography. The pointing coordinates of display arecalculated with this Homography [13]. We used Zhang’smethod for calculating Homography.In study of Myers and et al, they show the laser pointer’sbeam is too unsteady. Usually the spot of laser pointer isshaken rapidly and chaotic around of the position which auser wants to point while pointing. Some points which areshaken are made acute angles with the previous point. Thesemake a cursor blink and give an incongruity to users. Byignoring the point which makes an acute angle with theprevious one, the cursor can be moved smoothly and usersfeel less incongruous.Location TrackingFor location estimation of a movable Multi-Pointer, anultrasound-based localization is used. Figure 4 showscomponents for location tracking.118
InfraredlaserpointerOpticalFilterInfraredcameraUltrasoundSensorNodeTrackingServer- Infrared laser device for rather brightdisplay- wavelength: 808nm, 850nm- filters which pass only limited spectrumlight for successful recognition of laserpointer- cameras which can track the pointedspot by laser in real time- VGA level resolution- frame rate : more than 29fps- A device for localization, it measures adistance from beacons to mobile nodesby using arrival difference between RFand ultra sound signals.- pointer tracking is with an errortolerance of 30 pixels- location tracking is with an errortolerance of 0.5 mFigure 4. Environment for Location tracking.Table 1. Specification of multi-tracking system.There are a Multi-Pointer, several location tracking motes, acalibration mote, and a tracking server. Especially, it hascalibration mote which is placed on the ground, and it isused to measure the speed of ultrasound in the space foraccurate location estimation.The hardware of this system is a cricket mote [14] based onMICA2 and it transmits messages on RF channel or signals.The software is modified in order to be suitable for oursystem.Distance EstimationThe distance from the Multi-Pointer to each locationtracking module can be obtained by taking the timedifference of arrival between a RF message and anultrasonic pulse.Although the Multi-Pointer simultaneously transmits boththe RF message and the ultrasonic pulse, the time differenceexists because the speed of RF is faster than that ofultrasound. For example, as shown in Figure 5, the RFmessage and the ultrasound reach the location trackingmodule at t 0 and t 1 , respectively, and thus the timedifference is (t 1 -t 0 ). The time difference of arrival isexpressed as follows:d dt = ,v1v 0where t is the time difference of arrival, d is the distance, v 1is the speed of ultrasound, and v 0 is the speed of RF. In thatcase, the speed of RF is very huge, thus the term can benegligible. Consequently, the distance is the time differenceof arrival multiplied by the speed of ultrasound.The speed of ultrasound is affected by the indoorenvironment such as temperature and humidity. The changeFigure 5. The arrival time of an RF message and ultrasound toa location tracking module.of these factors causes inaccuracy of location estimates. Inorder to improve accuracy, we use an auto-calibrationtechnique that automatically measures v 1 using thecalibration mote depending on the indoor environment.Location EstimationThe location of the Multi-Pointer is finally determined by alateration algorithm. The distances between each locationtracking module are calculated by Euclidean distance. Inaddition, we know the distances from the Multi-Pointer toeach location tracking module. With these distances, weestimate the location using the lateration algorithm [15].INTERACTION MANAGER OF SMEETInteraction Manager (IM) is a service manager which ischarged with the controlling all user interactions in SMeet.IM manages all possible target objects of user interactionsin a meeting environment as a “Space Object”. Especially,provided interaction devices such as a Multi-Tracker are asmart object and they are also one of Space Objects inSMeet.Like this, IM collects inputs from heterogeneous interactiondevices, analyzes the contents and helps other outputobjects using this examined data to provide suitableapplications to users. In this case, interaction devices like aMulti-Tracker are a mean to link among Space Objects. Inaddition, when users' information, such as name and role,can be delivered to IM, IM can provide filtered servicesbased on each user's context. Most of all, it is important to119
operate interactions by many participants at the same timefor meeting environment.Figure 6. SW architecture of Interaction Manager.For above functionalities, IM's software structure is likeFigure 6. And this is composed of five parts.! Application/Task Controlling Part: it is main moduleto decide suitable applications for requesting users andhandles flow of applications by referring IM MeetingContext.! Multimodal Input Processing Part: this part is incharge of the connection management of eachinteraction service. And input from differentinteraction devices is decoded in this part also.! Context Processing Part & IM Meeting Context: thispart maintains meeting context downloading frommediator’s Space Repository. IM’s Meeting Context iscomposed of general meeting context and SpaceObject context. It updates and gives this informationwhen required.! Data Adaptation Part: when an application or task forusers is decided, this part is responsible for adaptationof output which is transferred to suitable servicemanagers.! SMeet Interaction GUI: it displays the current statusof meeting environment, especially focusing on SpaceObjects such as users, interaction devices, and outputdevices. For example, it shows users’ location when itis changed, and their current interactive objects. Inlater, this GUI will manage the relationship amongSpace Objects.IMPLEMENTATION OF COLLABORATION SERVICESDesign of ServicesThe information from multi-tracking system is pointedcoordinates and users' position information. By analyzingthis, SMeet offers following three services. Each service hasits own dependency template like {(s name )– sm name – sm name } ,whereSM: set of service managers, S: set of interaction services,sm name SM, s name S.! Interactive-display service: This service is performedrelated to displays in SMeet. When several contentsare displayed over a public display in SMeet, userscan control the contents such as moving to otherdisplay systems, resizing the visually displayedcontents' size, and showing the pointed spot with apersonal pointer image. The relationship amongservice managers of this service is depicted like{(s pointing service ) – sm interaction manager – sm display manager }.When IM understands users’ intention for this service,it can communicate with Display Manager tocomplete this service. This service also can be filtereddepending on the recognized users’ role.! Follow-me-display service: This service makesselected contents to follow the authorized users withMulti-Pointer over displays in a space. In case thereare several displays, the most suitable display can beselected for the contents. This service has relationshipamong service managers like{(s location service ) – sm interaction manager – sm display manager }.This service is provided for only authorized user suchas presenter. So, the user identification should berecognized by IM.! Contents-protection service: during a meeting session,when an unauthorized person enters a meeting node,some protected contents become inactivated. Thisservice has relationship among service managers like{(s location service ) – sm interaction manager – sm display manager }.Implementation of Interaction ServicesInteractive-display serviceA user with a Multi-Pointer can point a specific spot over apublic display, and this pointing action results in showing apersonal arrow image allotted to each person. And movingoperation supports users to locate the visualized media on adisplay to other position of display systems. In this scenario,these pointing and moving operations are allowed for allusers. Lastly, resizing operation can change the displayedsize of media. However, this operation is allowed only forspecific authorized users, such as a presenter. Figure 7 (a)shows the pointing operation with multiple users, andFigure 7 (b) and (c) describe the resizing operation each.Figure 7. Implementation of Interactive-display service.Follow-me-display serviceWhenever an authorized Multi-Pointer user moves, thelocation information is delivered to IM. And then, IM120
decides whether the main displayed contents moves or notas the location of the user. In this scenario, one with apresenter role can be supported by the service. Figure 8 (a)shows the case of an authorized person, and theunauthorized person's case is in Figure 8 (b).Figure 8. Implementation of Follow-me-display service.Contents-protection serviceEach Space Object has its own allowed authorities. Whenunauthorized persons enter, some contents to be protectedshould be hidden. Figure 9 (a) captures the state before anunauthorized person enters, and we can notice the displayedcontents was disappeared for security in Figure 9 (b).Figure 9. Implementation of Contents-protection service.CONCLUSIONIn this paper, we have introduced the design of Multi-Tracker as a smart object to support advanced interactionfor users and to fulfill the users expected QoE. The Multi-Tracker has localization and pointing functionalitiestogether. For verification of this pointer’s functionality, weadopted it to our prototype system, SMeet. Especially,Interaction Manager of SMeet has connection with thismulti-tracking system, collects interaction data and finallyoffers suitable operation for users. Until now, this Multi-Tracker is used for limited applications. However, it canextend its usability to whole environment. In the future, asSMeet provides a framework for supporting extendedinteraction, Multi-Tracker can be used with more variousservices.ACKNOWLEDGMENTSThis research is supported by foundation of ubiquitouscomputing and networking project (UCN) Project, theMinistry of Knowledge Economy (MKE) 21st CenturyFrontier R&D Program in Korea and a result of subprojectUCN 08B3-O2-10M.REFERENCES1. Weiser, M. The Computer for the 21st Century.Scientific American Ubicomp Paper after Sci Amediting, 09, 1991, 66-75.2. M. Beigl, H. W. Gellersen, and A. Schmidt. Media cups:Experience with design and use of computer augmentedeveryday objects. Computer Networks, special Issue onPervasive Computing, 35-4, 2001.3. Zimmer T. and Beigl, M. AwareOffice:IntegratingModular Context-Aware Applications. Proc. of the 6thInternational Workshop on Smart Appliances andWearable Computing (IWSAWC). IEEE ComputerSociety Press, 2006.4. Ballagas, R. et al. istuff: A physical user interface toolkitfor ubiquitous computing environments, Proc. of ACMConference on Human Factors in Computing Systems(CHI 2003), 537–544, 2003.5. Cohen, P. et al. Quickset: Multimodal interaction fordistributed applications. Proc. of the Fifth ACM.International Multimedia Conference (New York, NY)ACM Press, 1997, 31-40.6. Zhu, Z. and Wang, J. Multi-agent based approach tosupport hci. Proc. of the fifth international Conferenceon Machine Learning and Cybernetics, Aug. 2006, 188–191.7. Cao, X. and Balakrishnan, R. Visionwand: Interactiontechniques for large displays using a passive wandtracked in 3d. Proc. the ACM Symposium on UserInterface Software and Technology (ACM UIST), 2003.8. Vogel, D. and Balakrishnan, R. Distant freehandpointing and clicking on very large high resolutiondisplays. Proc. the ACM Symposium on User InterfaceSoftware and Technology (ACM UIST), 2005.9. Kirstein, C. and Müller, H. Interaction with a ProjectionScreen Using a Camera-Tracked Laser Pointer. Proc. ofThe InternationalConference on Multimedia Modeling.IEEE Computer Society Press, 1998.10.Kim, N. et al. Design of Software Architecture for SmartMeeting Space. Proc. Of IEEE Pervasive Computing2008, 543-547, Mar. 2008.11.Han, S. et al. Design of multi-party meeting system forinteractive collaboration. In Proc. of the IEEE Int. Conf.On Communication System and Software andMiddleware (IEEE COMSWARE 2007), Jan. 2007.12. Ko, S. et al. Design of interaction manager supportingcollaborative display and multimodal interaction foradvanced collaborative environment. Proc. of SPIE,6777, 67770S (2007), Boston, MA.13.Zhang, Z. A flexible new technique for cameracalibration. IEEE Transactions on Pattern Analysis andMachine Intelligence, 22(11):1330-1334, 2000.14.The Cricket Indoor Location System.http://cricket.csail.mit.edu/.15.Nagpal, R. et al. Organizing a Global Coordinate Systemfrom Local Information on an Ad Hoc Sensor Network.In Proc. IPSN 2003.121
An Augmented Book and Its ApplicationKaori Fujinami and Nobuhiro InagawaDepartment of Computer, Information and Communication Sciences,Tokyo University of Agriculture and Technology2-24-16 Naka-cho, Koganei, Tokyo, Japanfujinami@cc.tuat.ac.jpABSTRACTIn this paper, we propose an augmentation of an ordinal bookwith page flipping event detection. Two types of add-on devices,i.e. a book cover and a bookmark version, have beeninvestigated in combination with two accelerometers. Theaugmentation allows a system to provide a reader with valueadded experiences while keeping the original sense of utilizationintact, e.g. a texture of paper. Since it utilizes apaper-based book, the complex copyright issues do not needto be addressed. We have also developed a prototype ofan application: virtual illustration system. It automaticallyprovides multimedia information based on the page that areader is reading. Everyone can publish and share the contentslike an HTML document. The performance of pageflipping detection and the usability of the devices have beenevaluated. The prototype application has also been testedusing real contents.INTRODUCTIONToday, digitally enhanced books are getting available. A typicalfunctionality includes providing multimedia information,e.g. a music clip, a picture, that matches with a scenethat a user is reading [2][5]. This allows a reader to havemore rich experiences than a traditional paper-based bookreading. However, such a digital book is not so popular now,and some manufacturers have decided to withdraw from themarket [9][11].The difficulty in reading a text through Liquid Crystal Display(LCD) for a long period of time and the lack of the textureof paper might be technical reasons. Recent advancementof electronic paper and flexible display technologieswould improve the readability and the sense of page flipping,respectively[6][12]. However, a very advanced VirtualReality technology is still required to provide the sense ofthe weight of the remaining pages. When we read a class ofa book like a mystery, we may implicitly predict the changeof the suspect or the conclusion according to the current positionin the book, which is obtained by the weight/thicknessperception as well as a visual feedback. We consider this isvery important and interesting perspective for the interactionwith a book.Copyright is held by the author/owner(s).<strong>UbiComp</strong>’08 Workshop 4: Design and Integration Principles forSmart Objects (DIPSO 2008), September 21, 2008, Seoul, Korea.More important and critical reason is the complexity of theright to publish an electronic version in Japan. It is not clearwho owns the right: the author, the publisher, etc. In caseof a book based on an animation film, the organization thatholds the copyright of the characters owns the right. Thisprevents the digital version from being created and widelydistributed in the market, which is a fundamental issue in adigital book.To address these issues, we have decided to leverage an ordinalbook. A sensor augmented book cover and a bookmarkhave been investigated to detect a page flipping event andthus to track the current page. This keeps the tactile sensationof a paper-based book intact while providing a readerwith some services based on a page that he/she is reading. Inthis paper, we present the design of two add-on devices andthe algorithm for page flipping event detection. Also, as anapplication, Virtual Illustration System has been developed,and the feasibility has been evaluated using real contents.RELATED WORKIn terms of the interaction with a paper-based document, theDigitalDesk [13] is a pioneering work. EnhancedDesk [7]also seeks the smooth integration of paper and digital informationon a desk. They allow automatic retrieval and presentationof digital information by recognizing the contents[13] or the tag [7] printed on a page, and direct manipulationof digital information by gesture recognition. They are basicallythe augmentation of desk operation, and thus workingarea is exactly restricted to the place of the desk. On thecontrary, our augmentation is done on the book side, whichprovides a user with a certain degree of freedom in workingplace.Regarding contents identification, detecting the reading pageis a relative approach [3, 10], where a content is linked to oneor a range of pages. On the other hand, embedding contentsinto a page allows direct identification using an appropriatedetector [4, 8]. Back et al. augmented a book with RFIDtags and a receiver to provide additional information basedon a page [3]. Also, a reader of the Magic Book [4] sees 3Dcharacters related to the page through a head mounted display.The Interactive Textbook system [8], an application ofEnhancedDesk, literally provides an interactive experiencewith the electronic contents linked to a page. They are realizedby visual tags. Furthermore, a completely new materialof a paper was investigated to detect the bending action bypolymer conductive ink [10]. However, they need specially122
manufactured pages, i.e. redesigning, which makes the costof a book high. It also prevents an existing book from adoptingto an augmented service. An extra device is also requiredin case of the Magic Book, where a reader need to adapt tothe new style of reading a book. In contrast, our systemaims at realizing the page detection in a cost effective mannerand providing a reader with almost the same way of readingan ordinal book. This is enabled by attaching a deviceto a common part of a book, i.e. book cover and bookmark,rather than utilizing special pages or requiring a reader towear special glasses.Designing Add-on Devices for Page Flipping DetectionPage flipping detection is realized in two ways: a book coverand a bookmark versions. An accelerometer has been utilizedto detect the movements of a book cover and a bookmarkevery time a page is flipped. Two accelerometers havebeen attached for each device. One of them is utilized asa reference to avoid confusing the movement of a book itself.The flipping detection algorithm is described in nextsection. Figure 1 shows the devices and their usage scenes.Note that, in the figure, the page is flipped from left to rightthat is a traditional reading way of a Japanese book (readingin vertical way from top to bottom, and from the right sideto the left).WikiTUI [14] is designed to provide bi-directional interactionwith digital contents using Wiki infrastructure. A readercan add and obtain digital annotations based on the pagehe/she is reading. To determine the page, a reader mustspecify the number projected on the table by pointing gesture.This means he/she flips both the actual page and thevirtual page. The page number is correct so far as a readerfollows the flipping rule, however it requires a reader’s attention.We consider it is inadequate for a book like a novelsince a reader likes to concentrate more on reading a text.AUGMENTED BOOKDesign IssuesTwo models of providing multimedia information, i.e. pushand pull, have been considered ahead of the augmentationdesign. We have taken the push based approach, where contentsare provided automatically based on an event. Theevent includes the detection of a visual tag [4, 8], an RFIDtag [3], keywords in a text, etc. In contrast, in the pullmodel, a reader explicitly retrieves contents by pointing gesture[14], for example. We consider that the push model isless interruptive to a reader due to such an automatic nature.Additionally, we have considered that multimedia informationis absolutely supplemental one. So, it would bebetter to provide silently. A textual description added fordetailed explanation might be appropriate for explicit acquisition,which we do not intend to support so far.We aim at identifying contents in a cost effective manner,where neither special paper material nor preparation of tagsis required. We have determined to detect the current pagenumber that a reader is reading and to retrieve correspondingcontents based on some mappings. It is utilized as a keyfor the contents identification. We have had two options regardingthe page number detection. Recognizing the printednumber by a camera is a direct approach, while counting thepage flipping using some sensors is an indirect one. We havetaken the latter approach due to its relatively simple nature.Reading a book at a specific place, e.g. a camera-mounteddesk, might be able to recognize the page number accurately[13], and even automatic contents retrieval might be possibleusing frequent keyword detection, but a reader’s postureis restricted at the same time. A wearable camera solutionallow a reader to be free from such a constraint. But, thecomplexity of the system would get drastically larger.Figure 1. Devices for Page Flipping Detection: a) Book Cover and b)Bookmark TypeWe have developed more than 20 prototypes of the two versionsto find suitable design in the usability and the performanceof the detection, where the size and the sensing positionas well as the material are subject to test. As shown ina), the book cover type is utilized by (1) picking up the insidepart partially covering the reading surface when a readerflips the finished page (2). The inside part of the cover istranslucent so that it could avoid interrupting the reader’sview. Every time a page is flipped, the part is flipped accordinglyto hold the page. Thus, a 3-axes accelerometeris attached there to detect the movement of the inside cover(marked as Sensor-1). Also on the front cover side, the other3-axes accelerometer (Sensor-2) is attached. The material ofthe cover is polyethylene terephthalate (PET) with 0.3 mmthickness, and the “reverse Γ shape” of the inside part wasfinally determined to balance the usability (the readability ofa text and the ease of manipulation) and the detection performance.The flipping detection by the bookmark type is realized bythe movement of a withy prop that holds the pages to read.We have augmented a product called SwanTouch [1]. Whenevera reader flips a new page, the page pushes the beak ofswan forward, and soon the beak goes behind the page due to123
its withy material. So, the movement of the beak representsflipping of a page. One accelerometer is attached on the beak(Sensor-1), while the other is on the back cover (Sensor-2).SwanTouch is made of polypropylene. We have also testedother materials, i.e. an acrylic sheet with 0.5 mm thicknessand a 0.3 mm PET one. Among them, the polypropylene oneperformed best.In the two implementations, the sensor readings are collectedon a PIC microcontroller. Then, they are wirelessly transmittedevery 50 msec to a controlling PC, where the detectionis actually done. Our future implementation will detect theflipping locally (on PIC side), and only the event will besent. Additionally, the accumulated number of page flippingevents are maintained in a persistent storage. So, he/she canresume the reading without flipping the pages from the beginning.Page Flipping Detection AlgorithmWe have applied the same flipping detection technique andconfiguration for the two versions, which utilizes the ratio ofSensor-1 to Sensor-2. Figure 2-(a) and (b) indicate the sensorreadings from Sensor-1 and Sensor-2, respectively. Here,the page flipping with three styles of reading were recorded:horizontal, with a slope, and vertical. The average of thevariances of the three axes (x, y, and z) within a certain window(20 samples, i.e. 1 second) is calculated (c) and thenutilized to obtain the ratio (d). We have adopted the ratiosince we found it difficult to distinguish the actual flippingfrom mere movement of a book itself when only one sensor(Sensor-1) is utilized. The two sensors show the samewaveforms when a book is moved. However, only the insideand the beak parts are actually affected by page flippingin the book cover and bookmark versions, respectively(compare (a) and (b)). The body of a book moves independently.Therefore, we have considered the ratio performswell. Here, Sensor-2 acts as a baseline. To get the final answer,the detection of flipping, a threshold has been specifiedbased on a preliminary experiment. Although the readingstyles are changing continuously and they are apparent inthe sensor readings (a), the ratio-graph becomes pretty clear(d). Note that the vertical axis of (d) is a log-scale. The performanceand the usability of the two add-on devices will beevaluated in the later section.APPLICATION PROTOTYPEVirtual Illustration System: ConceptAs an application of an augmented book, we have developedVistual Illustration System. The system provides areader with multimedia information according to the pagethat he/she is reading. There is an external mapping of oneor a range of pages to the information. Anyone can participateto the process of producing an augmented readingexperience like posting a review of a book onto his/her blog.The copyright issues do not need to be addressed so far as acontents creator follows the traditional copyright rules in apaper-based book. A reader can select his/her preferred onefrom multiple contents for a single book. This is the analogyto a favorite blogger from whom one likes to get information.Also, once he/she purchases the device, it is utilizedFigure 2. Data Plotting of Sensor Readings (a) and (b), Averaged Variance(c), and Log-scaled Ratio of Sensor-1 to 2. “Th” in (d) indicatesthe threshold for flipping detectionfor any contents. We consider this is an evolutional form ofa traditional web system. A web browser provides a userwith an experience on a digital document, while our deviceis for a paper-based document, book.System OverviewThe system consists of an augmented book with a page flippingdetection capability, a book contents description, multimediacontents, ContentsServer, BookServer, and a multimediasystem. The core of the system is the contents descriptionthat maps pages to corresponding multimedia information.Figure 3 illustrates the overall system architecture.They are created by anyone who wish to produce anenhanced book reading experience and uploaded to a ContentsServer(marked (1) and (2) in Figure 3, respectively).The contents, e.g. image and audio, can be stored anywhere.They are specified by unique URLs. We have developed anoriginal contents markup language, eBookML. It contains aset of contents file locators and their controlling informationfor each number of the accumulated events. A controllingentity, BookServer, downloads the contents descriptionthat corresponds to a book when a person starts reading (3).BookServer interprets the description (5), and a multimediasystem is controlled (6) when the condition is satisfied onthe detection of page flipping (4). This is very similar to theweb contents distribution system, where clicking a mouse isanalogous to a page flipping. Here, the number of the pageflipping event is counted so that it can approximate the cur-124
ent page. Exactly speaking, the number does not indicatethe actual page number, but the number of the page flipping.So, the system does not identify whether a reader is readingon the left side or right side.Figure 3. Overall System ArchitectureFigure 4 represents a typical usage scene of the system. Onefull screen image is presented at a time. If more than twopages are assigned to one page flipping event, they appearin turn with an interval specified by a creator. Meanwhile,a black screen is shown if a contents creator does not wantto show any image, otherwise the same image is presenteduntil the next number-contents mapping appears. To providea feedback on the page flipping, the accumulated number offlipping is presented on a display. Also, sound of page flippingis played as an audio feedback. Furthermore, a captionis shown at the bottom of an image so that a reader could fillthe gap between the timing of the presentation and the actualappearance of the corresponding word(s).MethodologyFirst, the performance of the page flipping detection and theusability of the add-on devices have been evaluated. Twelvepeople (10 people are undergraduates and the two are anadult couple in their 50’s) were recruited for these purposes.To assess the intuitiveness of the augmentation, we did nottell them the usage for the first trial (0). Then, they wereinstructed the correct usage and the principles of the pageidentification. Three types of usage have been tested to seethe robustness of the algorithm: (1) horizontal on a desk, (2)with slope on a desk, and (3) in air without any immobileobject. The subjects were told to flip 20 times (40 pages) foreach type. The memorability was also tested. Two of themwere asked to have the test a week to ten days after. They arethe subjects who could not find out the methods without theinstructions in the first trial. Finally, to see the perceived differencefrom traditional paper-based book reading, the subjectswere shown a demo clip and asked the impression ofthe usage of the two devices.The evaluation on the virtual illustration system has beenconducted in this way: the level of acceptance of the systemboth as a user and a contents creator was asked to the samesubjects group as above. Then, three subjects (two of themwere newly recruited.) actually utilized the system with thebookmark version. Here, a travelogue “Kaido-wo Yuku” byRyotaro Shiba has been selected, where the author’s experiencesand random thoughts during a travel along a countrytrail are described. The contents have been created bythe other person based on his preference. The images andsound clips have been found in the Internet. The images includean old and a contemporary maps, an illustration of anold Samurai-battle, a landscape, a novelty animal, etc. Also,the sound clips are about a war whoop, the lapping of wavesagainst the shore, and the sound of a rain shower. After readingsome sections (34 pages), we had a semi-structured interviewsession. Note that all the subjects did not have anyprior knowledge about the places and events described in thebook.Figure 4. Typical Usage Scene of the SystemEVALUATIONWe have evaluated both the augmented book and the virtualillustration system.Results and DiscussionPerformance of Page Flipping DetectionTable 1 shows the detection accuracy. The accuracy of theflipping detection is defined by the ratio of the number ofthe counted pages to the total number of the pages that thesubjects flipped. Standard deviation (The number in the parentheticarea) is also calculated to see the variation in individuals.The averaged accuracy for the book cover and thebookmark version are 88.1% and 92.5% (standard deviationin individuals are 11.4% and 8.3%), respectively. This indicatesthat the bookmark version detects the page flippingtotally well with small variation in individuals. We considerthe reason for the difference is that the book cover has a widerange of motion, which could lead to the variation of utilizationamong individuals. Also, this makes it difficult to detectusing the simple thresholding. Furthermore, the algorithmis robust in that the differences among the three styles aresmall.The case without explanation shows low accuracy and largedeviation. In case of the book cover version, seven subjects125
Table 1. The Performance of Page Flipping DetectionBook Cover Boomark(N=820) (N=960)(0) Without explanation 84.4%(*) (20.3) 21.3% (18.5)(1) Horizontal on a desk 88.7% (8.5) 92.1% (8.5)(2) With a slope on a desk 85.2% (15.4) 91.3% (9.2)(3) In air (above a desk) 90.4% (11.4) 94.2% (8.3)could not find out picking up the cover when they were nottold anything. They just put the flipped pages on the cover.We consider the gesture putting the flipped page under theinside part of the cover was far from natural reading. On thecontrary, in case of the bookmark version, the accuracy isenormously low. This is because none knew the way of flipping,but they continued to read the book anyway. However,once they were instructed, the accuracy and the deviationwere improved. They are easy to learn due to the simplicityand the seamless integration into ordinal book reading.Regarding the memorability, the result shows the accuraciesof the three cases were almost the same as before. We considerthis is because they were told not only the way itself,but the principle of the flipping detection. Also, the physicalappearance of the devices reminded them of the usage.The mis-detection in the bookmark version generally comesfrom the case with which the flipped page goes through thebeak part without large movement. By making the materialof the bookmark harder, the part can firmly hold the page tobe flipped next. Then, the detection might be more accuratedue to the larger bouncing acceleration of the beak. However,at the same time, it would become difficult to flip andsometimes the page might be damaged.The common limitation in both cases is that they do not supportrandom access to the contents. This comes from themethod of identifying the current page. The advantage ofrandom access is that not only it allows a system to knowthe page number that a reader opens suddenly, but also it caneliminate the accumulative errors of the page flipping detection.Although the performance of the detection is high (Table1) and still there is room for improvement, this becomesproblem if the book has large number of pages, i.e. morelikely to make mistakes. Recognizing a page number by avideo camera might remove the barrier although the complexityof the system increases. However, the technologyshould be carefully utilized in a public space since it lookslike a spy camera. We will investigate an extension of thecurrent devices with error correction or page number adjustmentfunctionality while taking into account of the impacton a traditional reading style.Usability of the Add-on DevicesFigure 5 a) indicates the perceived difference from an existingbook (1: very obtrusive, 5: not obtrusive at all). Theproposed devices have been designed to keep the traditionalreading style as much as possible. The subjects felt less obtrusiveagainst the bookmark version than the book coverversion. The bookmark version requests a user to pay attentionto the beak part to some extent, however it has greatadvantage over the book cover version. The beak holds thepage to read the next (Figure 1-(b)), while the flipped page ishold by the book cover (Figure 1-a). This means a reader ofthe book cover version needs to open the cover when he/shewants to check the flipped pages again. This causes the misdetectionof the flipping since the movement of the insidecover is the same. In contrast, the bookmark version hasno such limitation. The information is provided based onthe incremented page by the movement of the beak. So, areader would be presented different information while he/sheis checking a page that he/she flipped before. We considerthis is not so big problem in a novel book since the activityis basically confirming unclear point. However, the pausebutton can be added to the beak or somewhere to improvethe usability.Figure 5. User Survey on the Acceptability of the Devices and Preferenceof the SystemPreference of Virtual Illustration SystemThe preference of creating contents and utilizing the systemis presented in Figure 5 b), where all the subjects liked toutilize the system (score = 4 and 5). They agreed with theconcept of making reading experiences rich with an existingbook. Furthermore, some subjects requested additionalfunctionalities: the improvement of the efficiency and the environmentof reading, i.e. virtual bookmarking of preferredpages, finding the meaning of unknown words, automaticadjustment of ambient light, bad posture warning, etc. Currently,the eBookXML description is edited by a text editorbasis. On the other hand, the subjects did not like to createcontents so much as utilizing them. To increase a creatorin order to work the contents distribution system well,we will investigate a sophisticated authoring tool in the future.The tool may retrieve suggested contents based on akeyword specified by a creator from an online photo sharingservice like a Flickr.User Feedback and ImplicationsThe subjects preferred the images of maps. Although thereis a hand-written map at the beginning of the book that illustratesthe positional relationship of typical places, it wastoo abstract and insufficient for them to understand. The positionalrelation of many other places remained unclear. Itwas critical since the book is a travelogue. Other imagesthat the subjects preferred are the pictures of a novelty animal,i.e. ermine, and a mountain path because they wereinformative. The audio contents were not preferred sincethey were played at a wrong time.126
As can be seen in Figure 4, a user looks at an image over abook. Although the distance of the eye movement is minimum,two subjects felt rather annoying. They tried to see animage every time it appears. So, they often felt interruptedwhen more than two images are assigned to one flipping (atwo-page spread) and they change in a short time. Actually,the time to change an image was set to 3 to 7 seconds forthe first two subjects, and the third subjects who did not feelannoying utilized the interval of 10 to 40 seconds.Even though the rate of the change is low, the appropriatenessof the timing of providing contents is very important.The subjects also felt annoying when an image or asound clip had been presented too early. This sometimeshappened for the contents that are related to the left page(latter part). Our approach handles only the page flippingdetection, which makes it difficult to identify the exact timingto present contents. Through the interview session, wehave noticed that contents presentation at exactly right timingis not necessary. Not all the contents was interesting toa reader, where such a “force presentation” was rather annoying.We consider a semi-automatic presentation wouldaddress this issue: thumbnails and corresponding keywordsare automatically shown in the screen, which are assignedpage-by-page basis as the current version does. A reader cansee the presence of some information when they appear, andthen he/she can obtain the actual contents based on his/herpreference.CONCLUDING REMARKIn this paper, we have proposed an augmentation of an ordinalbook with page flipping event detection. Accumulationof a page flipping event is utilized to estimate the currenttwo-page spread. Two types of add-on devices, i.e. abook cover and a bookmark version, have been investigatedin combination with two accelerometers. The augmentationallows a system to provide a reader with value added experienceswhile keeping the original sense of utilization intact,e.g. a texture of paper. The complex copyright issuesdo not need to be addressed because it utilizes an existingpaper-based book. We have also developed a prototype applicationcalled virtual illustration system. It automaticallyprovides multimedia information based on the page that areader is reading. Everyone can publish the contents writtenin eBookML like an HTML document and share them withothers.The add-on devices have been evaluated regarding the performanceof page flipping event detection and the usability.The detection accuracy of the book cover and the bookmarkversions are 88.1% and 92.5%, respectively. We considerthat a book with sequential access to the contents and thesmall number of the pages is appropriate for the proposeddevices, e.g. short novel. We are planning to investigate amechanism to correct or adjust the page estimation by a userfor more flexible service. The concept of the prototype applicationhas mostly been accepted. The user feedback fromthe experiment with real contents has shown us the need foron-demand contents selection to minimize the interruptionto a reader. This also relaxes the constraints of the devicesthat relies on the detection of page flipping.AcknowledgmentsThis work was supported by The Ministry of Education, Culture,Sports, Science and Technology in Japan under a Grantin-Aidfor Division of Young Researchers. We would alsolike to thank the subjects of our evaluation.REFERENCES1. SwanTouch,http://swanmark.hp.infoseek.co.jp/index.html2. althi Inc. Image Novel, http://www.althi.co.jp/tat.html3. Back, M. J., et al.: Page detection using embedded tags.In Proc. of the 13th annual ACM symposium on Userinterface software and technology (UIST2000) (2000)4. Billinghurst, M., et al.: MagicBook: transitioningbetween reality and virtuality. In Extended abstract onHuman factor in computing systems (CHI’01) (2001)5. CELSYS Inc. BookSurfing,http://www.celsys.co.jp/en/solution/booksurfing6. E Ink Co. Electronic paper displays,http://www.eink.com7. Koike, H., et al.: Integrating Paper and DigitalInformation on EnhancedDesk: A Method for RealtimeFnger Tracking on an Augmented Desk System. ACMTrans. Comput.-Hum. Interact., Vol. 8, No. 4, pp.307–322 (2001)8. Koike, H., et al.: Interactive Textbook and InteractiveVenn diagram: Natural and Intuitive Interfaces onAugmented Desk System. In Proc. of the SIGCHIconference on Human factors in computing systems(CHI ’00), pp. 121–128 (2000)9. Matsushita Electric Industrial Co., Ltd. Sigma book..10. May, K. W.: Conductive ink based page detection forlinking digital and physical pages. In CHI ’01 extendedabstracts on Human factors in computing systems, pp.275–276 (2001)11. SONY Co. LIBRIE. .12. Watanabe, J., et al. Bookisheet: Bendable Device forBrowsing Content Using the Metaphor of LeafingThrough the Pages. In Proc. of 10th InternationalConference on Ubiquitous Computing (Ubicomp2008)(2008).13. Wellner, P.: Interacting with paper on the DigitalDesk.Commun. ACM, Vol. 36, No. 7, 87–96 (1993)14. Wu, C.-S., et al.: Turning a page on the digitalannotation of physical books. In Proc. of the SecondInternational Conference on Tangible and EmbeddedInteraction (TEI08), pp. 109–116 (2008)127
Ambient Information SystemsWilliam R. Hazlewood, Lorcan Coyle, Zachary Pousman, Youn-Kyung LimPREFACECurrent research in pervasive and ubiquitous computing isguiding us to a future where we are surrounded byinnumerable information sources all competing for ourattention. These information sources may manifest as bothnovel devices and as devices embedded in common objects,such as refrigerators, automobiles, toys, furniture, clothes,and even our own bodies. While this vision of the futurehas prompted great advancements in context-awarecomputing, wireless connectivity, multi-sensor platforms,smart materials, and location-tracking technologies, there isa concern that this proliferation of technology willincreasingly overwhelm us with information. Our belief isthat information should move seamlessly between theperiphery and the center of one's attention, and that goodtechnology is highly transparent. We see ambientinformation systems as a way to support these ideas.Ambient Information Systems describe a large set ofapplications that publish information in a highly nonintrusivemanner, following on from Mark Weiser's conceptof calm technology. This form of information delivery hasmanifested in several different implementations, but theoverall theme revolves around how best to embedinformation into our surroundings.The Second International Workshop on the Design andEvaluation of Ambient Information Systems was held inCOEX, Seoul, South Korea, on September 21 st 2008, inconjunction with the Tenth International Conference onUbiquitous Computing. Building on the success of lastyear's workshop at Pervasive 2007, we brought togetherresearchers working in the areas of ambient displays,peripheral displays, slow technology, glanceable displays,and calm technology to discuss and collaborate ondeveloping new design approaches for creating ambientinformation systems.The workshop topics were for the most part listed as aset of questions:• How are ambient information systems distinct from otherinformation technologies?• What are examples of useful heuristics, frameworks,taxonomies, or design principles for the implementation ofambient information?• Should Ambient Information Systems move beyond thetraditional scope of vision; is there merit in Ambient Noise,Ambient Smells, Tactile Ambience, and Ambient Taste?• How much ambient information can one perceive andcomprehend?• What, if any, are the appropriate interaction methods forthese information devices?• Where should ambient systems be placed to improve theirchances of being used, without becoming distracting orannoying?• What sorts of information are best conveyed by anambient display?• What are the appropriate methods for evaluating ambientinformation systems, particularly those that are notnecessarily task-based?• How do we describe the values of these particulartechnologies in our everyday lives?• How can we make use of existing technologies? (e.g.smart materials, wearable systems, etc.)• What knowledge from other domains should we apply?(e.g., from art, cognitive science, design, psychology,sociology)We were also particularly interested to hear aboutambient information systems in the following areas:• Resource Consumption, e.g., power, heat, water, food,and for shared or personal resources• Work and workload ``progress'' (e.g., explicitly orimplicitly gathered data, or those based on a workflow)ORGANIZERS:William R. Hazlewood, Indiana University, USALorcan Coyle, University College DublinYoun-Kyung Lim, KAIST, South KoreaZachary Pousman, Georgia Institute of Technology, USAPROGRAM COMMITTEEFrank Bentley, Motorola Labs, USAJodi Forlizzi, Carnegie Mellon University, USAAndrew Vande Moere, University of Sydney, AustraliaSteve Neely, University College Dublin, IrelandAaron Quigley, University College Dublin, IrelandAlbrecht Schmidt, Research Group Embedded Interaction,GermanyJohn Stasko, Georgia Institute of Technology, USAErik Stolterman, Indiana University, USAMartin Tomitsch, Vienna University of Technology,Austria128
Ambient FaçadesBernhard WallyStudio Pervasive Computing ApplicationsResearch Studios AustriaThurngasse 8/16, A-1090 Viennabernhard.wally@researchstudio.atABSTRACTPublic spaces get increasingly equipped with displays interms of shopping window plasma screens, electronic advertisementsat the point of sale, kiosk systems at points ofinterest, etc. While this trend enables numerous applicationsin the pervasive display systems domain, it also haseffects on how people perceive urban environments. In thiswork we describe the concept, implementation and firstexperiences from a real life setup of an ambient façadesframework expanding the idea of public displays to façadesof arbitrary buildings without modifications on the buildingsthemselves. With such a framework it is possible tointegrate information into buildings in a very unobtrusiveway and without interference with the building fabric.KeywordsAmbient Displays, Content Adaption, Simulation, PublicDisplay SystemsINTRODUCTIONPublic displays are being increasingly used for displayingdiverse information, including corporate propaganda at instoreinstallations, advertisements at the point of sale andlocation-aware information at points of interest. In Viennathe headquarter of the UNIQA insurance company, theUNIQA Tower, has been covered with more than 180.000LEDs that are controlled based on video signals with 25frames per second [18, 19].We believe that public displays can be perfectly used asvisual interfaces for ambient information systems by leveragingthe ever increasing availability of such displays andone of the most interesting features of ambient displays:information hiding. Depending on the level of abstraction,the information depicted in ambient displays can be understoodby almost anyone passing by or it can be revealed toinformed people only – uninitiated people just see images,icons, figures, etc.Implicit and explicit interaction metaphors and techniqueshave already been discussed in the literature and eventhough we don’t believe that this topic is solved (on thecontrary – feasible solutions still need to be invented), wedo not attempt to give an answer on specific interactionAlois FerschaDepartment of Pervasive ComputingJohannes Kepler University LinzAltenberger Strasse 69, A-4040 Linzferscha@pervasive.jku.atstyles but concentrate on the visualization on data on façades.RELATED WORKAmbient displays have been thoroughly discussed withinthe last decade, starting with early instantiations as physicaldisplays in the late 90s, characterizing ambient displays asentities that “present information within a space throughsubtle changes in light, sound, and movement, which canbe processed in the background of awareness” [1]. Eventhough some of the concepts have been proposed earlier,the ambientROOM and two ambient fixtures have beenpresented in [1] and [2] describing indoor mounted displayscomprising light, sound, airflow and physical motionas the ambient actuators. In [3] the concept of ambient mediahas been broadened to “the use of our surroundings forinformation display”, which represents a key concept ofwhat we think of ambient displays: integration into ourlives by either imitating commonplace objects or by extendingexisting objects with somewhat smart behavior.By specifying different zones of interaction (ambient, notification,interactive) a hybrid approach is prosecuted: dependingon the distance of a prospective user to the ambientdisplay (the Hello.Wall) the type of interaction is determined[4, 5]: in the ambient zone the display showsgeneral information about the overall level of activity,number of people in the building, etc. In the notificationzone the ambient display reacts on the physical presence ofa specific person and provides means for explicitinteraction with the ambient display over a handhelddevice. In the interaction zone the user can interact with thedisplay at a very low level and allows for playful andnarrativeAn extensioninteractions.of this concept is presented in [8] where thethree zones are interpreted as four phases of interaction(ordered from far way to close): ambient display, implicitinteraction, subtle interaction and personal interaction. Thebasic idea is that the ambient display resembles a commoncontext that should not be destabilized by the other phases.Transitioning from one phase to another should be verysmooth and happen only if certain “interruptibility” is detected.Regarding the type of visualization within ambient displaysan interesting concept has been presented in [12], usingparticle systems, as they are able to “accurately portraycomplex data with breadth, depth, and elegance”. Particlesystems seem chaotic and incomprehensible in the firstplace but can be rich in information, if used with caution.129
We, too, believe there is a certain power within particlesystems as they can deliver information extracted from thesingle particles and a particle system has an overall appearance(shape, volume, etc.) that can unveil even more information.The ambient display framework described inthis work also makes use of the low-level and high-levelstatements of a high number of objects on an ambient display.[16] shows a possible solution for displaying text in ambientdisplays in an aesthetically pleasing way by using kinetictypography (animated text) for displaying e-mail messagesin the AmbientMailer system. This work is interesting,as (especially high throughput) textual displays oftenlack aesthetic emphasis [9].In [10] a general purpose software framework for informativeart display systems is presented and some general aspectsof typical ambient displays are depicted, includingthemes, symbols and connotations. On the basis of realpaintings, methods for integrating information therein areproposed and implemented in the peripheral display framework.Subsequent research led to the proposal of moreuser-oriented, participatory design process for ambient displays[11], by letting the user decide on the specific themea peripheral display is operated at. Different elements ofvarious artworks are manipulated to resemble sensor dataor abstract context information thus leaving the decisionfor the concrete piece of painting used for displaying ambientinformation to the user.One of the rather seldom seen examples of large publicdisplays is presented in [17], explaining a detailed observationof the multi-touch display called City Wall. While theemphasis of this project lies on the multi-user interactionpossibilities, it also shows some interesting aspects of howpeople approach public displays. Depending on the currentusage of the display, people need to wait for a free slot iftoo many people are interacting already, or they can startinteracting immediately if nobody is using the display. Theempiric data shows however, that there are usually at leasttwo steps involved: (1) noticing that there is a display, (2)interacting with the display. One conclusion of [17] is that“City Wall’s large physical size appeared to support makinginteractions visible”. During eight days of operation1199 people interacted with the system.Evaluation of Ambient Information SystemsRegarding the evaluation of ambient displays, several approacheshave been presented, such as a method to evaluatethe comprehension of such displays [6]: it is argued thatthere are three levels of comprehension, each being a prerequisiteof the next:1. That information is visualized2. What kind of visualization is visualized3. How the information is visualizedThe author emphasizes that it is important to consider thefirst two steps in the system design process and not start(blindly) at level 3 [6]. We believe however, that somesettings, especially when involving public displays, singleor even all three steps are not explained on purpose, so thatonly informed people know about the informative value ofsuch displays.Users’ experiences with an at-home ambient display havebeen presented in [7] with the CareNet display which supportsan ambient and an interactive mode. Situated in thefield of elder care it was shown that people with differentroles used the display in different ways: basically, the lessthe people were integrated into the care-process, the moreoften they actively used the display (interactively), whileseriously dedicated people used the display as ambient informationsystem.In [13] the success of ambient displays is identified as thecombination of effectiveness in promoting awareness andthe level of enjoyment in the users. This statement is derivedafter observing users and installations of four differentambient information systems of both tangible and (abstract)2D display type.In [14] a taxonomy for ambient displays is proposed comprisinga set of design dimensions that can be applied to thevarious systems and allow a detailed classification. Withthe 19 projects already included in their taxonomy, a tendencyto private, visual and highly abstract displays hasbeen determined. However, we believe the number of publicambient displays is going to increase with the rise ofpublic displays in general.A very critical look at public displays is taken in [15]where large ambient displays in public settings have beenobserved regarding their use practices. It is stated, thatlarge public displays are not necessarily eye-catching andappealing, but that glancing and attention is a rather complexprocess. One of the key statements is that “peoplemake extremely rapid decisions about the value and relevanceof large display content”, devaluating content thattakes more then a few brief seconds to absorb. Also thedisplayed format is very important for the perception: videois more attractive than text, animated text or still images.Regarding these findings of previous work, we propose thevirtual façade framework for using suitable façades ofbuildings as solid basis for ambient information display.VIRTUAL FAÇADE FRAMEWORKExamining façades as hosts for ambient displays is a veryexciting thing, as the discrepancy between private data andpublic accessibility is very high. Nevertheless, the aestheticsof fascinating buildings can offer a great set of structures“to lean on” (cf. Figure 1).130
Figure 1: Interesting features of a façade include borders ofwindows, various areas (separated by different colors,shapes, etc.) and ornamentation.PurposeIn order to be able to support future development of façadesas displays in combination with the ambient displaymetaphor we decided to implement a robust framework as abasis for further ideas and implementations.We enunciated the requirements for the framework veryroughly, as we wanted to narrow the choice of technicalsolutions as less as possible: Text: There might by a need to display text of any size,font type and color. However, with regards to ambientdisplays text is usually avoided in favor of graphical solutions– thus it is a minor requirement. Still images: Support for embedding images into thevisualization including scaling functions (each axis independently)and, of course, free positioning. Moving images: The framework should be able to rendervideos and support both live camera streams andproduced videos: Live camera streams: Since our first façade was tobe the one of the Theatre Linz, we opted to integratethe possibility to render live camera streams to thefaçade. This thought was driven by the idea to presentthe current action on stage simultaneously outside. Produced videos: In addition to live video, our systemshould support readily available videos in orderto visualize perfectly pre-arranged content and selectedscenes. Also, in case of a live camera failure,locally available videos could be applied to the visualization. Fragmented objects: The visual content is required to bedisplayed fragmented, as one of our main claims is toadapt visuals to the structure of façades and they oftencomprise compact areas discontinued by some ornamentation,windows or the like. It should be possible toload a single resource and split it into several parts forwide spread display. Dynamics: The framework was supposed to supportanimated content by means of moving, rotating fragmentedobjects, either by specifying the animation overa separate tool (even at runtime) or by introducing somekind of automated animation mechanism. Content management: A content management systemsupports the integration of different resources (images,videos, streams) at runtime and provides a way to definethe position and shape of structures and ornamentsof the façade to project on. For better results, the definitionshould take place on-site, when projection distanceand angle are known. Additionally, the support for onsitestructure definition paves the way for automatedmechanisms, e.g. via a camera based system drivingedge detection or other image processing algorithms.Aside from these requirements we also had a picture inmind of what we would like to achieve. A relatively coarseillustration thereof is depicted in Figure 2 and Figure 3.(a) (b) (c)Figure 2: The façade of the MuseumsQuartier in Vienna/Austriato project on (a), an automated structure detectionalgorithm, such as Difference of Gaussians (b), andthe final fragmentation into separate regions, using e.g.Flood Fill algorithm (c).(a) (b) (c)Figure 3: The façade of the Theatre Linz (a), after edgedetection (b), with detected regions (c).System ArchitectureBased on our visions and derived requirements we decidedon a simple system architecture comprising a softwareframework running on a PC which renders the visuals to aprojector system and receives data from several resourcesas well as user input for the content management system. Arough system architecture is illustrated in Figure 4.Figure 4: System architecture of the ambient façadesframework: different content types are handled by a content131
management system and forwarded to a rendering enginewhich outputs the visuals to a projector system facing asuitable façade.A separate control channel gives the chance to modify parametersat runtime – a basic feature of ambient displayframeworks, as this control channel is used to send e.g.sensor data to the visualization system which in turn canmodify size, position, speed, color or similar features ofvisualized objects for sensor data representation. The controlchannel is also used to configure the visualization systemregarding a specific façade setup (distance, angles,structures, etc.).Technical ImplementationHardwareOur setup was executed on an IBM laptop with a 1.7 GHzPentium M CPU and an ATI Mobility Radeon 7500 integratedgraphics card running Windows XP SP2. The projectedimage was required to fill an area of at least 4.5x6square meters on somewhat light façades. To provide abright and high-contrast picture we decided to use a BarcoSLM R12+ Performer large venue projector with 12000ANSI Lumen, to be positioned about 18 meters from thebuilding. The resolution chosen for the projection was1024x768 pixels. For receiving live video streams weadded a Logitech QuickCam Pro 9000 webcam connectedvia USB 2.0.SoftwareBefore we started implementing a structured framework,we did some technology research and created simple laboratorydemos in order to be able to estimate implementationeffort and feature richness of the tested components. Oneof the key findings was that our framework is only requiredto support two dimensional positioning, moving, etc. as weintended to project on flat surfaces only and wanted to interactwith structures of these surfaces. It occurred to usthat a 2D physics engine would help our efforts a lot, especiallyby solving the question how to animate componentsas to provide constant motion. A quick research in thephysics engine “market” disclosed the Chipmunk 2D physicsengine which is licensed under the unrestrictive MITlicense and is written in pure C99, which led us to the decisionto use OpenGL as the rendering engine. Even thoughwe did not want to support full 3D applications, the use ofa three dimensional graphics engine allowed easily integratingdifferent layers, usually referred to as z-order ofvisual components.The visuals would be implemented as textured meshes ofarbitrary shapes and sizes. Texturing meshes with still imageswas offered by the DevIL library, uniformly coloredmeshes were pigmented using OpenGL’s glColor* functions.AVI video files were read using the Video for WindowsAPI and the grabbed frames were converted into texturecompatible byte arrays. Live video streams were realizedwith the OpenCV library through the HighGUI API.To ensure the correct color order of the webcam content,the respective pixel buffer is displayed in GL_BGR_EXTformat.Figure 5 depicts the implemented software architecture forthe demonstrator. A user input module allows interactingwith the scene during runtime by adding/removing obstacles,throwing requisites and defining/undefining blackareas in the projected image (such as to exclude windowsfrom being projected on).Figure 5: The software architecture used for the AmbientFaçade Framework wraps the underlying C-libraries intoconvenient C++ classes; instance management is handledfrom a central entity “Scene Manager”.The central management entity is responsible for renderingthe components by providing a simple scene graph, whichis altered by user input or a parallel process generating randompieces to be integrated as falling objects into thescene. It calls the appropriate functions of the underlyingC-libraries and is supported by a separate thread responsiblefor continuously buffering webcam content in a bytearray to be used as texture.The user input is performed using a pointing device such asa mouse for positioning obstacles, black areas and forthrowing requisites around. The basic workflow is to definefaçade structures and unprojectable areas once the applicationis running and projected onto the façade. Thedemonstrator is then ready to go and starts dropping requisitesfrom somewhere above the screen into the scene. Witha keystroke the direction of gravity can be adjusted to anyof top-down, bottom-up, left-right, right-left. The requisitesare generated using random numbers and can differ in type(shape, texture), initial coordinates, initial velocity and directionand angular rate. The interval between the creationsof two consecutive requisites is between 100 and 600 ms.The coordinates of each requisite are tracked and comparedto the borders of the viewport; in combination with thecurrent direction of gravity the requisites are deleted andrespective memory freed if a certain distance threshold hasbeen exceeded and the objects are not to return to the viewportanymore.Of course, also elements that are not managed by the physicsengine can be included, to realize static elements, e.g.used for fragmented video visualization, as depicted inFigure 6.132
the simulation depicted here a fruits theme was used insteadof the theatre theme illustrated in Figure 8.Figure 6: The frameworks shows fragmented video contentonly in areas not masked. The mask is adjusted accordingto the underlying façade structures.One important aspect of the projection based system was toavoid bright light flooding the rooms behind the façade andprobably blinding or disturbing people working or lingeringtherein. To overcome this issue, we added a mask layeron top of the rendered scene where black (not to be projected)areas could be defined. Ultimately, even if a collisiondetection would fail, a requisite falling into a windowwould not be visualized but filtered out by the black maskinglayer. It is therefore possible to use this layer to displayfragmented video slices by simply erasing parts of the contentfrom the overall video (cf. Figure 6).We implemented the concept of textures as abstract as possible,ending up with a system that allows comfortable exchangeof textures and sharing of textures between multipleobjects regardless of the texture type (image, color, video,none).The performance of the system was satisfying and ran fluentlyon the specified (aging) system. The most influentialbottleneck was the physics engine as it considerably sloweddown if more than two hundred objects were to be considered.A built-in simulation mode helps understanding the basicbehavior of implemented features by rendering the completescene to a separate texture and blending it on top of afaçade. The section of the façade to be projected on can beadjusted to any extend required. It is possible to view thewhole façade or just the part where the projection will takeplace (cf. Figure 7).REAL LIFE SETUPWe tested our Ambient Façade Framework during a performanceof La Traviata at the Theatre Linz to mainly findout two things:1. Is the technical realization good enough regardingbrightness and contrast of the projected image and thesize of the fragments?2. What is the (subjective) overall visual impression like?The first question can be answered quickly: the chosenBarco projector illuminated the façade of the Theatre Linzat an amazing level of brightness and contrast. Of course,the façade was a very complaisant screen as it was unenlightenedand had a very pale yellowish color resulting inalmost no color variation. The displayed visuals were goodto perceive, however some of the objects used for the dynamicssimulation turned out to be too small.The overall visual impression of our live demonstrationwas outstanding. Invited representatives of the TheatreLinz and our colleagues were impressed by the quality ofthe displayed content and the ease of use concerning thesetup process which took roughly one minute to markstructures and ornamentation using a simple pointing device.The dynamics engine emerged to be very attractiveand created a very harmonic relation between the façadeand the displayed objects. Changes in gravitation were easyto follow and the bouncing elements made sure that there ismotion at any time. Animated elements were not necessaryfor displaying video streams, as the moving images areattractive enough when displayed on their own, as staticelements filling certain areas of the façade.(a)(b)Figure 7: The simulation mode of the Ambient FaçadeFramework allows viewing the section to project on (a) orthe whole building with the visuals blended on top (b). In(a)(b)Figure 8: The framework at runtime, projecting on the façadeof the Theatre Linz: requisites fall down the façadeand interact with structural elements of the façade (a).Fragmented video elements are projected on the two pillarson the façade.The live demonstration did not incorporate any sensor data,but was controlled manually, because we mainly wanted totest the visual appearance rather than the correct transformationof sensor data into ambient information objects.133
CONCLUSIONWe have presented the design and implementation of anambient façades framework that uses façades of buildingsand their underlying structures and ornamentation togetherwith large venue projection technology to form a new typeof ambient display in urban spaces. The presented frameworksis able to display dynamic particles resemblingpieces of information regardless of their type (video, images,text) by considering physical barriers on a façade,which can be edited at runtime and customized to variousfaçades.The current status of the demonstrators hash shown somepotential for further improvements. In order to adhere to afully automated configuration of masks and obstacles, imageprocessing methods could be of a great help. By detectingedges in an image taken from the façade, it would bepossible to automatically define obstacles like window bordersand ornamentation. Edge detection combined withrecognition of connected areas would enable the automatedfinding of areas for video display. Of course, camera andprojector need to be calibrated in a way that allows themapping of camera-based coordinates to coordinates withinthe projected renderings. Currently such a feature is notimplemented in the framework, but the structures need tobe defined by hand.ACKNOWLEDGMENTSThe authors would like to thank Heinrich Schmitzbergerwho implemented parts of the code related to fragmentedobjects and supported the preparation and realization of thelive demonstration at the Theatre Linz with his valuableexperience in large scale, long range projections. BernadetteEmsenhuber prepared the displayed video files fordevelopment and the demonstration and additionally documentedthe live demonstration with still and moving images.Dominik Hochreiter was another member of the livedemonstration team and helped with the technical setup andlens and distance calculation.Finally, we would like to thank Thomas Königstorfer,commercial chairman of the board of the Theatre Linz, forhis encouragement to try our framework on the façade ofthe Theatre Linz during a performance of La Traviata. Wealso appreciate his precious comments and feedback regardingfurther development.REFERENCES1. Wisneski, C., Ishii, H., Dahley, A., Gorbet, M., Brave,S., Ullmer, B., Yarin, P., Ambient Displays: TurningArchitectural Space into an Interface between Peopleand Digital Information, in Proceedings of the 1 st InternationalWorkshop on Cooperative Building (CoBuild’98), pp. 22-32, February, 1998.2. Dahley, A., Wisneski, C., Ishii, H., Water Lamp andPinwheels: Ambient Projection of Digital Informationinto Architectural Space, in Conference Summary onHuman Factors in Computing Systems (CHI ’98), pp.269-270, April 18-23, 1998.3. Gellersen, H.W., Schmidt, A., Beigl, M., Ambient Mediafor Peripheral Information Display, Personal andUbiquitous Computing, Vol. 3, No. 4, pp. 199-208, December,1999.4. Streitz, N., Röcker, C., Prante, T., Stenzel, R., van Alphen,D., Situated Interaction with Ambient Information:Facilitating Awareness and Communication inUbiquitous Work Environments, in Proceedings of the10 th International Conference on Human-Computer Interaction(HCI International 2003), pp. 133-137, June22-27, 2003.5. Prante, T., Röcker, C., Streitz, N., Stenzel, R.,Magerkurth, C., Hello.Wall – Beyond Ambient Displays,in Adjunct Proceedings of the 5 th InternationalConference on Ubiquitous Computing (UBICOMP ‘03),pp. 277-278, October 12-15, 2008.6. Holmquist, L.E., Evaluating the Comprehension ofAmbient Displays, in Extended Abstracts on HumanFactors in Computing Systems, part of CHI 2004, pp.1545-1545, April 24-29, 2004.7. Consolvo, S., Roessler, P., Shelton, B.E., The CareNetDisplay: Lessons Learned from an In Home Evaluationof an Ambient Display, in Proceedings of the 6 th InternationalConference on Ubiquitous Computing (UBI-COMP ‘04), pp. 1-17, September 7-10, 2004.8. Vogel, D., Balakrishnan, R., Interactive Public AmbientDisplays: Transitioning from Implicit to Explicit, Publicto Personal, Interaction with Multiple Users, in Proceedingsof the 17 th Annual ACM Symposium on UserInterface Software and Technology (UIST ’04), pp. 137-146, October 24-27, 2004.9. Pousman, Z., Stasko, J., A Taxonomy of Ambient InformationSystems: Four Patterns of Design, in Proceedingsof the Working Conference on Advanced VisualInterfaces (AVI ’06), pp. 67-74, May 23-26, 2006.10.Ferscha, A., Informative Art Display Metaphors, inProceedings of the 4 th International Conference onUniversal Access in Human-Computer Interaction(UAHCI 2007), pp. 82-92, July, 2007.11.Ferscha, A., A Matter of Taste, in Proceedings of the2 nd European Conference on Ambient Intelligence (AmI2007), November, 2007.12.Walker, K., Smoke Signals: Particle Systems for AmbientInformation Display, Internet:http://www.exhibitresearch.com/kevin/ioe/smoke.pdf,last viewed: July, 2008.13.Stasko, J., Doo, M., Dorn, B., Plaue, C., Explorationsand Experiences with Ambient Information Systems, inProceedings of the Workshop for Ambient InformationSystems at the 5 th International Conference on PervasiveComputing (PERVASIVE 2007), pp. 36-41, May13, 2007.14.Tomitsch, M., Kappel, K., Lehner, A., Grechenig, T.,Towards a Taxonomy for Ambient Information Sys-134
tems, in Proceedings of the Workshop for Ambient InformationSystems at the 5 th International Conferenceon Pervasive Computing (PERVASIVE 2007), pp. 42-47, May 13, 2007.15.Huang, E., Koster, A., Borchers, J., Overcoming Assumptionsand Uncovering Practices: When Does thePublic Really Look at Public Displays?, in Proceedingsof PERVASIVE 2008, pp. 228-243, May 19-22, 2008.16.Minakuchi, M., Kidawara, Y., Kinetic Typography forAmbient Displays, in Proceedings of the 2 nd InternationalConference on Ubiquitous Information Managementand Communication (ICUIMC ’08), pp. 54-57,2008.17.Peltonen, P., Kurvinen, E., Salovaara, A., Jacucci, G.,Ilmonen, T., Evans, J., Oulasvirta, A., Saarikko, P., “It’sMine, Don’t Touch!”: Interactions at a Large Multi-Touch Display in a City Centre, in Proceedings of the26 th Annual SIGCHI Conferences on Human Factors inComputing Systems (CHI ’08), pp. 1285-1294, April 5-10, 2008.18.UNIQA Versicherungen AG, Der UNIQA Tower –LED Design, Internet:http://tower.uniqa.at/content/led_koerperdesign.php?nav=2|0, last viewed: July, 2008.19.LICHT KUNST LICHT AG, UNIQA-Tower, Internet:http://www.lichtkunstlicht.de/, last viewed: July, 2008.135
Ambient interface design for a Mobile BrowsingExperience (AMBE)Rosaleen Hegarty†, Tom Lunney†, Kevin Curran†, Maurice Mulvenna*†School of Computing and Intelligent SystemsFaculty of Computing and EngineeringUniversity of Ulster, Magee CollegeDerry/Londonderry, BT48 7JL(+44) 28 71375174{hegarty-r, tf.lunney, kj.curran}@ulster.ac.ukABSTRACTOur preliminary research focuses on the development ofan Ambient Mobile Browsing Experience (AMBE)system. AMBE is a communication and synchronisationframework that will provide integrated connectivityacross heterogeneous geographically distributed devices.The intention is to provide persistent location-independentand appliance-sensitive viewing for the user, thusenabling Internet mobility. Human technology interfacecommunication will be abstracted to a representation thatfacilitates optimisation and customisation across a numberof different displays. This will help to ensure seamlesscontinuity between components providing usability andmaximum user convenience. An emphasis of our work isthe application of a human-centered design ethos.KeywordsAmbient interfaces, peripheral displays, ubiquitouscomputing, mobile digital communication, sensortechnology, context awareness.*School of Computing and MathematicsFaculty of Computing and EngineeringUniversity of Ulster, Jordanstown CampusAntrim, BT 37 OQB(+44) 28 71375388md.mulvenna@ulster.ac.ukof ‘calm’ [20] remains the consummation in thesephenomena and a reflection of the technology we seek.The principle of AIS, is captured in the following instanceand subsequent descriptions; “When you look at a streetsign, for example, you absorb its information withoutconsciously performing the act of reading. Computerscientist Herbert A. Simon calls this phenomenon“compiling”; philosopher Michael Polanyi calls it “thetacit dimension”; psychologist J.J. Gibson calls it “visualinvariants”; philosophers Hans Georg Gadamer andMartin Heidegger call it “the horizon” and the “readyto-hand”,John Seely Brown at PARC calls it the“periphery”. All say, in essence, that only when thingsdisappear in this way are we freed to use them withoutthinking and so to focus beyond them on new goals” [20].Nature in her pureness has provided simple informativecues that act on the subconscious delivering subliminallyINTRODUCTIONDenning and Metcalfe affirm, “to become attuned to moreinformation is to attend to it less” [5]. This cause iscentral to Ambient Information System (AIS) designwithin Ambient Intelligence (AmI). The ethos of whichlies in the classification of center (the user) and periphery(computational devices) for intelligent knowledgemanagement, with the objective of controllinginformation overload and unnecessary complexity.Carbonell reflects on ambient interface interactions ashaving to be reconfigured for throughput to outputterminals of varying media and screen dimensions [4].Implementation of these constraints gives rise to‘interface plasticity’ and ‘adaptive multimodality’ [3].However maintaining simplicity whilst asserting notionsFigure 1. Ambient information existing in nature.and with critical effect. Take the occasion of a raindrop, asignal and a suggestion requiring little cognitive effort,yet retrieving from memory past experiences stimulatedby similar impetus to deliver appropriate actions. Nature’sambient sound and light further inform our everyday stateof existence. With this in mind it is perhaps to nature wemust return in order to re-balance the informationcongestion that exists combining nature’s intuition withtwenty-first century engineering. ‘DataFountain’ reflectsthis concept. ‘DataFountain’ is an Internet enabled displayof currency comparisons for the Yen, Euro and Dollar,and uses pressurised water levels from three points toprovide particular information with calming aesthetics[14]. Another example is ‘PlantDisplay’ appealing tohuman emotion through organic changes in the plant’sappearance [13].136
Human-centered design is attempting to capture thisvision in computing technology by augmentingconsciousness and accommodating human-machine cooperation.The emphasis is on efficient user-affable andimmersive interfaces with distributed virtual services thatsurround; empowering the user with control [12].This anthropomorphic model of interaction refocuses theuser to the foreground and creates synergies between theuser and the environment [15]. Operations are intended tobe omnipresent, non-intrusive and transparent. It is in theapplication of ascribing human characteristics such assensory perception, and cognitive behavioural interactionsto physical or hidden phenomena that the essence ofambient intelligence is encapsulated to provide enhanceduser proficiency [12].Ambient information displays are about the analysis andrepresentation of information in public, semi-public andprivate space, incorporating subtle techniques andcommunication methods through peripheral perception[19].Ambient displays rely on our multimodal senses,operating subliminally and below the threshold ofconsciousness requiring only subconscious recognition[2]. The classic example is Jeremijenko’s DisplayInstallation entitled ‘Live Wire’, which attracts eitheraural or visual attention as the incitement requires [11].More recent ambient displays include ‘The Kandinskysystem’, which generates aesthetic information collagesconverting textual input to image output [8]. ‘IMPACT’monitors daily physical activity and provides feedbackthrough detailed and abstracted displays [9]. ‘AmbientOrb’ presents ambient information through wirelessconfigurations to track personal portfolio interests such asmarket shares [1]. ‘Hello.wall’ uses a large ambientdisplay coupled with a hand-held device exploiting ourability to perceive information via codes [19]. Real timedata panoramas map to visual components such as oceanwaves and sun strength reflecting stock market activity.Consistently the purpose is to refine knowledge to asymbolic representation requiring little cognitive effort[10].MOTIVATIONThe motivation for this research is to provide sensoractivatedcommunication. This will enable contextualisedcontent viewing to be available at the current terminal ordisplay screen demonstrating visual peripheralinformation updates for the user.The primary objectives of this study are in thedevelopment of a framework intrinsically linked to theporting of browsing session information over the network.This will be demonstrated through the implementation ofa scalable solution distributing current contextinformation to appropriate selected device displays. Therequirement is to ensure user interface continuity andoptimisation between distributed devices such as PersonalDigital Assistants (PDAs), Personal Computers (PCs), flatscreens and smart mobile phones by using appropriatesensor technology. Where appropriate the incorporationof abstract symbolism via an artefact may filterinformation to ambient displays in public space forpersonal user discernment. Customisation andsynchronisation of multimedia input and output betweenthe distributed devices are to ensure continuity of the userexperience.In pursuing the objectives outlined, several researchquestions will need to be addressed. For example: Whatsort of profiler will be required to track and perhapsinterpret the user behaviour/movement, both within thecontext of the virtual environment and the physical one(possibly intelligent algorithms coupled with infrared, orRadio Frequency Identification-RFID tags) to providepersistence and session continuity?In addition how will the profiler store the user’s session,will it cache and co-ordinate seamlessly to a new devicefrom decentralised clients (subsequently passing from webscript to client – client-side facilities), or from a centralrepository (heavy overload for concurrent sessions –server-side facilities)?How will AMBE tailor context sensitive intelligent userinterfaces with automatic profiling to optimise the mobileuser experience?What symbolic abstraction will be incorporated to releasesensitive information in public space, for example whatindicators will alert the importance of an incomingelectronic message in an operating theatre or surgicalroom where disturbance of external influence isunwelcome, yet may be critical information required bythe main operator within the given environment. Will thisutility be incorporated through artefacts of two or threedimensional composition? Or perhaps through colourcoding or contour configurations adapted from existingworks such as the Kandinsky paintings illustrated inFigure 2. Would this approach eliminate the beep andbuzz of phones and pagers providing social andacceptable communication etiquette, and in a minimallyintrusive manner?Figure 2. (i) Marcadores (ii) Squares with ConcentricRings by Kandinsky.An ethical issue that arises is that the abstracted notationfor information is reliable and consistent for the initiatedusers specified; otherwise it could lose all purposefulfunctionality. Privacy related data may need to be tagged137
as ‘sensitive’ and filtered away from any public form ofdisplay to enable security and dependability within thedesign.CHALLENGESAmongst the challenges for this system, there exists therequirement to work in real-time and to cope with varyinglevels of ambiguity, such as changes in user predilection,user idiosyncratic actions and weak sensor signals.Adaptability to new heterogeneous devices (Figure 3) andamended environments will result in readjustment to meetuser specification and compensate for device failuresupporting integration and interoperability. Whilstdynamically adapting to user requirements throughreconfiguration, ‘trust,’ ‘security’ and ‘safety’ standardsmust also be adhered to, and integrated into the systemdesign.orchestrate this profile to heterogeneous devices withindynamic environments. In addition the server will also beresponsible for carrying out routine authentication andauthorisation and provide session state and mobilityhandling within the system.CONTEXT AWARENESSThe design process of AMBE will rely on the concept ofcontext awareness. Adaptability to a user’s situation isenabled by context awareness, “Context is anyinformation that can be used to characterise a situation ofan entity” [6]. This entity can be a person, place orcomputational device, alternatively has real existence andcan change dynamically. Schmidt et al., say “context cangive meaning to something else [17]. A challengehighlighted in the development of deployable contextawareservices is the aptitude to lever ambiguous contextsas both sensed and interpreted context is often unclear. Inaddition deployment of contextual information to mobileapplications brings to light the trust and privacy features -critical with automated processing of sensitiveinformation. The sources available to capture contextualinformation in this research include sensors in mobiledevices, RFID tags, network servers and applicationservers among others. Contextual awareness betweendisparate entities seeks to facilitate interoperabilitybetween application platforms with some contextimmeasurable, but derived through inference [18].Figure 3. High-level schematic of AMBE.The core of the application architecture is to providenatural interactions and abstraction of the underlyingtechnical communication infrastructure; hidingcomplexity, whilst enhancing experience and confidence.Successful ubiquity however, requires transparencyintegrated into the ecology of ones environmentfacilitated through peripheral interfacing.The key components of AMBE work to ensure continuityof service between multiple parts and include a sensornetwork, web server, session server, and user session (tostore user history, cookies, current web page state andbookmarks amongst other user facilities) to differentdisplays. The server side can act as a coordinator tomanage the data, and facilitate screen resizing beforeexporting to a newly activated device. The client sidecomponent will have the necessary functionality tomanage session synchronisation as a feature. The servermust also maintain a user’s personal profile andActivity Theory ModelingActivity Theory Modeling is taken from the psychologyand social science disciplines, working in the areas ofconsciousness and cognitive acts within phenomenology[16]. Activity theory applied in AMBE finds applicationin the areas of context awareness and situationaldescriptions because of its adaptability to socio-technicalperspectives and centers on three key concepts namely;action, situation and presence to give context [16]. Theability to capture the context of the user in state,application and service requires interpretation of the ‘6W’s; ‘Who?,’ ‘What?,’ ‘Why?,’ ‘Where?,’ ‘When?’ and‘hoW?’ and is central to the design and profile of the user.Context is argued to be a feature of interaction in anyhuman-computer symbiosis [7]. It is based on the premisethat intelligence is action orientated and context can beused to bring order and clarity to unclear situations inorder to deliver appropriate actions. Therefore context isseen as a tool for action selection. Within AMBE enablingdevice exchange whilst sustaining the capabilities andresources of the current session is part enabled by contextawareness. Location information is another form ofcontext aware information. ‘Activity Theory Modeling’may be incorporated further into the design process ofAMBE as a means to capture information concerning theuser. This modeling may encapsulate the user’s intentionstowards a display terminal, the capabilities of their138
display equipment and their surrounding interfaces.Additionally this information could form a ‘migrationtheory’ between the user, their session and their display.CONCLUSIONAmbient Intelligence is a dynamic vision, one in whichtechnology serves information filtering. AMBE seeks toprovide an information utility through seamlesscoalescence and switching of display devices activated bysensors. This is achieved by caching the associatedobjects and relaying them to another possibly centralrepository, to facilitate viewing to commence on adifferent platform. Context-aware and context-dependentinformation will be captured to provide the dynamics insupporting this feature. The question that arises is how wedeliver critical information via ambient displays to highlyintensive environments of people centered care throughhuman-centered design. In addition, by incorporatinginterface plasticity and multimodality how should we testand with what recognised metrics, do we quantify, qualifyand assess the standard since these systems are designednot to occupy our full attention rather to augment it. Inaddition how interoperable are these systems and whatfuture dependability and security features can be applied.REFERENCES1. Ambient Orb (2008). Available at:http://www.ambientdevices.com/cat/orb/orborder.html2. Baars, B. J., Mc Govern, K. Cognitive views ofconsciousness, What are the facts? How can weexplain them?, in The Science of Consciousness(eds.)Veldmans, M., (1996), Routledge Press, 69.3. Calvary, G., Thevenin, D., Coutaz, J. A ReferenceFramework for the Development of Plastic UserInterfaces, 2003. Available at:http://iihm.imag.fr/publs/2003/MuiBook03.pdf.4. Carbonell, N. Ambient Multimodality: towardsAdvancing Computer Accessibility and AssistedLiving, International Journal on Universal Accessin the Information Society (UAIS, 2006), 18-26.5. Denning, P. J., Metcalfe, R. M. Beyond Calculation:The Next Fifty Years of Computing, (Springer 1998),83-84.6. Dey, A.K., Abowd, G. D. Towards a BetterUnderstanding of Context and Context Awareness inProceedings-Conference Human Factors InComputing Systems , The Hague, The Netherlands,April, 2000.7. Dourish, P. What we talk about when we talk aboutcontext, Personal and Ubiquitous Computing 8(1),2004, 19-33.8. Fogarty, J., Forlizzi, J., Hudson, S.E. AestheticInformation Collages: Generating Decorative Displaysthat Contain Information Proceedings (UIST2001,New York), ACM Press, 141-150.9. Forlizzi, J., Li, I., Dey, A. Ambient Interfaces thatMotivate Changes in Human Behaviour, 2007.Available at:http://ftp.informatik.rwth-aachen.de/Publication/CEUR-WS/Vol-254/paper02.pdf.10.Information Aesthetics, 2008. Available at:http://infosthetics.com/archives/ambient/.11.Interaction Design Thesis, 2007. Available at:http://interactionthesis.wordpress.com/2007/02/14/dangling-string/.12.Khedo, K. Short Notes on Ambient Intelligence, 2007.Available at:http://khedo.wordpress.com/2007/05/18/short-noteson-ambient-intelligence.13.Kuribayashi, S., Wakita. A. PlantDisplay: turninghouseplants into ambient display, in Proceedings ofthe 2006 ACM SIGCHI international conference onAdvances in computer entertainment technology,2006. Available at:http://portal.acm.org/citation.cfm?id=1178823.11788714.Mann, S., Georgas, M., Janzen, R. Water Jets asPixels: Water Fountains as both Sensors and Displays,in Proceedings of the eighth IEEE InternationalSymposium on Multimedia (ISM’06). Available at:http://www.eyetap.org/papers/docs/ieee_ism_funtain_simon_game274600766.pdf.15.Remagnino, P., Foresti, G. L. Ambient Intelligence: ANew Multidisciplinary Paradigm, in IEEETransactions on Systems, Man and Cybernetics – PartA: Systems and Humans, Vol. 35, No 1, 2005.16.Riva, G., Vatalaro, F., Davide, F., Alcaniz, M.Ambient Intelligence, the Evolution of TechnologyCommunication and Cognition - Towards the Futureof Human-Computer Interaction IOS Press, 2005, 21-23.17.Schmidt, A., Beigl, M., Gellersen, H.W. There is moreto Context than Location Computers and GraphicsJournal, Elsevier 23 (6), 1999, 893-902.18.van Sinderen, M. J., van Halteren, A.T., Wegdam, M.,Meeuwissen, H. B., Eertink, E. H. SupportingContext-Aware Mobile Applications: in IEEECommunications Magazine, Sept 2006, 96-104.19.Vogel, D., Balakrishnan, R. Interactive PublicAmbient Displays: Transitioning from Implicit toExplicit, Public to Personal, Interaction with MultipleUsers, 2004. Available at:http://www.dgp.toronto.edu/~ravin/papers/uist2004_ambient.pdf.20.Weiser, M., The Computer for the Twenty-FirstCentury, in Scientific American September 1991, 94-104.139
Ambient Life: Interrupted Permanent Tactile Life-likeActuation as a Status Display in Mobile PhonesFabian HemmertDeutsche Telekom LaboratoriesErnst-Reuter-Platz 710587 Berlin, Germanyfabian.hemmert@telekom.deABSTRACTIn this paper, a novel means of status display in mobilephones is discussed: A permanent tactile heartbeat-likepulsation of the phone. In the study presented, this pulsewas used to let the phone continuously communicate a calmstate of ‘Everything is okay.’ – then, this pulse wassuddenly interrupted, as soon as the phone needed theuser’s attention. We hypothesized that the users wouldinstantly notice the missing pulse.The participants in our study wore the phone for one dayand were interviewed afterwards. Also, a log file about theevents and user responses was kept on the phone.The results suggest that the proposed system is notsufficient as a means of notification; only 55% of the eventswere noticed within the first minute. While some users weresimply annoyed by the pulse, others did like the reassurancethat the phone was ‘present and calm’, but ‘easy to ignore’at the same time. These results indicate that the systemmight be eligible as an ambient status display for mobilephones.Author KeywordsMobile phone, tactile actuation, notification, annoyance,status display, silenceACM Classification KeywordsH5.1. Information interfaces and presentationINTRODUCTIONWhen carrying a mobile phone, the state of ‘not ringing’ iscurrently ambiguous: It might mean that nothing happened,that a call was missed (Fig. 1a), that the phone is off or thatit is simply not there. Mobile phones do not employ aclearly distinguishable state of ‘I’m here, and everything isfine.’.Regardless of where and how the phone is worn, mobilephone users are bound to miss calls sometimes [12] - andthis can lure them into a habit of frequently checking theirphone for missed events. In this context, newpsychosomatic syndromes have been described, phantomringing (or ‘ringxiety’) and phantom vibrations(‘vibranxiety’) – which points out the often problematiccharacter of current mobile phone information systems [8,16].In on-the-go interaction, the audiovisual senses are oftenbusy, or simply not applicable as a channel of interaction,and so utilizing the modality of touch is promising:Tactility and proprioception have come to special attentionin mobile interaction design.RELATED WORKExisting research has investigated different ways ofvibrotactile, surface- and shape-based information designfor mobile devices: Brewster, Brown et al. proposedTactons [3] to convey information to the user throughvibrotactile patterns; in order to create a feeling for who iscalling [4]. Horev [11] proposed dynamic haptic icons on adevice’s surface, while the FlashBag USB stick and theDynamic Knobs phone [10] change their shape according totheir internal status. However, none of these systems caneasily be realized using existing mobile phone hardware. Asimple system that utilizes the common vibration motor istherefore desirable.Some existing mobile phones ([15], e.g.) have the feature tovibrate every 5 minutes after a missed call – however, thisleaves the problem unsolved for the time remainingbetween these reminders: During this time, the phone issilent, and still requires to be checked.Other recently released mobile phones [14] feature a buttonfor a ‘tactile echo’ of the phone: When the button is140
pressed, the phone will vibrate in a certain pattern,depending on its state (short vibration = nothing happened,two short vibrations = text message, one long vibration =missed call, etc.). While the principle itself is very efficient,as the phone can be checked through the pocket, thecognitive effort to read ‘decode’ the vibration pattern is stillconsiderably high.Investigating a system based on patterns that we understandinherently, and cognitively effortless, might be worthwhile,especially in the age of distraction, interruption andinformation overload [1, 2, 7]. Therefore, we recentlyproposed a system that uses a calm and a excited pulse as ameans of status display for missed events on the mobilephone [9].The concept of a ‘living’ mobile phone is based on thehypothesis that as social beings, we are inherently able tointerpret signs of life. For example, psychological researchhas shown that children are able to categorize living andnon-living objects already in early phases of theirdevelopment [6, 17, 18]. What was in question was if anambient information system could be based on theseinstinctive abilities.The difference of this study to its predecessor [9] (Fig. 1b)is that in this case, the pulse would not switch into an‘excited’ mode upon a missed event, it would instead stop(Fig. 1c). Because of the user comments in the previousstudy, we hypothesized that the users would instantly takenotice of the missing pulse: They reported a ‘gap’ whenthey took the phone out of their pocket in the evening.PROTOTYPE AND USER STUDYThe prototype in our study consisted of a Sony EricssonW880i mobile phone, which was running a Javaapplication: The software continuously generated short,pulses on the phone’s vibration motor. For every heartbeat,which occurred every 800ms, the vibration motor wasactivated twice in a short sequence, resulting in the classicalheartbeat rhythm.Fig. 1: Vibration occurrence and intensity in a)traditional notification; b) the calmness/excitementbasedsystem [9]; c) the system discussed in this paper(stopped pulse signalizes need for attention)The intensity of the vibration could be adjusted by theusers. The available strength reached from very subtle beats(‘ticks’, resulting from less than one rotation of thevibration motor) to distinct, repetitive ‘vibration motorvibrations’ (multiple rotations of the motor). The heartbeatlikerhythm, however, was existent for all intensities.The default intensity was a 50ms activation of the vibrationmotor, resulting in a subtle force, comparable to a gentletouch of a finger. According to another study, this is a‘comfortable’ [13] intensity for tactile actuation.We conducted a qualitative user study with 6 users (3f, 3m,22-33 yrs.). We used video interviews and user observationthrough log files on the phones as our methods of inquiry.The software simulated a missed event and stoppedgenerating the pulse at some randomly selected point oftime (with a minimum distance of 10 minutes between theevents), which was written to a log file. The users wereasked to push the ‘OK’ button on the phone as soon as theynoticed that the pulse hat stopped (to ‘reanimate’ it). Noother cues for the event, like ringing or traditional vibrationalert, were given. All subjects were familiar with the devicealready, as they took part in the previous study [9] as well.The users wore the phone for one day, and all users woretheir own mobile phones in addition.The users were encouraged to keep a diary of their activitieswhile carrying the phone, with special regard to situationsin which using the functionality would be different than inothers (e.g. in a library, as opposed to at a concert).RESULTSThe users reported that the suitability of the functionality asa means of notification depended on the strength of thevibration and the situation they were in – sometimes, theywould just miss it when it is not strong enough. At the sametime, the stronger the vibration was, the more annoyingthey found it. Most users stated that they were able toignore the pulse at low intensities, and shift their attentionto it to check it ‘on demand’. At higher intensities, thesystem was mostly found to be “very annoying”. Usersreported that they were well able to perceive the pulse whilesitting in a calm environment, and were hence able to reactto its sudden end. While walking, they were not able to feelthe pulse, and had to ‘check’ for it by grasping the phonethrough or in the pocket.Some users particularly enjoyed that either ‘everything wasfine’, or, be it ‘because of a missed event’ or ‘because I didnot wear it close enough’, it required them to do something.Silence, in this system, is never good.Users stated that they found it difficult to immediately reactto the death of the phone and that they often had the feelingof being ‘too late’. They also reported an ‘inverted phantomvibration’, in which they thought the phone had stoppedbeating, but it had not. Overall, the users felt that they werenot really good reacting to the stopped pulse, and estimatedthe average common time to be about five minutes. Theyreported that when they checked their phone, which wasoften ‘accidentally’, that it was often dead already,presumably for a longer time.141
The log files revealed the actual reaction times (to a totalnumber of 194 events): 19% of the responses occurredwithin the first 10 seconds, 44% within the first 30 seconds.55% of the responses to a stopped beat occurred in the firstminute after the event (Fig. 2). After 10 minutes, 90% ofthe events were confirmed.DISCUSSIONMany users in our test group were quickly annoyed by thepulse, only few got used to it. Similar to the previous study,the pulse was found to be more annoying in silentsituations, while it was rated ‘easily ignorable’ and‘helpful’ in busy situations.The permanent tactile stimulation that the system producedwas helpful for the users to be aware of their tactile contactto the device. For people in special user groups (e.g.,emergency doctors or security staff) that have to bepermanently sure that their network reception, batterystatus, etc. are fine, that they have no calls missed, and thatthey have not lost tactile contact with the device, such aongoing reassurance could be helpful.A result of only 19% recognition rate within the first 10seconds and 55% within the first minute is not sufficient fora notification system. Instead, it seems more plausible touse the system as a permanent status display.Even though the task ‘When the heartbeat stops, press thecenter button to reanimate it.’ was plausible to the users,they did not state that they treated or perceived the phone asa pet: While the metaphor of the ‘living phone’ was clear, itis still uncertain if a non-lifelike stimulation would haveproduced different results.Fig. 2: User response times to interrupted pulseInterestingly, the users stated that they ‘just accidentally’looked at the phone when they discovered that the pulse hadstopped. It is, however, unlikely that every user accidentallychecked the phone every minute. What might be possibleinstead is that they took notice of the stopped pulsesubconsciously. It has been argued before that somedecisions are largely based on external subconscious cues,even though they feel like free will [5].Permanent life-like tactile actuation as we propose it shouldbe looked at critically: We do not know the bodily andpsychological consequences of a continuous externalheartbeat – nonetheless, we think that it is a worthwhileundertaking to study it.CONCLUSIONThis research cannot answer the question of whetherpermanent information should be preferred over permanentchecking. Still, a status display like the one proposed mightbe suitable for users that need permanent reassurance abouttheir phone’s status.People that show addictive behavior to their mobile phonesshould also be taken into consideration. The permanentstimulation might satisfy their need to be in touch with thephone, but in terms of addiction, it might make thingsworse.This study contributes to the ongoing research in tactilemobile interaction design. The proposed system cannotreplace traditional notification and status display systems,but investigating permanent systems is worthwhile: Howcan users be comfortably informed, and should thisinformation occur in bursts, or in a stream?FUTURE WORKMost of the subjects in this study asked for an invertedprinciple: Silence, when nothing has happened – and asubtle, yet perceivable pulse after a missed event. This willbe investigated in a future study.Clearly, a long term study is needed, that examines thecosts and benefits of permanent tactile actuation in mobilephones. What needs to be investigated as well is whetherlife-like movements are indeed more suitable in theproposed case than non-life-like movements. In thiscontext, it would also be important to find out how therelationship to the device changes when it behaves like aliving being.It could also be thought of externalizing the actuator fromthe phone: Users that do not maintain body contact withtheir phone (e.g. when wearing it in a bag) would probablyprefer an externalized version.Ultimately, this project aims to create a ‘gut feeling’ for thephone; Users should not have to think about checking theirphones. Until that point is reached, we face the ambiguityof silence in mobile phones: No news is no news.REFERENCES[1] Piotr D. Adamczyk and Brian P. Bailey. If notnow, when?: the effects of interruption at differentmoments within task execution. In CHI '04: Proceedings ofthe SIGCHI conference on Human factors in computingsystems, pages 271–278, New York, NY, USA, 2004. ACMPress.[2] Brian P. Bailey, Joseph A. Konstan, John V.Carlis. The Effects of Interruptions on Task Performance,Annoyance, and Anxiety in the User Interface. InProceedings INTERACT ’01, pp. 593-601, IOS Press, 2001.[3] Stephen Brewster and Lorna M. Brown. Tactons:Structured Tactile Messages for Non-visual InformationDisplay. In CRPIT '04: Proceedings of the fifth conferenceon Australasian User Interface, pages 15–23, Darlinghurst,Australia, Australia, 2004. Australian Computer Society,Inc.142
[4] Lorna M. Brown and Topi Kaaresoja. Feel Who'sTalking: Using Tactons for Mobile Phone Alerts. In CHI'06: CHI '06 extended abstracts on Human factors incomputing systems, pages 604–609, New York, NY, USA,2006. ACM.[5] Ronald J. Burke, Norman R. F. Maier, andRichard L. Hoffman. Functions of Hints in IndividualProblem-solving. The American Journal of Psychology,79(3):389–399, 1966.[6] Alfonso Caramazza and Jennifer R. Shelton.Domain-specific Knowledge Systems in the Brain: TheAnimate-inanimate Distinction. J. Cogn. Neurosci.,10(1):1–34, January 1998.[7] Edward Cutrell, Mary Czerwinski and EricHorvitz. Notification, Disruption and Memory: Effects ofMessaging Interruptions on Memory and Performance. InProceedings of the CHI 2000 conference on Human factorsin computing systems, Extended Abstracts; New York:ACM Press: 2000.[8] Angela Haupt. Good Vibrations? Bad? None atall?, USA Today, June 12 th , 2007.http://www.usatoday.com/news/health/2007-06-12-cellphones_N.htm[9] Fabian Hemmert and Gesche Joost. Ambient Life:Calm and Excited Pulsation as a Means of Life-likePermanent Tactile Status Display in Mobile Phones. InProceedings of the Design & Emotion Conference 2008,Hong Kong (in press), 2008.[10] Fabian Hemmert, Gesche Joost, André Knörig,and Reto Wettach. Dynamic Knobs: Shape Change as aMeans of Interaction on a Mobile Phone. In CHI '08: CHI'08 extended abstracts on Human factors in computingsystems, pages 2309–2314, New York, NY, USA, 2008.ACM.[11] Oren Horev. Tactophone. 2006.http://slide.nu/blog/?p=7[12] Fumiko Ichikawa, Jan Chipchase, and RaphaelGrignani. Where's the phone? A Study of Mobile PhoneLocation in Public Spaces. 2nd International Conference onMobile Technology, Applications and Systems, pages 1–8,2005.[13] Topi Kaaresoja and Jukka Linjama. Perception ofshort tactile pulses generated by a vibration motor in amobile phone. In WHC '05: Proceedings of the First JointEurohaptics Conference and Symposium on HapticInterfaces for Virtual Environment and TeleoperatorSystems, pages 471–472, Washington, DC, USA, 2005.IEEE Computer Society.[14] NEC Mobile FOMA n904i,http://www.n-keitai.com/n904i/[15] Motorola. RAZR ,http://direct.motorola.com/hellomoto/razr/[16] Joe Orso. Who's calling? is it your leg or your cellphone?, Columbia News Service, May 2005.[17] Sabina Pauen. Early Differentiation Within TheAnimate Domain: Are Humans Something Special? Journalof Experimental Child Psychology, 75(2): 134–151, 2000.[18] Brian Scassellati. Discriminating animate frominanimate visual stimuli. In Proceedings of theInternational Joint Conference on Artificial Intelligence,pages 1405–1410, 2001.143
Stay-in-touch: a system for ambient social remindersEugene Kenny, Ross Shannon and Aaron QuigleySystems Research GroupSchool of Computer Science & InformaticsUCD DublinIrelandross.shannon@ucd.ieABSTRACTSocial interactions among a group of friends will typicallyhave a certain recurring rhythm. Most people interact withtheir own circle of friends at a range of different rates, andthrough a range of different modalities (by phone, instantmessaging, face-to-face meetings etc.). When these naturallyrecurring interactions are maintained effectively, people feelat ease with the quality and stability of their social network.Conversely, when a person has not interacted with one oftheir friends for a longer period than they usually do, a problemcan be identified in that relationship which may requireaction to fix. We present Stay-in-touch, an ambient informationsystem which provides peripheral cues to the user whichserve as occasional recommendations of which of their friendsthey should contact soon in order to keep their socialnetwork in a healthy state.Author KeywordsAmbient displays, reminder systems, information visualisation,social networks analysis.INTRODUCTIONWhen modelling the social interactions among a group offriends, a certain recurring rhythm is identified, which willdiffer between social groups. Within this group, a single personmay have a range of different rhythms with each of theirfriends, due to the similarity of their schedules, the differingstrengths of those friendships, and a range of other socialfactors. When these rhythms are maintained well — that is,the person interacts with that friend at the regularity that theynormally do — the health of that friendship will feel natural.If on the other hand the friendship falls out of rhythm,through neglect or unfortunate circumstance, and the twopeople do not see each other or otherwise interact, this gapwill be felt, though perhaps not always understood.A person’s “social rhythm” describes the rate and regularitywith which they interact with the various people they know.In this regard it is a fuzzy metric; if asked how often you interactwith a certain friend of yours, you will probably replywith “about twice a week” or “most days”, not something like“once every 37 hours”. Stay-in-touch is an application wehave developed to notify a user when it detects a lull in oneof their social connections. It does so by analysing their socialinteraction history through data gathered from a multitudeof sources, and attempting to quantify their social rhythm.A person’s ability to regulate their own social rhythm relieson their perception of time running like clockwork, but thehuman mind’s perception of the passage of time is capriciousat best [5]. Numerous studies have pointed to the fallibilityof this ability [3, 14]. Without external prompts, keeping upwith friends — especially peripheral friends, who are notpart of one’s close social circle — can become a matter ofchance and circumstance. Because social interactions are inherentlyvague and intuitive, there is no single point in timeat which one is motivated to rekindle a dwindling friendship.For this reason we believe that explicit cues based on historicallyobserved rhythms would help in this area, while stillfeeling natural and unforced.Stay-in-touch provides the observer with suggestions of actionsthey can take to maintain the stability of their socialnetwork through a visual interface. This encourages users tocontact their friends regularly, but also helps them to identifyproblems with certain friends early, so that they can takesteps to correct a deviation before it becomes more pronounced.Thus, if a user tends their network well, they will havestronger ties with a wider and more diverse set of friends.We are particularly interested in studying the effectivenessof these social reminders in the context of calm computing,as defined by Weiser [15]. Our intuition is that oftentimes itis an artefact that you come across arbitrarily which spursyou into contacting a friend about something. For example,seeing a photograph of you and a friend may prompt you totalk about an experience you shared. It is along these linesthat we seek to provide subtle reminders of a friend at theright time, to lead a user into reestablishing contact. If theuser can ignore the system when all is well in their socialnetwork, they will be more likely to engage with it when anissue does arise. Conversely, if the system demands attentionat too frequent an interval, the user may become frustratedand begin ignoring notifications. Finding the ideal balancebetween avoiding interrupting the user’s workflow and effectivelyproviding information when it would be beneficialwould provide valuable insights into how a busy person’sattention is divided.In the next section we will describe some social networkanalysis research that is relevant to this project, followed bya discussion of the the design of the system we have built.Next we discuss the applicability of this type of data to ambientinformation systems and describe how we could evaluatethis sort of system.144
SOCIAL NETWORK ANALYSISPrevious studies have analysed social rhythms in sociotechnicalsystems, although the focus of these studies wason the general trends of social rhythms apparent on a largescale. Golder et al. studied interactions between collegestudents over the social networking site Facebook, andfound that students’ social calendars were heavily influencedby their school schedule [12]. Leskovec et al. analysed allconversations conducted over Microsoft’s Messenger instantmessaging service in the month of June 2006, and concludedthat users of similar age, language and location were most likelyto communicate frequently [7].“Dunbar’s number” is a proposed upper bound to the numberof people an individual can maintain stable social relationshipswith. Among humans, this bound stands at approximately150, and is due to the cognitive overheads involvedin remembering and being able to meaningfully interactwith others [4]. Although social networking applications havelong allowed users to have many more than this numberof “friends” identified within the system [2], it is unlikelythat a user would report that they are friends with all of thesepeople in the traditional sense [1].Online social networking sites are generally used to maintainsocial connections which were originally forged offline[10]. These websites present a low-cost way for people tostay in contact with a wide array of friends and acquaintances.Combined with temporal reminders, sites like Facebookare an ideal avenue through which to evolve, maintain andreenforce a user’s social circle.That said, a person’s social network cannot be described bydata from any one source. Though the majority of a user’sfriends may indeed be present in an online social networkingwebsite, they will also have friends that they interact withpurely offline, or mostly by phone or email. These ongoingsocial interactions are equally valid in characterising a user’scircle of friends.VISUALISING SOCIAL INTERACTIONSThere have been many visualisations generated of social networks,particularly since the rise of social networking websitesand the rich data sets they present. Many visualisationsuse a familiar node-link diagram of a graph [6]. These visualisationswill often present the graph from an “ego-centric”perspective, where the user being analysed is shown at thecentre of the view, with their friends arrayed around them.In this project, because we are not interested in the networklinks that exist between friends, we can dispense with thisnetwork view, and focus on the strength of the connectionsbetween a user and their immediate network of friends.A weakness we have identified with existing network visualisationsis that they treat all edges in the network as beinguniformly-weighted. That is, an edge is either present or notpresent; there is no gradation to the strength of each link,and all links are drawn with equal length. In real life, weknow that friendships do not behave like this. The sociallinks between people become weaker over time and growstronger through positive interactions. We wish to visualisethese details of the network from a single user’s perspective,and allow them to answer questions about the health of theirnetwork at a glance.Data SourcesAmbient systems can leverage the vast amounts of dataavailable from the physical and virtual worlds. We now leavedigital traces of most of our social interactions: all of ouremail is archived on a server somewhere, our instant messagesare logged locally and remotely, posts to social networkprofiles are publicly visible, and so on. Even co-location datacan be recorded if the users both wear a tracking deviceof some kind, allowing the identification of events like twopeople conversing in a research lab.Though all of this data is attractive, for this first version ofthe Stay-in-touch system, we decided to focus on records ofmobile phone interactions, which we are able to access fromour telecommunication provider’s website. The software hasbeen built to be agnostic to the nature of the interactions, soadding support for emails in future, for example, is a matterof writing a small client to parse the user’s inbox andfind mails that they have sent or received from their friends.These, along with other discrete interactions, can then be enteredinto the system.The visual displayOur visualisation is built using Processing [11], a Java-basedvisualisation framework which supports rapid prototyping ofvisualisation techniques.Stay-in-touch presents a time series plot, visible in Figure1. Each row represents a person’s social interactions withone of their friends, showing mobile phone interactions; bluedots indicate phone calls, with the size of the dot reflectingthe length of the call, while red dots indicate text messagesand are uniformly-sized. Weeks are subtly delineated bydiffering background colours to provide users with an indicationof their longer-term habits at a glance.The current day is highlighted, and the next week is visibleon the right of the display. Cues for future interactions aredisplayed in this area in the form of hollow circles. Theircolour and size indicate the type of interaction suggested,based on a prediction algorithm that we have written for thispurpose. Predicted social interactions are drawn on the daythat our algorithm has calculated to be most likely for themto occur, but the user can see them a week in advance. Thisgives the user several opportunities to act on the informationbeing presented to them at an appropriate time.If the user does not interact with their friend in any way beforethe suggested interaction , an “X” is marked at this positionand this is counted as a “miss”. The prominent markingof these events (or non-events, if you will) serve to draw theuser’s attention to these more critical cues.145
Figure 1. The Stay-in-touch display, showing a record of a user’s interactions with a subset of their friends. Blue circles are phone calls; the size ofthe circle reflects the length of the call. Red circles are SMS text messages. Suggested future social interactions are indicated by hollow circles on theright, giving the user time to act on those suggestions when it is convenient.AT ODDS WITH AMBIENCENeely et al. have previously explored their hypothesis thatsome context sources are more applicable to being presentedin an ambient manner than others [9]. The reasons theydescribed are precision, criticality, periodicity, interpretabilityand self-descriptiveness.We add to these three properties of the system’s primary outputwhich we think make it a good candidate for applicationin an ambient display — the reminders are passive, temporaland simple. Passive means that changes in the informationdo not always require immediate attention; users can takenote of reminders but choose not to act on them until later.Temporal means that the data changes over time; if the displayremains at the periphery of a person’s attention, theycan monitor for changes while concentrating on other activities.Simple means that the information can be digested easily;at a basic level, a reminder simply consists of the nameof a friend who they should contact soon. Other informationmay be present, such as a suggested contact time or medium,but this only serves to augment the primary information.These three properties correspond well to the interaction,reaction and comprehension model proposed by Mc-Crickard et al. [8]. Not all notification systems are as wellsuitedto an ambient implementation. Consider as a counterpointthe visualisation an air-traffic controller uses to directplanes at an airport. It satisfies none of the above criteria: theinformation requires immediate response, as planes must begiven clearance to land or take off as quickly as possible;while the data does change with time, typically while thereis any activity it is in a constant state of flux, and must bemonitored constantly; and there are typically a huge numberof variables to take into account for each notification, suchas the plane’s location, scheduled departure/arrival time, currentvelocity, etc. It would of course be possible to create anambient display which delivers information about planes arrivingand leaving an airport; while passengers might findthis interesting and informative, air-traffic controllers wouldhave no use for it.This example highlights the fact that only certain classesof notifications suit application as an ambient display. Thisleads us to our key question: to what degree can remindersand notifications be incorporated into ambient systems, beforethe notion of calm computing is rendered meaningless?FUTURE APPLICATIONSThe implementation described above could be used as bothan interactive display, where a user filters the informationprocessed by the system manually to achieve insights intotheir social trends, or as a information display, which allowsa user to passively get a feel for the general health of theirsocial environment in an instant. However, the application ofthe Stay-in-touch model to a more inherently ambient solutioncould take a radically different form. An example of suchan ambient display in the area of social information is theWhereabouts Clock developed at Microsoft Research [13].This is a glanceable ambient display placed on a wall in ahome, which displays the current location of all of the membersof the family. One could imagine a similar display forthe Stay-in-touch model, which displays a collection of avatarsrepresenting some of the user’s friends. The health ofthe social connection for each friend could be indicated ona danger scale — green meaning the relationship is growingin strength, yellow indicating no change and red suggestinga decline in the frequency of interactions.Since the critical information output for the user — remindersindicating when a friendship is stagnating — is atomicand relatively simple, it could be used in conjunction with anumber of lo-fi data delivery methods. The user could subs-146
cribe to receive suggestions as text messages on their mobilephone, or through email or twitter tweets, informing them ofthe person they need to catch up with. There is also the possibilityof using small personal devices, such as the Chumbyor iPhone, to allow more convenient access to reminders andprovide a simplified version of the main visualisation.FUTURE EVALUATIONWe see an ideal evaluation of the system as a diverse userbasedstudy; one would record the suggested social interactiontime and type and along with the actual time that the personnext contacted the friend in question. This data wouldbe collected over a sustained period, and two parallel setsof social interaction data would emerge; the smaller the discrepancybetween these two data sets, the more helpful thesystem is. A control group would be made up of a subset ofthe testers who would have their social interactions predictedas normal, but not shown to them. If the average differencebetween prediction and interaction is much lower for the informedgroup, then this would suggest that not only are thereminders influencing those users’ social habits, but that theyare promoting a more regular and sustained social rhythm.In addition, if the study was administered to several groupsof people, each with different levels of notification, we couldget a good idea of when adding more frequent notificationsor more vivid animations stopped being helpful and startingbeing distracting.CONCLUSIONSWe have presented Stay-in-touch, which presents ambientinformation to a user based on the interactions that they havewith members of their social network, and suggest howthis kind of information can help a user to keep their socialnetwork in a healthy state. Given sufficiently careful treatment,infrequent notifications can become a useful additionto an ambient display. We have postulated that certain traitsare desirable in an ambient reminder system; these are a longpossible response time, variance in the timing and meaningof reminders, and simple, easy to interpret reminder information.Only extensive user testing can confirm that thesequalities give an indication of the suitability of a type of reminderto ambient systems.Acknowledgements: This work is supported by ScienceFoundation Ireland through an Undergraduate Research Experienceand Knowledge grant (UREKA), and under grantnumber 03/CE2/I303-1, “LERO: the Irish Software EngineeringResearch Centre.”REFERENCES1. D. Boyd. Friends, friendsters, and myspace top 8:Writing community into being on social network sites.First Monday, 11(12), 2006.2. D. M. Boyd and N. B. Ellison. Social network sites:Definition, history, and scholarship. Journal ofComputer-Mediated Communication, 13(1):article 11,2007.3. B. R. Chavez. Effects of stress and relaxation on timeperception. Master’s thesis, Uniformed Services Univ.of the Health Sciences, Bethesda MD, 2003.4. R. Dunbar. Neocortex size as a constraint on group sizein primates. Journal of Human Evolution, 20:469–493,1992.5. C. Harrison, B. Amento, S. Kuznetsov, and R. Bell.Rethinking the progress bar. In UIST ’07: Proceedingsof the 20th annual ACM symposium on User interfacesoftware and technology, pages 115–118, New York,NY, USA, 2007. ACM.6. J. Heer and D. Boyd. Vizster: Visualizing online socialnetworks. infovis, 0:5, 2005.7. J. Leskovec and E. Horvitz. Worldwide Buzz:Planetary-Scale Views on an Instant-MessagingNetwork. Technical report, Microsoft Research, June2007.8. D. S. McCrickard, C. M. Chewar, J. P. Somervell, andA. Ndiwalana. A model for notification systemsevaluation—assessing user goals for multitaskingactivity. ACM Trans. Comput.-Hum. Interact.,10(4):312–338, 2003.9. S. Neely, G. Stevenson, and P. Nixon. Assessing theSuitability of Context Information for AmbientDisplay. In Workshop on Designing and EvaluatingAmbient Information Systems, 2007.10. C. L. Nicole B. Ellison, Charles Steinfield. The benefitsof facebook “friends:” social capital and collegestudents’ use of online social network sites. Journal ofComputer-Mediated Communication,12(4):1143–1168, 2007.11. C. Reas and B. Fry. Processing: a learning environmentfor creating interactive web graphics. In SIGGRAPH’03: ACM SIGGRAPH 2003 Sketches & Applications,pages 1–1, New York, NY, USA, 2003. ACM.12. D. W. Scott A. Golder and B. A. Huberman. Rhythmsof social interaction: Messaging within a massiveonline network. In 3rd International Conference onCommunities and Technologies (CT2007), June 28-302007.13. A. Sellen, R. Eardley, S. Izadi, and R. Harper. Thewhereabouts clock: early testing of a situatedawareness device. In CHI ’06: CHI ’06 extendedabstracts on Human factors in computing systems,pages 1307–1312, New York, NY, USA, 2006. ACM.14. M. Stine, R. O’Connor, B. Yatko, N. Grunberg, andL. Klein. Evidence for a relationship between dailycaffeine consumption and accuracy of time estimation.Human Psychopharmacology: Clinical andExperimental, 17:361–367, 2002.15. M. Weiser and J. Brown. Designing Calm Technology.PowerGrid Journal, 1(1):75–85, 1996.147
User Generated Ambient PresenceGermán Lado Insua 1,2 Mike Bennett 1 Paddy Nixon 1 Lorcan Coyle 11Systems Research GroupSchool of Computer Science & InformaticsUniversity College Dublin, Ireland2National University of Distance Education, Spaingermanlado@gmail.com, {mike.bennett, paddy.nixon, lorcan.coyle}@ucd.ieABSTRACTPresence is an important part of our day to day lives. Oftenwe will have a sense of who is around us and what theyare doing by the sounds of doors closing, cupboards banging,footsteps on floors, voices vaguely heard through walls,etc. In digital spaces, such as GUI desktops, presence enhancesour sense of connection with geographical separatefriends and colleagues. In this paper we report on AmbientJewelry, which is a project exploring the intersection ofindividual and user generated customization with ambientpresence displays. With this research we are seeking techniquesthat enable people to invent, discover and find newforms of ambient presence visualisations.Categories and Subject DescriptorsH.5.2 [Information Interfaces and Presentation]: UserInterfacesGeneral TermsPresence, Ubiquitousness, HCI, Instant Messaging, CommunicationPatterns, Digital Presence1. INTRODUCTIONAmbient Jewelry is a work-in-progress project that exploresthe intersection of individual and user generated customizationwith ambient presence. The aim is to enable the creationof more personal and richer forms of ambient presence,with the aspiration that this will allow us to more deeplyconnect with our friends and family in a non-intrusive manner.Within this project we used small rounded windowsthat we call Jewels, to display the User activity. An exampleof this Jewels can be seen on Figure 1.Awareness of presence is an important part of our day to daylives. Often we will have a sense of who is around us andwhat they are doing by the sounds of doors closing, cup-Figure 1: Examples of three different Jewels.boards banging, footsteps on floors, voices vaguely heardthrough walls, etc. In digital spaces, such as GUI desktops,presence enhances our sense of connection with geographicalseparate friends and colleagues. For example when you usean Instant Messaging (IM) client you see which friends arecurrently online or away, and when engaged in IM chat youare also told whether the people in the conversation are typing.On social network sites, such as Facebook, presence hasa more explicit form. We are told what the people in oursocial network did, e.g. Mark joined the Ireland network,Germán and Mike are now friends.As of yet presence representations, such as in Instant Messagingclients, rarely enable us to control how our presenceis represented. We cannot decide to design colourful Jewelsrather than virtual flowers (ambient presence avatars) thatspin on our friend’s desktops to show how fast we’re typing.Nor can we create the relationships between arbitrarily designedpresence avatars and how transforms of the avatarsencode actions.The representation of presence tends to be specified by thedesigners of the presence systems. A designer decides thatcolourful squares on a desktop cube are suitable for representinga remote friend’s movement, while another designerdesigns a presence representation where an artificalflower opening means a friend is walking into a distant room,or flowing water represents variations in currency exchangerates [10].Within the project we took an open design approach. Thatis we acknowledge that users may be better suited to inventingpresence representations to suit their needs, social statusand social connectedness. There are two different roles forusers to design and personalise Ambient Jewelry presence:1. The Creator of an Ambient Jewel: They design anAmbient Jewel to fit their likes, e.g. they create theinitial graphical design of a Jewel from a family pho-148
tograph (static content). Then they make the Jeweldynamic by setting up how the graphical look of theJewel changes based on their actions, e.g. type fastand Jewel blinks fast.Once a Creator has made a new Jewel they may shareit with their friends. When a Jewel is shared withfriends it is sent to the friend’s remote desktop GUIs.When a Jewel is shown on a desktop it continues changingbased on the Creators remote actions.2. The User of Ambient Jewels: The User is the personwho receives the Jewel and who sees it visually changingon their desktop.The design process still continues with the User becausethe User is able to use their friends’ Jewels todecorate their desktop. A User with more Jewels hasmore options to arrange them into aesthetically andartistically appealing patterns, shapes and clusters.In this paper we outline our framework for and approach toenabling Users to become designers of their ambient presencedisplays. We are especially interested in understanding howthe Users of a Jewel perceive the Jewel Creators actions.By introducing sharing of the ambient displays we are indirectlyforcing Users to reflect on their meanings. Will groupsof friends converge and create the same style of Jewels, almostforming a shared ambient display graphical languagethat is specific to their group or community? Or will certaingraphical representations and Jewel transforms emergeacross all Users, because they make ”sense” in an ambientdisplay?We are aware of the possible disturbing effects that could becreated by people (especially by blinking and other distractingeffects). The base effects are smooth and slow, but Usersare allowed to alter and speed them up using modifiers. Weconsider interesting what the outcome of these broader limitsmay be. Will users tend to create disturbing effects? Orwill they socially agree not to use them?With this research we are seeking techniques that enablepeople to invent, discover and find new forms of ambientpresence visualisations.2. BACKGROUNDPresence and Ambient Displays have been explored in manyinnovative research projects [2, 11, 8]. For example Info-Canvas is an implementation of a user customizable ambientdisplay where users can design the contents of the ambientdisplay as part of information art[7]. Another similar displayis Scope [9], which consists of small iconic representationsbased on notifications.There are numerous different approaches to digital presenceawareness. In Prior et al. tell us about an interfacethey created based on metaphors of the real world to helpolder adults understand the concept of Instant Messaging[6]. While Kranz et al. [4] created a novel physical deviceto share our on-line status.Figure 2: Examples of two different Jewels changing.BuddyBeads[3] is an example of research into creating physicalJewels that represent different emotions as non-verbalmessages.Another interesting example is Ambient Furniture that connectstwo geographically separated family tables, e.g. placea cup on one table and a vague outline of the cup appearson the other table [5].Studies have shown how the design of Instant Messagingcommunication software affects interpersonal relationships[1]. From these studies we understand how technology canbe redesigned to improve human communication and connectedness[11].Based on the results of the preliminary discussions from [6]we understand that some participants got confused by theconcept of an unrelated picture (avatar) representing themor their fellow participants. The same issue applies to AmbientJewelry, since each user is able to create a unique Jewelwith unique changes based on what they do and what theywant to represent. We discuss this further in Section 4.3. AMBIENT JEWELRY OVERVIEWAmbient Jewelry consists of a cross-platform framework thateasily lets people create and share their presence avatars.These avatars, which we have called Jewels, consist of smallshaped windows of approximately 20-100 pixels. The Jewelsallow the display of people’s actions on their friends andcolleagues’ computers. So if a friend of mine has my Jewel,he will be able to know if I am connected, typing, or movingthe mouse about. Furthermore, he will know I am doingsuch actions by watching what my Jewel does on his desktop.For example, I could design my Jewel to visually fadewhile changing color to red in order to display that I amreally busy typing with my keyboard. There are many moreactions that can follow the scheme:ACTION -> EFFECTVisually fading a Jewel is like this:Typing -> Fade-RedOther possible actions include:Open-Windows->SparklingMouse-Movement->RotationListening-Music->Blinking3.1 INTERFACEThe main Ambient Jewelry program consists of:Jewels (Figure 2): Shaped display windows that representother people’s presence. They are placed on the desktop.149
Figure 3: Cross-platform system tray applicationicon with menu (Linux, Windows and MacOS).Figure 5: Design Tool window for creating Jewels.Figure 4: Jewel Manager window for managing Jewels.This is the part of the Ambient Jewelry software with whichthe User of Ambient Jewels interact with. Each Jewel hasits own window.System Tray Icon (Figure 3): This icon is the controlpoint for all the other windows. Through it the User canaccess the different functions of the software via the popupitem menu. Even if no Jewels are being displayed on thedesktop the software runs in server mode gathering actiondata (e.g. mouse movement) and sending it to client Jewels.When the System Tray icon is used to quit remote Jewelsstop getting updated.Jewel Manager (Figure 4): Displays the list of Jewelsavailable in the system. The Jewel Manager allows a Userto carry out management tasks such as the installation ofnew Jewels, or adding Jewels to or removing Jewels fromthe desktop.Design Tool (Figure 5): Allows the Creator to build, customizeand modify their Jewels. In this window they candesign a Jewel or assign the actions to the graphical transformationsapplied to a Jewel. In order to achieve this, thewindow consists of different options such as sliders to controlthe amount of time, color and different movements (transformations,rotations, shakes, etc.) applied to graphics thatrepresent actions.Jewel Desktop Layout (Figure 6): A major feature ofAmbient Jewelry is that it enables Users with Jewels on theirFigure 6: Example of several Ambient Jewels laidout on the center of a KDE desktop.desktops to create formations, patterns and designs withthem. By doing this the User could create their own formof ambient display consisting of other people’s customizedJewels (ambient displays). We are aware of the possiblecomplexity this system could have when loading a considerableamount of Jewels. In order to enhance the learningcurve of who owns each Jewel, we are debating displayingeach owner’s name and action performed in small tags whena Jewel is clicked.The idea of aggregating customization of others customizationopens another facet of user customization. We are planningon expanding Ambient Jewelry to allow the User topersonalize his own actions with other people’s Jewel basedformations. This can be thought of as an Object Orientatedstyle inheritance of ambient displays. Another optionis to include some physical interaction algorithms so as tolet the Jewels get sticky with each other, or allow them tomove and interact with other Jewels. With these featureswe could provide a totally customizable interface from theUser and the Creator’s point of view.Example of use:1. Creator: Creates their Jewel by using the Design Toolwith the effects:Mouse-movement->RotationNumber-of-Windows-Opened->SparklingAway-From-Computer->Fade150
Keyboard-Typing->Smooth-BlinkingWhen finished designing the Jewel the Creator savesthe creation to a *.GEM file that stores all the data.The Creator sends the GEM file to one of their friendsvia email, instant messaging, or through the networkcommunication layer between Ambient Jewelry clients.2. User of Ambient Jewels: Receives the *.GEM file andchooses to install it into their Ambient Jewelry softwareusing the Jewel Manager window. When installeda new Jewel appears in the list of Jewels - with thestatic representation as an icon. Once installed theUser activates the Jewel by clicking the “open” button.The Jewel appears on the desktop initially as astatic image. After being displayed on the desktop theJewel connects to the remote Ambient Jewelry serverand starts to act following its script of actions (local*.GEM file) when receiving the action data from theremote host.4. DISCUSSIONHow will Users of the Jewels understand what changes in aJewel mean? This raises an important aspect of our research- does Ambient Jewelry lead to discussions aboutJewel meanings (encouraging back channel communicationand socialization)? Also as was mentioned in the Introductionwill a shared ambient display graphical languageemerge? If so how much of that will be due to the expressivenessor limitations of the range of Jewels people cancreate with our software?Users may need help in understanding what their friendsJewel transforms mean. In order to examine this learningcurve issue we are considering having two control Usergroups. The first group would have small tags as part of theJewels, which show keywords about the actions performed,while the second group would have no textual informationabout what Jewel changes mean.When considering the business applications of Ambient Jewelrywe realize that the core funcionality may not be enough.In order to broaden the use of Jewels in professional applicationswe may need to take a different approach to the actionsgrabbed. Multiple actions may need to be mapped to a singlegraphical transform, for example displaying the rhythmof work in a shop by making the Jewel move faster whenmore people come into the shop and buy milk. If we usethis approach, we would create a Jewel linked to a business,not a person, so the Jewel would display the status of theshop. A potential issue with this approach is granularity ofthe ambient display - too many actions and too much informationabout actions may be impossible to meaningfullydisplay in the small display space of a Jewel. This leads tothe question: How can we measure or quantify the graphicalexpressiveness of an ambient display?supported by Science Foundation Ireland under grant number04/RPI/1544 “Secure and predictable pervasive computing”.6. REFERENCES[1] D. Avrahami and S. E. Hudson. Communicationcharacteristics of instant messaging: effects andpredictions of interpersonal relationships. In CSCW’06: Proceedings of the 2006 20th anniversaryconference on Computer supported cooperative work,pages 505–514, New York, NY, USA, 2006. ACM.[2] A. K. Dey and E. de Guzman. From awareness toconnectedness: the design and deployment of presencedisplays. In CHI ’06: Proceedings of the SIGCHIconference on Human Factors in computing systems,pages 899–908, New York, NY, USA, 2006. ACM.[3] R. Kikin-Gil. Buddybeads: techno-jewelry fornon-verbal communication within teenager girlsgroups. Personal Ubiquitous Comput.,10(2-3):106–109, 2006.[4] M. Kranz, P. Holleis, and A. Schmidt. Ubiquitouspresence systems. In SAC ’06: Proceedings of the 2006ACM symposium on Applied computing, pages1902–1909, New York, NY, USA, 2006. ACM.[5] D. Patel and S. Agamanolis. Habitat: Awareness oflife rhythms over a distance using networked furniture.In Adjunct Proceedings of <strong>UbiComp</strong> 2003 FifthInternational Conference on Ubiquitous Computing,Seattle, 2003.[6] S. Prior, J. Arnott, and A. Dickinson. Interfacemetaphor design and instant messaging for olderadults. In CHI ’08: CHI ’08 extended abstracts onHuman factors in computing systems, pages3747–3752, New York, NY, USA, 2008. ACM.[7] J. Stasko, Todd Miller, Z. Pousman, C. Plaue, andO. Ullah. Personalized peripheral informationawareness through information art. In Proceedings of<strong>UbiComp</strong> ’04, pages 18–35, September 2004.[8] N. A. Streitz, C. Röcker, T. Prante, R. Stenzel, andD. van Alphen. Situated interaction with ambientinformation: Facilitating awareness andcommunication in ubiquitous work environments. InTenth International Conference on Human-ComputerInteraction (HCI International 2003), pages 133–137,June 2003.[9] M. van Dantzich, D. Robbins, E. Horvitz, andM. Czerwinski. Scope: Providing awareness ofmultiple notifications at a glance. In Proceedings ofAVI 2002, pages 157–166. ACM Press, May 2002.[10] K. van Mensvoort. Datafountain - money translated towater (http://www.koert.com/work/datafountain),2008.[11] S. Whittaker. Theories and Methods in MediatedCommunication, pages 243–286. Erlbaum, 2003.5. ACKNOWLEDGMENTSThanks to ongoing support from the School of ComputerScience and Informatics, University College Dublin, Ireland.Thanks to ODCSSS, which is part funded by an UndergraduateResearch Experience and Knowledge grant (UREKA)from the Science Foundation Ireland. This work is partially151
The Invisible Display – Design Strategies for AmbientMedia in the Urban ContextDietmar OffenhuberArt University LinzKollegiumgasse 24040 Linz, Austriadietmar.offenhuber@ufg.ac.atABSTRACTThis paper presents contextual strategies for stagingambient interfaces in public space. While ambientdisplays are often treated and evaluated as solitary objectsin existing literature, I will argue that the experience of anambient display is not determined in the first place by itsintrinsic qualities, but essentially by the way how it issituated within its local context.The six described strategies show how cultural notionsand practices can be incorporated into the design ofambient displays. Some of them seem counterintuitiveand take advantage of phenomena that a designer usuallymight want to avoid. At the same time they are aninvitation for further experiments and cross-pollinationbetween the fields of architecture, public art andinteraction design.KeywordsAmbient Media, Contextual Design, Urban InterfacesIntroductionIn the architecture community, the impact of large-scaleoutdoor displays on public space is currently intenselydiscussed. However, the discussion is mainly concernedwith a rather traditional concept of the screen, designed tocapture attention by displaying imagery on a prominentsurface of a building. As a result of this narrow definition,much of the discourse revolves around the notion of thefaçade as an iconographic surface, resembling thediscussions around the “architecture of the billboard”during the 1960’s and 70’s [1]. What is needed is aredefinition of the display, reaching beyond the traditionalnotion of a screen. For this purpose, a rich spectrum ofmethods can be deployed to display information throughphysical means[2].Based on concepts of ambient media, I will try to make anargument for the architecture of the "invisible display", adisplay that is perceived in the background of attentionand blends into the ambience its surroundings. For sake ofsimplicity, I will use the term invisibility for everythingthat we tend to overlook in our daily routine.Ambient displays are architectural interfaces forpresenting information that can be processed in thebackground of attention [3]. For capturing the viewersattention, ambient displays rely on a mechanism oftenreferred to as the Cocktail Party Effect [4]: in the noisyambience of a cocktail party with many voicessimultaneously talking we immediately notice someonementioning our name, while being unable to follow any ofthe conversations.The importance of ContextAlso the discourse among HCI designers about ambientdisplays could benefit from architectural design practice.A considerable body of research has been dedicated to thedescription and evaluation of ambient media, itspossibilities and applications. However, the question ofwhat makes a technology “calm”, especially in the urbancontext, still deserves closer investigation.In existing literature, ambient displays are often treatedand evaluated as solitary objects. Throughout this paper Iwill argue that the experience of an ambient display is notso much determined by its intrinsic, absolute qualities, butessentially a result of its interaction with its surroundingand its references to cultural practices and preconceptions.Most evaluation criteria for ambient displays, such as thedemand for minimizing the cognitive load [5], are relativeand context dependent, and cannot be evaluatedseparately. This is especially true for aesthetic qualities,which are often reduced to the requirement for an“aesthetic pleasing design”, however this might beunderstood. In this paper, the investigation of the ambientwill not be a question of aesthetic judgment, but ratherone of situation.For the interface designer, ambient media poses a numberof challenges, since traditional principles and bestpractices of user interface design cannot be applied,especially in urban public space. Communicating themapping of a data source to an ambient display isconsidered a key problem [6]: what can be solved throughlearning how to read the display on in a privateenvironment, is hardly possible for a general public undurban space.A common strategy to overcome this problem is to reducethe amount of displayed information, down to a binaryvalue that helps with a specific decision, such as whetherto take the umbrella, when rain is to be expected [7]. This152
works well for alerting purposes, but already with asimple range of two colors can make the mappingincomprehensible. The D-Tower, signals the emotionalstate of a city through the colors red and blue [8]. Whatexactly does the color red stand for – is it happiness orrage? It is important to point out that this is not a problemof arbitrary mapping, since signs and language arearbitrary by nature. It is the lack of a common convention.The mappings of ambient displays have to be learned, butagain, what works in a personal application might notwork in public space.Design strategiesIn this paper I will discuss contextual or situationalstrategies for the integration of interfaces into the urbanambience. They address the question how to stageambient displays effectively in the public sphere in aspecific social setting. Some of them are well established,while some seem counterintuitive and exploit phenomenathat a designer usually tries to avoid. The presentedprinciples cover different aspects of the relationshipbetween observer, representation and environment.A. AnimismAnimism is the idea that all things and objects areinhabited by a living spirit. The concept can be found forexample in the visual language of animated cartoons - weare familiar with the notion of signs and inanimate objectssuddenly coming to life. Accordingly, one of the earliestexamples from animation history, dating back to 1906,features a cartoon figure interacting with the cartoonistwhile being drawn [9] - a topic that never has disappearedever since. In this case, invisibility is understood as theexistence of a latent reality, surfacing only under certainconditions.There are a number of ambient interfaces that rely on theaesthetics of cartoons, such as the nabaztag [10]. Anotherexample is the thankstail [11], a robotic dog tail for carsenabling drivers to communicate through non-verbalsignals. Another popular animistic notion is theindependent life of shadows, as illustrated by Ombra [12],a public installation that subtly animates the shadows of abronze statue.Beyond these figurative applications, the concept can alsobe found more abstract forms of expression. In fact,everything that is considered static and inanimate willproduce the effect when animated in a proper way. Forexample, the project Atemraum [13] presents a wall withthe ability to breathe according to a person’s respiration.The effect is achieved by inflating a rubber surfacecovering the wall. On a larger scale, the public art projecttxtual healing [14] gives houses a “voice” by projectingspeech bubbles with text messages from mobile phonespointing to open windows and doors.In terms of ambient media the moment of transformationfrom a static object to an animate one is of specialinterest. It has been stressed that a calm technologyshould easily migrate from periphery of attention to itscenter and back again [15]. This strategy is a way toinitiate this shift of focus through a language that mostpeople are familiar with. Animism can make the transitionsurprising and humorous, yet at the same time plausible.Figure 1 Freddie Yauner, signs of life – an apparentlyordinary sign coming to life.Figure 2 Atemraum, making the walls breatheB. Invisibility through MimicryThe natural environment has been mentioned as a perfectexample of an ambient display [6]. It conveys a plentitudeof information that we have learned to read andunderstand. At the same time we also have learned toignore most of what we encounter through habituation,we become blind to many things we see repeatedly in thecourse of our daily routine. This section investigates thepossibilities of invisibility in the sense of this inattentionalblindness. In the animal kingdom, mimicry is the strategyof a species to imitate the appearance of another, usuallymore powerful or dangerous species. In analogy, anambient interface might be disguised as a familiar objectthat we tend to ignore, and therefore will slip the attentionof the habituated mind.Naturally, this works well as a subversive strategy forimplanting alien objects into public space. One example isLeo Bonnani's design of an ordinary bus schedule, fixedon an existing pole in front of the main entrance on MITcampus. On closer inspection, however, the bus scheduleturned out to be a historical chart of suicides that haveoccurred on MIT in the recent years [16].153
On a more general level Mimikry creates what Bill Gavercalls ambiguity of context [17]: something may beunderstood in different contexts, each offering a differentmeaning. Gaver mentions Duchamp’s iconic fountainsculpture as an example, a ready-made consisting of aurinal turned on its side. The thus ready-made generatesan additional layer of meaning to ordinary objects. Thisdouble meaning is what differentiates Mimikry fromexisting examples of ambient displays, for example in theshape of furniture or picture frames. They may adopt theshape, but remain in the same context of interpretation asthe referenced object.energy consumption of the local neighborhood – with theactual data of this local consumption, being projectedonto the cloud itself.This overlap is unusual in traditional forms of informationvisualization, where data and representation are separateentities. In these forms of visualization, iconic andsymbolic types of representation prevail: the content isexpressed either through resemblance or abstractmapping. In contrast, the two projects described above arepart of a new class of visualizations that have an indexicalcharacter, putting emphasis on the actual phenomenon. Ininterface design, ambiguity is usually consideredsomething to avoid. In these examples, on the contrary,this ambiguity is employed to increase theunderstandability of ambient displays by integratingelements of common knowledge. Furthermore, thestrategy can be also a way to increase the credibility ofthe presented information, since the effects can directly beobserved. Finally, by incorporating natural phenomena, itadds richness to the representation.Figure 3 Bonanni's display disguised as a busschedule.C. Blending the Object and its RepresentationWhen we talk about ambient visualization in the urbancontext, the map sometimes becomes the territory - theboundary between the visualization and the object itrepresents becomes blurry, with both occupying the samespace and often having a similar scale. As a consequence,it can become unclear whether something is part of therepresentation or the visualized concept. The outdoorenvironment is a natural information display itself forthose who know how to read it. Yet, at the same time it isalso the subject of representation.This ambiguity can be illustrated with a project for publicfocusing on the display of environmental information.The public installation garden of eden [18] uses saladplants placed under glass boxes where they are exposed topolluted air that has been generated according toenvironmental data from different cities in the world. Theeffect of the polluted air on the plants is the only form ofvisible representation. In this example, the distinctionbetween the visualization and the visualized concept isblurred, since the plant can equally be considered as partof the environment and exhibits the actual effect - theimpact of polluted air on the urban environment. Theurban-scale project Nuage vert [19] offers an even tighterconnection between representation and its subject. Theproject augments the emissions coming from the chimneyof a power plant – whose size is connected with theFigure 4 Timm Wilks et al., garden of edenD. Embracing unstable Display MediaFor traditional displays, the display medium has to be asgeneric and controllable as possible. Every influence fromits local environment has to be minimized; the displayshould always appear in the same way in every lightcondition. Designers of outdoor LED displays are makingbig efforts in order to neutralize the influence of ambientlight. In spite of these efforts, the outdoor environment isa different case and independence from context is notalways possible to achieve. Consequently, architects havelearned to incorporate successfully the impact of differentenvironmental conditions on the appearance of a buildinginto its design. What is a generally accepted as a sitespecificquality of architectural design, could also makesense for urban interfaces – to embrace the influence ofenvironmental conditions on the appearance andcharacteristic of the display.An example from contemporary art history is HansHaacke's condensation cube, using humidity as itsprimary medium. The piece is a minimalist sculpture inthe shape of a sealed off glass-cube containing a small154
quantity of water, which causes a layer of condensationcovering the walls. Through the continuous cycle ofcondensation and evaporation, the artwork’s appearancechanges constantly influenced by environmental variableslike temperature or light. Inspired by this artwork, wedeveloped the ambient display dewy [20], that displayspixilated pattern of condensation, facilitated by a matrixof peltier elements and a fan for erasing the patterns.While the display allows high-level control over theemerging patterns, the actual appearance of thecondensation patterns depends a lot on external humidity,temperature and light direction.There are numerous other examples and possibilities -especially plants are an interesting choice for a displaymedium: they interact with their environment on anumber of levels, yet exhibit persistent features such aspetal color. Examples of ambient displays include projectsthat exploit a plants’ phototrophic behavior or thepossibility to tint the petals by watering white flowerswith colored water.Ephemeral materials as display media are without doubtharder to control, and therefore offer less bandwidth fordisplayed information. Additionally, the display willnever represent the data in a pure form, but blended withenvironmental influences. If these influences are takeninto account and are conceptually compatible with thepurpose of the representation, this approach mightcontribute an additional dimension to the display.Walther Benjamin called the “aura” of an object [21], thetotality of an objects subtle features that can never becompletely described.The emulated form of physical wear, computational wearas a metaphor for a documents interaction history wasintroduced back in 1992 in the “edit wear / read wear”paper [22]. It presents a text processor, displayinggraphical wear patterns that indicate the amount ofprevious reading / editing of different parts of adocument. The authors differentiate between active andpassive wear. The latter is resulting from passiveconsumption or aging, while the former is a consequenceof active editing or commenting. In a similar way, thehistory tablecloth [23] incorporates this concept ofcomputational wear by recording the placement of objectson its surface.Beyond the metaphorical treatment, there are alsoexamples that treat wear in the literal, physical way. Inone of our own projects 1 , dust is used as a medium forrecording interaction history. The project is a soundinstallation for a room with dusty floor, on which anumber of phonographs are placed, playing back silentvinyl records. The visitors’ movements stir up the dust,which subsequently accumulates on the records andgenerates a soundscape of noise. In the some examplesthe interaction irreversibly consumes the display or theinterface, for example in the “email erosion” project [24].Figure 5 Left: Hans Haacke's Condensation Cube;Right: Parkes / Offenhuber - DewyE. Designing with Physical WearPhysical wear is usually considered a mechanical problemthat has to be minimized. Despite this prevailing negativeconnotation, physical wear offers a lot of interestingfeatures as well, since it is a reliable record of an object'sinteraction history. The location of ditches in old marblestaircase tells us about how people have stepped on it, theshiny parts on the patinated surface of a copper doorhandlereveals how people prefer to operate it. In thatsense, physical wear is an ambient information display –we include it into our perception of the value and age ofan object. Wear and patina are major elements of whatFigure 6 physical and computational wear (right:Gaver, history tablecloth)Comparing the metaphorical versus the physical treatmentof the concept, the latter seems to be especially interestingfor urban interfaces. In the unprotected outdoorenvironment, physical wear is a permanent issue andmaintenance is a necessity. Incorporating physical wearinto the design by carefully choosing materials instead ofemulating it computationally could be a way to provide asubtle hints about an objects history. By taking advantageof the viewer’s ability to assess material qualities, it offersadditional cues about extent and age of previousinteractions.F. Deliberate Exclusion of the UserIn this case, invisibility is understood in the sense ofopacity, by making it deliberately hard to understand whatis presented. This seems at first paradox and nonsensical,1 “From Dust till Dawn” presented at ars electronica 2006155
Rand in fact few examples of public interfaces come tomind. However, curiosity is a powerful motor, and withthe right cues, this strategy can be a way to encourage theuser to learn the conventions of an interface.Observing the modes of visual communication in publicspace, the play between inclusion and exclusion of usersis quite common. Fashion signals work on many levels –a part is universally understood, other parts of theirmeaning only by members of a certain group. Street artand graffiti are another example, where new codes areinvented continuously as part of a somewhat exclusive,self-referential system. The spatial paintings of FeliceVarini illustrate how public space can be engaged througha codified visual language that might not be immediatelyunderstood. Built upon the renaissance technique ofanamorphosis, the visual elements of his spatial paintingsare distributed in space according to projective geometry.From one single viewpoint, they form a coherent picture.The strategy to obfuscate information is found also inreal-world interfaces of alternate reality games.Invisibility plays a central role in the applied this is not agame aesthetic, mainly achieved through deep integrationof game elements and puzzles into the urban context.Again, the goal is to awaken the curiosity of participantsby withholding information.Figure 7 left: F. Varini, archi e corone, 2004; right:Connor Dickie, Kameraflage, 2007Two examples for this strategy take invisibility in thevery literal sense. Kameraflage employs near-infrareddisplay elements that are not visible to the eye, but todigital camera devices. Similar and perhaps even morepuzzling for the unsuspecting viewer is the ImageFulgurator - a device for injecting hidden content intoother people’s photographs in the moment when they aretaken. The flash from a nearby camera activates thedevice, which then projects arbitrary content into thescene, just long enough to show up in the picture but gounnoticed by the photographer.How should this strategy be used beyond the artisticapplication, given the introductory critique of arbitrarydata mappings? The first challenge is to make the viewerrecognize that some information is displayed at all [25],therefore the presence of encoded information has to beclearly communicated. In many cases, this might be morefeasible compared to the heroic task of finding a mode ofexpression that is universally understood. Finally, withoutthe burden of general accessibility, this approach mightoffer more value for the knowing user.DiscussionThe strategies described in the six sections aboveillustrate ways for blending an interface into the ambienceby establishing a relationship with the context of theinterface. The presented principles focus especially on thetransition process between background and foreground ofattention. Depending on the direction of this transition,the described approaches fall into two groups:The first group covers the transition into the background:it includes mimicry, embracing unstable display mediaand incorporating physical wear. They help to tighten thecoupling between foreground and background. Mimicryaccomplishes this by playing on tendency to blend outfamiliar elements, both unstable media and physical wearby increasing the influence of environment and users onthe interface. The other group focuses on the oppositedirection, the emergence from the background. It includesanimism, ambiguity of object and representation and, tosome extent, the deliberate exclusion of the user. Thesestrategies increase awareness within a specific context.Animism helps by bringing supposedly static objects tolife, ambiguity by putting emphasis on to an existingphenomenon that might be overlooked, and exclusion bycreating a moment of irritation. This categorization showsgeneral tendencies, however, many principles work inboth directions, for example the strategy of exclusion.ConclusionThe presented strategies emphasize the importance ofsituation. They are an invitation to designers of ambientinterfaces to reach beyond the current best practices ofinterface design and usability engineering and explorestrategies that seem counterintuitive, and draw inspirationfrom art and architectural practice. They add a subversive,irritating aspect that might help us to see our environmentwith different eyes.References1. Venturi R, Brown DS, Izenour S. Learning fromLas Vegas. MIT Press Cambridge, Mass, 1972.2. Moere AV. Beyond the Tyranny of the Pixel:Exploring the Physicality of InformationVisualization. IEEE International Conference onInformation Visualisation (IV'08), London, UK2008: 469-4743. Hiroshi Ishii CW, Scott Brave, Andrew Dahley,Matt Gorbet, Brygg Ullmer, and Paul Yarin.ambientROOM: Integrating Ambient Mediawith Architectural Space. ConferenceProceedings of CHI '98 1998156
4. Cherry C. On Human Communication: AReview, a Survey, and a Criticism. 19665. Mankoff J, Dey AK, Hsieh G, Kientz J, LedererS. Heuristic evaluation of ambient displays.Proceedings of the SIGCHI conference onHuman Factors in computing systems 2003: 169-1766. Wisneski C, Ishii H, Dahley A, Gorbet M, BraveS, Ullmer B, Yarin P. Ambient Displays:Turning Architectural Space into an Interfacebetween People and Digital Information.Proceedings of the First International Workshopon Cooperative Buildings, IntegratingInformation, Organization, and Architecture1998: 22-327. AmbientDevices. Ambient Umbrella.http://www.ambientdevices.com/products/umbrella.html 20068. Bullivant L. D-Tower, NOX, Doetinchem, theNetherlands, 1998-2004 and Son-O-House, Sonen Breugel, NOX, the Netherlands, 2000-2004.Architectural Design 2005; 75(1): 68-719. Crafton D. Before Mickey: The Animated Film,1898-1928. University Of Chicago Press, 1993.10. n.n. nabaztag.http://www.nabaztag.com/en/index.html11. Kazuhiko H. ThanksTail.http://www.petworks.co.jp/~hachiya/works/ThanksTail.html12. Andreas Gysin SV. ombra. http://www.gysinvanetti.com/show.php?id=123200713. Andreas Zingerle TW, Christina Heidecker.Atemraum.http://www.andreaszingerle.at/index.php?id=16,0,0,1,0,0 200714. Notzold P. txtual healing.www.txtualhealing.com/15. Weiser M, Brown JS. Designing CalmTechnology. PowerGrid Journal 1996; 1(1): 75-8516. Bonnani L. Suicide Stop.http://leo.media.mit.edu/?p=244 200717. Gaver WW, Beaver J, Benford S. Ambiguity as aresource for design. Proceedings of theconference on Human factors in computingsystems 2003: 233-24018. Timm Wilks OK, Harald Moser Garden of Eden.www.wollle.com/timm/paper/goepaper2.pdf200719. Helen Evans HH. Nuage Vert.www.nuagevert.org/ 200720. Parkes A, Offenhuber D. Dewy: a condensationdisplay. International Conference on ComputerGraphics and Interactive Techniques 200721. Benjamin W. Das Kunstwerk im Zeitalter seinertechnischen Reproduzierbarkeit< ZweiteFassung>. Walter Benjamin: GesammelteSchriften. Bd; 1: 471-50822. Hill WC, Hollan JD, Wroblewski D,McCandless T. Edit wear and read wear.Proceedings of the SIGCHI conference onHuman Factors in computing systems 1992: 3-923. Gaver W, Bowers J, Boucher A, Law A,Pennington S, Villar N. The history tablecloth:illuminating domestic activity. Proceedings ofthe 6th ACM conference on DesigningInteractive systems 2006: 199-20824. Ham E, Muilenberg T. Email Erosion. New York,NY: Rhizome. org 200625. Skog T, Ljungblad S, Holmquist LE. BetweenAesthetics and Utility: Designing AmbientInformation Visualizations. Proc. InfoVis 20032003: 233-240157
Ambient Displays in Academic Settings: Avoiding theirUnderutilizationUmar RashidSchool of Computer Science & InformaticsUniversity College DublinRepublic of Ireland+353 1 716 5356umer.rashid@ucd.ieABSTRACTThis work reports the findings of a case study examiningthe use of ambient information displays in an indooracademic setting. Using a questionnaire-based survey, wecollect experiences and expectations of the viewers who arebased on different floors of the same building. Based on thesurvey feedback, we offer some design principles to avoidthe underutilization of large displays and make the most oftheir potential in indoor environments.KeywordsAmbient displays, indoor settings, community awareness,aesthetics, design principlesINTRODUCTIONAmbient information displays have emerged as an effectiveway of disseminating information in an unobtrusive andlow effort manner. They have found their use in indoor(e.g. classrooms, workplaces [2,4,5]) as well as outdoorsettings (e.g. shopping malls, city squares, airports, trainstations [3]). In spite of their deployment and evaluation invarious settings, a sound understanding of factors that maycause under-utilization of their potential remains lacking.Huang et al. [3] undertook a comprehensive case study ofthe use of ambient displays in public settings. However,there is no counterpart of this study for ambient displays inindoor academic environments.This work investigates the current use of ambient displaysin the Complex & Adaptive Systems Laboratory (CASL)[1] at University College Dublin (UCD), Ireland. Atpresent, there are five large displays installed in the CASL,each of them showing, among others, the profiles of staffmembers, research images, and news feed in a repeatedloop. We report on the results of a questionnaire-basedsurvey that was conducted among 59 members who arebased on different floors of the CASL building and work invarious capacities. We explain the survey methodology,experiences and expectations of the viewers we collectedfrom the survey. Based on the survey findings, we presentsome design guidelines that may help the designers tacklethe factors responsible for under-utilization of ambientdisplays in an indoor setting.Aaron QuigleySchool of Computer Science & InformaticsUniversity College DublinRepublic of Ireland+353 1 716 5357aquigley@ucd.ieAMBIENT DISPLAYS IN CASLThe Complex and Adaptive Systems Laboratory (CASL) isa collaborative research laboratory at University CollegeDublin, Ireland. It is situated in a five-story building andhosts members of various disciplines in differing capacities.These include academic staff, post-doctoral researchers,post-grad students as well as human resource staff. Inaddition, there are also undergraduate students based herefor 3-months long internship during the summer.CASL draws researchers and students from variousdisciplines including business, computer science, electricalengineering, mechanical engineering, geological sciences,and mathematics. Cross-disciplinary research is the focusof CASL’s mission and large displays have been placed inCASL with the prime purpose of advertising researchactivities.Fig. 1. Ambient Display in CASLCASL has five large displays, LCD screens of size 32'' asshown in Fig. 1, one on each floor. Each display shows theuniversity research management system web-pages ofacademic and research staff in a repeated loop. Theresearch images in the top and bottom right corners of thedisplay are also repeatedly changed in a loop. The headercontains the logos of UCD and CASL. There is a clockshown in the top right corner and a news ticker at the158
ottom of the display. Fig 2. shows a schematic illustrationof the design and layout of the display.quantitative data about what and where people look atdisplays.SURVEY FINDINGS: EXPERIENCESThe following section describes the experiences ofparticipants with displays.Drawing the Design & Layout of DisplayMost participants were able to recall the photos and profiledetails of staff members on the display. In contrast to that,less than half could recall news feeds, research images,UCD and CASL logos, and the clock. The results of thisexercise are shown in Table 1.Fig. 2. Design and Layout of Ambient Display in CASLSURVEY METHODOLOGYWe conducted a questionnaire-based survey to explore themanner in which CASL members are currently using thedisplays in the building. The survey involved 59participants in the age group of 17-50 who were based ondifferent floors of the building. Among the participants, 28were post-grad students, 3 academics, 11 post-doctoralfellows, 8 undergrad students and 9 administration staff.Before filling the questionnaire, each participant was givenan overview on the purpose of survey. The participantswere first asked to draw the design and layout of thedisplay from memory without looking at it akin to thediagram show in Fig. 2. The next section of questionnairewas aimed at collecting their current experiences with thedisplays followed by their expectations and suggestions forimproving these experiences. After completing thequestionnaire, the first author held a 5-10 minutes longdiscussion with each participant to get a betterunderstanding of their views. On average, the first authorspent 20-25 minutes with each participant. The surveylasted for seven days and all participants were given acandy as a gratuity.It needs to be mentioned there is a trade-off when askingparticipants to remember things from memory, as opposedto observing them in context. Huang et al. [3] adopted thelatter approach in their case study. In the former approach,the possibility of recall bias on the part of participantscannot be ruled out. At least two participants failed to drawsome contents from the memory but after looking at thequestions in the next section of the questionnaire, theyimmediately determined the contents on the display.However, using this approach, we are able to collectTable 1: Participants who recalled the contents on thedisplay from memoryContents on display Participants who recalledStaff member Photo 50 (85%)Profile details 49 (83%)News feed 28 (47%)Peripheral research image23 (39%)CASL logo 20 (34%)Clock 20 (34%)UCD logo 14 (24%)Top research image 7 (12%)Surprisingly perhaps we did not encounter any correlationbetween the ability of participants to recall the contents ofthe display and the time duration for which they had beenbased in CASL. Moreover, while they were able to recallthe profiles of staff members, very few participants wereable to identify all the profile details (e.g. contact info, bio,links) on the displays. This concurs with the observationmade by Huang et al. [3] that people pay very briefattention to the large displays and are rarely likely to stopand go through the whole content in detail.Most useful contents on the displaysAmong the contents currently being shown on displays,most participants regarded the profiles of academic andresearch staff to be the most useful information, followedby time and news feed. However, there was one participantwho considered time to be the most useful content on thedisplay near the reception desk while profiles of staffmembers on the display in the canteen.Table 2 shows the results of what participants regarded tobe the most useful contents on the display.Table 2: Participants who considered the contents ondisplay to be most usefulContents Participants who considered it most159
usefulProfiles 22 (37%)Time and date 9 (15%)News feed 8 (13.5%)Time + profiles 6 (10%)Profiles + news 3 (5%)Time+ profiles + 3 (5%)newsTime + news 3 (5%)Nothing 2 (3.3%)News + research 1 (1.7%)imagesTime+ profiles + 1 (1.7%)news + researchimagesTime at reception 1 (1.7%)+ profiles atcanteenVisual appealMost participants were of the opinion the displays servedan aesthetic purpose and made the environment visuallyappealing. Some were of the opinion that the presence ofdisplays gives the impression of working in a“technological environment”.Community awarenessThe displays enabled the viewers to get to know staffmembers of the CASL. They were able to associate nameswith faces of members in an effortless manner i.e. withoutbrowsing the CASL or UCD website and visiting the webpage of individual members.MotivationThe displays show the research system web pages ofacademic and research staff members in a repeated loop.Undergraduate students who arrived few weeks before onsummer internship found it quite motivating andinspirational. Here is how an undergrad internee remarked:“I realized that it takes hard work and dedication to be onthese displays.”Places where they looked at the displaysWe determined that participants were most likely to glanceat the display in the canteen on the 4 th floor, as shown inTable 3. The canteen is where most members of the CASLgather during their lunch break every weekday. Moreover,there is a weekly tea party there at 4pm every Thursday. Inaddition to that, other social events such as birthday,farewell, and graduation parties are also held there.Table 3: Participants who are most likely to look at ondisplay on different spots in CASLSpots Participants who look atdisplaysCanteen 32 (54%)Canteen + Reception 8 (13.6%)Floor where cubicle is 7 (12%)Canteen + Floor where 6 (10%)cubicle isReception 4 (7%)Photocopier (1st floor) 1 (1.7%)Canteen + Reception + 1 (1.7%)floor where cubicle isPerceived Purpose of displaysAs part of a qualitative evaluation of the displays, we askedthe participants what purpose, in their perception, thesedisplays served in the CASL. From their responses, wedetermined the purposes of displays in CASL as follows:Most participants were of the opinion the displays provideda good “sight-seeing opportunity” but their potential wasnot being fully utilized. At present, they act as nothingmore than a research poster and wall-clock. There werecomplaints from participants that the news ticker was hardto read and was also not updated regularly.Table 4 summarizes the experiences of CASL memberswith the displays in CASL.Table 4: Summary of user experiences with displays inCASLIssuesFindingsMemorable contents • Photos of staffmembers (85%)• Profile of staffmember (83%)Useful contents Profiles (37%)Most likely place to loot atthe displaysCanteen (54%)Purpose of displays • Visual appeal• Communityawareness• Motivation160
SURVEY FINDINGS: EXPECTATIONSThe final part of the questionnaire consisted of open-endedquestions designed to provoke the participants to divulgewhat changes they expected to be brought about with thedisplays in the CASL. These included the questions aboutthe type of information to be shown on displays,positioning of displays in the CASL, and changes ininteraction mode with displays. The results of this sectionof questionnaire are explained below.Content of displaysParticipants in general were of the view that instead ofprofiles of staff members, news and events should be givenmore prominence on the display. They pointed out that theweb-pages being were not tailored to public display. Forexample, it makes no sense to show the “Links” section ofa web-page on a non-interactive public display.Currently, news appear as a ticker at the bottom of thedisplay. Many participants wanted this section of display tobe made more prominent. Moreover, to their dismay, newsdisplayed on display was quite static and not updatedregularly.Below are comments of some participants:“There is a lack of information on displays, plus unsuitabledisplay -- web page has not been altered for publicdisplay”.“The display in the canteen can be used for entertainmentand that in reception to welcome guests.”“Along with news about upcoming conferences andseminars, it would also be better to display auxiliaryinformation such as weather forecast, intermittent traffic.”Change in Position of displaysParticipants wanted displays to be placed in the areas ofbuilding where most people linger. Some comments fromparticipants are given below:“2nd floor display should be outside the lift or besides thestairs. Most people currently do not pass or see the screenin its current location”.“Bring them all down to eye-level or for canteen, seatedeye level.”Making the displays interactiveMost participants were apathetic to the possible option ofmaking displays interactive and allowing participants toupload content of their choice. However, a few of themfound the idea exciting. Although, they still preferred amoderated control over the user-uploaded content lest itundermine the professional look and feel of displays.Presence/leave informationAs a way of enhancing collaboration, we proposed to theparticipants the option of displaying their presence/leaveinformation. Most participants expressed strong oppositionto the idea of displaying their presence/leave informationon displays. They considered such information to be quiteprivate and not something to be shared with other than theirimmediate colleagues. This proposal of displayingpresence/leave information was inspired by applicationssuch as In/Out Board [5] and Active Portrait [2]. However,in the case of aforementioned applications, the informationwas accessible to only the close colleagues rather thanpeople from other research groups, not to mention nonacademicstaff e.g. human resource staff, as in the case ofdisplays in the CASL.Table 5 summarizes the expectations of CASL memberswith displays in CASL.Table 5: Summary of user expectations with displays inCASLIssuesFindingsContent of displays • Focused on events,rather thanpersonalinformation• Web pages to betailored for publicdisplayPositioning of displays • Places wherepeople linger• Bring them to eyelevel“It would be better in view of my desk or in places wherepeople linger”.“Place them in more public areas e.g. seating areas.”“It would be better to have one in the elevator.”Making displays interactivePresence/leave informationModerated control on useruploaded contentBreach of privacy. Onlyimmediate colleaguesshould get to know aboutthat information.161
UTILIZE THE POTENTIAL TO FULLEST: DESIGNGUIDELINESBased on the collected experiences and expectations ofparticipants about displays in the CASL, we offer somedesign guidelines to utilize the full potential of ambientdisplays in academic setting.Content type: “Core” and “Auxiliary” Contents“Core contents” on ambient displays in academic settingshould be focused on relevant event and news, rather thanprofiles of academic staff. It is more inspirational for thefellow colleagues to see events such as recent awards,patents and publications of members being shown onambient displays.People seem more interested in looking at dynamic and upto-datecontent rather than static ones.In addition to “core” contents, to further evoke the interestof viewers, some auxiliary contents may be added such aslatest news about weather forecast, and intermittent traffic.Contextualization of ContentAmbient displays should display information relevant tothe different audience in different settings. In our case,most participants were of the view that the content on thedisplay near reception desk should be more general andappealing to visitors. One administration staff member whojoined CASL a few weeks ago was puzzled to see that thecontent on the display near the reception desk did not givenew-comers any idea about the vision and activities of theCASL.Positioning of DisplaysAmbient displays should be placed considering themovement flow of people in the building. Beforeconducting the survey, we assumed that almost everymember of CASL looked at the display near the receptiondesk. However, we found out that many people used the carpark and entered the building using elevator from theunderground basement to reach their floor, thus bypassingthe reception desk on the ground floor.Most people viewed the display in the canteen followed bythe reception desk, and quite a few of them looked at themat the floor where their cubicles were. That indicates that 3out of 5 displays in the building were hardly if ever beingviewed by the occupants. Moreover, a place which wasused by all members of CASL had no display i.e. theelevator.Here is a comment from a participant:“I view them only when I'm using the photocopier on the1st floor. Better put them over printers, water-coolers, andin elevators… anywhere people are waiting.”Therefore, it is important to identify the movement flow ofpeople and congestion spots within the building beforepositioning ambient displays.Privacy concernsInformation displayed should not infringe upon the privacyof members. Considering the strong opposition to thepublic display of presence/leave information weencountered in the survey, designers of ambient displaysystems must be sensitive to privacy concerns of viewers.This issue becomes critical when, unlike the cases [2, 5],many viewers do not happen to be their immediatecolleagues.Table 6 gives a summary of design guidelines for ambientdisplays in the CASL.Table 6: Summary of design guidelines for ambientdisplays in CASLIssuesGuidelinesContent type • Dynamic and upto-datecontent• Content be madeevent-centricrather than profilecentricContextualization of content Different contents forvisitors and membersPositioning of displays • Identification offlow of movement• Identification ofcongestion spotsPrivacy concernsComprehension of privacyconcerns in caseinformation is viewed bythe people other thanimmediate colleaguesCONCLUSIONS AND FUTURE WORKSIn this paper, we reported on the findings of aquestionnaire-based survey of the current use of ambientdisplays in an indoor environment of a research lab. Wecollected the experiences and expectations of the viewers,along with highlighting the limitations of our surveymethodology. Based on survey findings, we formulatedsome design principles to minimize the underutilization ofambient displays in indoor settings. We plan to implementthe proposed changes in the design, layout and positioningof the displays in CASL and collect the subsequentfeedback from the users.ACKNOWLEDGMENTSThis research is supported by Irish Research Council forScience, Engineering and Technology (IRCSET): fundedby the National Development Plan, and co-funded by IBM.162
REFERENCES1. Complex and Adaptive Systems Laboratoryhttp://casl.ucd.ie/2. Huang, E. M. and Mynatt, E. D. Semi-public displaysfor small, co-located groups. In Proc. of CHI, 2003, 49-56.3. Huang et al. Overcoming Assumptions and Uncoveringpractices: When Does the Public Really Look at PublicDisplays? In Proc. of Pervasive, 2008, 228-243.4. McCarthy, J., Costa, T., and Liongosari, E. UniCast,OutCast & GroupCast: Three Steps Toward Ubiquitous,Peripheral Displays. In , 332-345.5. Salber, D., et al. Designing for Ubiquitous Computing:A Case Study in Context Sensing. GVU, TechnicalReport GIT-GVU-99-29, July 1999.6. Zhao, Q.A., and Stasko, J. T. What’s Happening?:Promoting Community Awareness throughOpportunistic, Peripheral Interfaces. In , 69-74.163
A notification system for a landmine detector usingdistributed cognitionSilvia TorsiCommunication Science Dept.University of SienaVia Roma 56, 53100 Siena (Italy)torsi@unisi.it+39 0577 234740Antonio RizzoCommunication Science Dept.University of SienaVia Roma 56, 53100 Siena (Italy)rizzo@unisi.it+39 0577 234740ABSTRACTThis paper presents a design for a visual display to beadded to mine detection equipment. It is an application ofthe tenets of calm computing to a safety-critical system byputting cognition outside the mind, aligning inputs withinthe centre of attention and along the periphery, andjuxtaposing stimuli in close proximity to the source of theinformation, all with the aim of increasing safety.The first iteration occurred in the redesign of a landminedetector is described, starting from a literature review ofthe related practices, concept design, mock-up productionand, finally, heuristic evaluation and the brainstormingundertaken with experts in the field.KeywordsNotification Systems, Calm Technologies, LandminesDetection, Distributed Cognition, Critical Activity Monitor,Humanitarian demining.INTRODUCTIONThis work is based on a study of the practice of landminedetection with the use of electromagnetic signals baseddetection technology [1]. The correct procedures for theidentification, investigation and declaration of a buriedobject with a metal detector have been embodied in thedevice with the aim of distributing cognitive processingbetween the operator, the tools and the perceived and actedworld. The basic idea was to face the issue of the cognitiveload of the operator providing the landmine detector with anotification system display [2], [3] that could allow apresentation of the data in visual form, thus beingisomorphic with respect to the target - the buried landmine- and at the same time to the surrounding environment - thesoil, the topographical and geographical setting.The spatial proximity between the display and the mostimportant contextual elements that the operator mustconsider were also design issues [4].A prototype and a scenario in a video format were built andpresented to three experts in the field of humanitariandemining. We requested them not only to evaluate theconcepts but also to make proposals and offer design ideasin order to push the project forward.THE PRACTICE OF LANDMINE DETECTIONA mine is a device designed to kill or injure anyone whocomes into contact with it in general through directpressure. There are many different types of mine, allessentially consisting of a container containing explosiveand a fuse. The main characteristics of landmines are theirsimple, no-maintenance and economic technology,combined with their persistent threat throughout the years.There are smaller mines aimed at people (AP) or largerones aimed at vehicles (AT). The production of metalliclandmines has been progressively replaced by that ofplastic landmines, which are harder to detect [7].At present, the most widely-employed way of scanning aterritory is by using metal detectors. Basically, theseportable technologies are composed of a search head, aconnecting rod, a handle and an audio signal transmissionsystem.We isolated the basic steps of the practice of landminedetection from the work of James Staszewski, whichanalysed the best practices of a number of expert users [1].These steps are: (1) to sweep the surface suspected ofhiding landmines (search); (2) on receiving a signal, to tryto repeat it in order to obtain confirmation; (3) toinvestigate its shape by matching the auditory informationwith the images of known landmines (investigation); and(4) finally, to declare the suspected type of mine (decision).The initial phase consists of searching for buried mines,while “sweeping” the ground surface and lightly movingthe detector over an area of 1.5 metres (the “lane”) with across-lane trajectory; if there is no signal, the operatormoves on 15 cm, repeating the procedure, and so on.164
When a signal is perceived, the operator tries to reproduceit by moving the tool over the critical area; if the sound isrepeated, the investigation phase begins. The operator mustelicit the shape of the object on the basis of the soundsemitted by the detector.The possible actions for investigating an auditory signal inorder to elicit the corresponding shape (and classify it)depend on the halo produced by the buried object. The halois precisely the visual pattern imagined by the operator onthe basis of the sound emitted or not, as the landminedetector is moved over the critical area; the halo of alandmine is normally circular, and its dimensions can varywidely based on the amount of metal that composes themine and its dimensions. Other innocuous objects that canproduce a signal may have different, non-circular halos thatare difficult to distinguish from a mine. These tend to causefalse alarms, which slow down the demining process andtire the operators.From the description of the landmines inspection practice,it is possible to focus on three coexisting elementsproducing cognitive load: the first is environmentalinformation interpretation; the second is the rehearsal andsituated application of the inspection procedures (with allthe geographical, temporal, sensory and motor relatedcomponents); and the third is the interpretation of the datacoming from the device. As for metal detectors, theabsence of isomorphism between the signal and what issignaled in the investigation phase can be considered as anadded cause of cognitive load. Proof of this is found in theradiating movements that the operator executes over a haloin order to build up a mental image [1].We considered these issues as design problems andimagined a display integrating auditory information andembodying the procedures of landmines inspectionroutines. The solutions proposed are: (1) creatingisomorphism, homogeneity and consistency between thedata from the different sources, allowing the operator toorganise them. (2) juxtaposing the contextual information(geographical/physical/environmental); and (3) furnishingthe user with information organised at the centre and at theperiphery [5] in order to meet the cognitive principle of thedynamical partition between the foreground andbackground [6]. The results are a set of artefacts that allowthe situated manipulation of visual data about theenvironment in a transparent way, and organize the user’sattentive view [9].A number of devices are provided for visualisation support,but they are mostly located separately from the body of thetool, thus violating the principle of juxtaposition and thespatial proximity of the data. Otherwise, when a display ismounted on the landmine detector (e.g. the ALIASdetection system [8]), it is located too close to the visualfield, compromising the perception of the context which iscrucial for the operator to achieve sensory-motorcoordination and the analysis of the environmental factors.THE REDESIGNThe main modification of the detection device is a circulardisplay located over its main body with the aim ofsupporting the activity of the operator through instructionsfor sweeping and the visualisation of the halo (fig.1).Fig. 1 The circular display mounted over the main body ofthe landmine detectorThe basic idea is a system that takes a trace of the halowhile the user moves the device, in order graphically tobuild it in progression while the user moves the detector; inthis way, the auditory information will be grabbed andregistered by the system in visual form.As for the initial phase of the search (fig. 2), the arrowsprojected onto the screen will suggest to the user in whichdirection he/she should go. In this way, the user will nothave to memorise the areas of the ground already scannedand those still to explore, but can simply follow theinstructions of the system, that automatically calculate anddisplay the trajectories.Fig. 2. The circular display prototype: the phase ofsweeping the ground165
As for the investigation phase, when the operator has todecide the nature of the buried object individually, thesystem supports the detection of the halo by visualising iton the screen. Figures 3 and 4 show the phases ofinspection of a metallic and a plastic landmine respectively.Fig. 3. The circular display prototype: radiating inspectionof a metallic landmineraised by the exposition of these materials. A synthesis oftheir contributions is presented below:In the past, when addressing the operator interface withthe metal detector, we tended to ask thedesigners/manufacturers only to provide the operator withan audible output when detecting a target. The idea was toprevent the operator from losing focus on the ground,which could contain hazardous objects that could betriggered physically by contact with the search head.Newer detectors have, over the past couple of years, amongother indicators, successfully integrated an LED bar,giving the operator a visual reading of the strength of thesignal. Visual displays as an added source of information,decreasing the amount of false alarms, and in generaldetermining a reduction in the human factors affecting thewhole process of detection. On the other hand, they tend tooverhang the field of vision and thereby increase the risk ofmaking mistakes. The system proposed in the scenariorepresents an overcoming of the existent problems in thatthe display mounted over the body of the device allows theoperator to maintain an acceptable field of vision, andrequires only a short training session. The use of a displayrepresents, in general, a shift in the paradigms of thedetection procedures, and there is the possibility that thenext generation of deminers, being used for computergames equipped with display glasses, could improve thesystem proposed in the scenario.Fig. 4. The circular display prototype: radiating inspectionof a plastic landmineThe benefits of the concept described lie in the tenets ofdistributed cognition. The working memory of the operatoris partially relieved by switching between audio analysis,visual imagery, the recalling of the halos’ classifications,sensory-motor and spatial cognition, the evaluation of thesoil and the retention of the actions still to perform in orderto complete the sub-procedures. Finally, the screen-basedinformation would be sharable with the other componentsof the team, storable and thus available to others indifferent moments, to support the decision-making,training, and eventually, a second-time analysis.After the concept design phase, video prototypes and avideo scenario have been built in order to submit them to agroup of experts in the field of humanitarian demining.They have been asked to perform a hybrid evaluation thatwould take into account not only the scenario produced,but also a review of an available solution for a dual sensordetector with a mounted display (ALIS) [8]. They havebeen solicited to express the opinions, ideas and visionsIn sum, the experts’ opinions were positive in that theyacknowledged the improvement that visualisation can bringto the detection process, such as the importance of using adisplay mounted on a landmine detector in order tointegrate the visual field unobtrusively. One of the expertsenvisioned a high tolerability of augmented environmentsin the near future, thanks to the diffusion of hightechnology computer games.DISCUSSIONWe tried to work with both the paradigms of distributedcognition [10] and disappearing technologies [9], [5], [11]in different phases of the project. They revealed commonthemes derived from cultural-historical psychology, likethe claim to amplify cognition by putting it outside thehuman brain [10],[11], or the intuition that an effectivecognitive artefact tends to disappear from the attention ofthe user, as in the practice of writing.The original contribution of the redesign described abovelies in its attempt to locate the added source of information(the display) at the same level as the other elements of thevisual field, with a spatial proximity to them, and with thesame visual language. Moreover, the indexicality [2] of theinformation produced is pushed to a 1:1 scale, in order tofurnish the user of a working landscape that tries to imitate166
a natural setting, and that allows the user to reason throughmanipulating information in a context-situated fashion.The aim of employing a calm technology to the distributedcognition analysis of the operator’s cognitive load isintended to allocate information in a dynamical and fluidpartition between the periphery and the centre of attention.This is an organisational principle of perceptual stimuli(already recognised by Gestalt psychology [6]) that followsthe human disposition to organise visual information asfigures (central, in movement, affording action in aGibsonian perspective) and background (peripheral, static,the Gibsonian visual invariants) that creates a mutablelandscape produced by the attention of the perceiver [5],[12] . Hence, the proposed display, acting as a notificationsystem [3], fades into the environment during routinesweeping and emerges at the centre of attention when aburied object is detected. So far, the design concept hasexhibited a positive heuristic that allow us to proceed withthe design process.CONCLUSIONSThis paper presents a design for a visual display to beadded to mine detection equipment. It is an application ofthe tenets of calm computing to a safety-critical system byputting cognition outside the mind, aligning inputs withinthe centre of attention and along the periphery, andjuxtaposing stimuli in close proximity to the source of theinformation, all of which are designed to increase safety.The redesign of a landmines detection device started withan investigation of the activities in which it is involved.We analysed the procedures isolated from JamesStaszewsky for soil inspection with the metal detector PSS-12 in order to be taught to novices [1]. The attempt toembody these procedures into the system using wellestablished psychological principles was the rationale thatguided us in the redesign process. Then we asked threeexperts in the field of humanitarian demining equipment toprovide hybrid evaluation/envisioning feedback whichcould the set requirements and constrain the followingredesign iteration. Hitherto, we have individuated aspectrum composed of different elements in the analysedfield: the sensory-motor activity and coordination, thelandmine detector, working as a lens that disappears at theattention of the user, and the background environment.Ambient information systems can have, in this kind ofconfiguration, a possible dimension, in which tools act assupports for creating relations and producing meaning fromthe heterogeneous stimuli available for the building of aperceptual experience.REFERENCES1. Staszewski, J.J. Spatial thinking and the Design ofLandmine Detection Training. In Allen, G.L.(ed.). Applied Spatial Cognition: From Researchto Cognitive Technology. Lawrence ErlbaumAssociates Publishers, Mahwah NJ, London,2006.2. Pousman, Z. and Stasko, J. A Taxonomy ofAmbient Information Systems: Four Patterns ofDesign. Proc. of AVI 2006. ACM Press, NewYork, NY, 67-74.3. McCrickard, D.S., Chewar, C., Somervell, J. andNdiwalana, A. A Model for Notification SystemsEvaluation–Assessing User Goals for MultitaskingActivity. ACM Transactions on CHI 10, 4 (2002),312 – 338.4. Rohrbach, S., and Forlizzi, J. A Taxonomy ofInformation Representations and TheirEffectiveness in Ambient Displays. CarnegieMellon University, 2005.5. Weiser, M. and Brown, J.S. Designing CalmTechnology. PowerGrid Journal, 1, 1 (1996).6. Chang, D., Dooley, L., Tuovinen, J.E. GestaltTheory in Visual Screen Design – A New Look atan Old Subject. Proceedings of the 7 th WorldConference on Computers in Education (2001).Australian Computer Society, Inc..7. Habib, M.K. Humanitarian Demining: Reality andthe Challenge of Technology - The State of theArts. International Journal of Advanced RoboticSystems. 4, 2 (2007), 151-172.8. Geneva Centre for Humanitarian Demining.Guidebook on Detection Technologies andSystems for Humanitarian Demining. Geneva,March 2006. http://www.gichd.org/gichdpublications/guidebook-on-detectiontechnologies/9. Weiser, M. The Computer for the 21 st Century.Scientific American, 265, 3, (1991), 306-312.10. Hollan, J., Hutchins, E., Kirsh, D. DistributedCognition: Toward a New Foundation for Human-Computer Interaction Research. ACM Transactionon CHI 7,2 (2000), 174 – 196..11. Aarts, E. Ambient intelligence: A MultimediaPerspective. IEEE Computer Society, 11, 1, 2004,12-19.12. Gibson, J.J. The Ecological Approach to VisualPerception. Boston, MA, Houghton Mifflin, 1986.167
Ubiquitous Sustainability: Citizen Science & ActivismEric PaulosIntel Research Berkeley2150 Shattuck Ave #1300Berkeley, CA 94704, USAeric@paulos.netMarcus FothQueensland University ofTechnologyBrisbane QLD 4059, Australiam.foth@qut.edu.auChristine SatchellInteraction Design GroupThe University of MelbourneMelbourne VIC 3010, Australiasatc@unimelb.edu.auYounghui KimHongik University72-1 Sangsu-Dong, Mapo-Gu,Seoul 121-791, South Koreayounghui@missingpixel.netPaul DourishDept of InformaticsUniversity of California, IrvineIrvine, CA 92697-3440, USAjpd@ics.uci.eduJaz Hee-jeong ChoiQueensland University ofTechnologyBrisbane QLD 4059, Australiah.choi@qut.edu.auABSTRACTIn this workshop we propose to explore new approaches tobring about real environmental change by looking at thesuccess of empowering technologies that enable grassrootsactivism and bottom up community participation.Ubiquitous computing is transforming from being mostlyabout professional communication and social interaction toa sensor rich personal measurement platform that canempower individuals and groups to gain an awareness oftheir surroundings, engage in grassroots activism topromote environmental change, and enable a new socialparadigm – citizen science. This workshop brings togetherfresh ideas and approaches to help elevate individuals tohave a powerful voice in society, to act as citizen scientists,and collectively learn and lobby for change worldwide.Author Keywordssustainability; environmental monitoring; citizen science;sensor networks; slogs; climate change; urban informatics.ACM Classification KeywordsH5.0. Information interfaces and presentation (e.g., HCI):General. K.4.2 Social Issues.PROPOSED URL OF SITE TO HOST PROGRAMhttp://www.urbaninformatics.net/green3/BACKGROUNDAs <strong>UbiComp</strong> researchers and practitioners we struggle tounderstand, test, and envision scenarios of our technologicalfutures, but as humans we have a collective higher calling –an ethical responsibility to acknowledge, address, andimprove our own health, the health of our environment, andPermission to make digital or hard copies of all or part of this work forpersonal or classroom use is granted without fee provided that copies arenot made or distributed for profit or commercial advantage and that copiesbear this notice and the full citation on the first page. To copy otherwise,or republish, to post on servers or to redistribute to lists, requires priorspecific permission and/or a fee.<strong>UbiComp</strong> 2008, Sep 21-24, Seoul, South Korea.<strong>Workshops</strong> Proceedings. Copyright held by the authors.promote more sustainable lifestyles. There exists bothsynergy and tension between the progress of <strong>UbiComp</strong> andenvironmental concerns. There is little doubt thattechnology is able to play a vital role in positiveenvironmental transformations. As <strong>UbiComp</strong> practitionersin this evolving field of environmental awareness andsustainability, we find more questions than answers. Whatare the big challenges? Are there standard approaches wecan share? What will really matter?Environmental conservation and anthropogenic climatechange are issues that can no longer be ignored by anygovernment, industry or academic community. Comparedto the rapid rate that technology has been developed andintegrated into everyday life, applications of ubiquitoustechnology to improve the ecological situation have laggedbehind. This workshop builds on the success of two priorimportant environmentally themed workshops: UbiquitousSustainability: Technologies for Green Values at <strong>UbiComp</strong>2007 and Pervasive Persuasive Technology andEnvironmental Sustainability at Pervasive 2008. Ourworkshop shares the goals of these two previous workshopsby bringing together a diverse range of practitioners fromcomputer science, engineering, sociology, architecture,urban planning, design, art, and other related fields. Itdiffers in its scoping to explicitly evoke concepts ofactivism and citizen science as a vocabulary for buildingtechniques, tenets, and technologies to bare on the issues ofTOPICS OF INTERESTPaulos [1] proposes citizen science as a way to enable aparticipatory urbanism: “We need to expand ourperceptions of our mobile phone as simply acommunication tool and celebrate them in their new role aspersonal measurement instruments capable of sensing ournatural environment and empowering collective actionthrough everyday grassroots citizen science across blocks,neighborhoods, cities, and nations.” While sensor richubiquitous computing devices usher in a compelling seriesof new device usage models that place individuals in theposition of influence and control over their urban life, there168
are a number of important barriers to the development andadoption of such systems. These research challenges formthe topics of interest for this workshop and include:From Socialite to Citizen: Redefining Identity –Ubiquitous devices such as mobile phones play a large partin helping the digital generation establish their sense ofidentity. We need only to look at marketing tactics to seehow the mobile phone has become an iconic representativeof 21st century lifestyle across geographical and culturalboundaries. How can the transformation of the mobilephone from a communications device to a ‘personalinstrument’ that helps us measure and understand the worldaround us similarly encourage the user to embrace an active,environmentally conscious and responsible lifestyle?Feedback Loops – What types of feedback loops provideinformation that allows users to see how their behavioralchange is impacting on the environment?Privacy and Anonymity – Users may desire to participatein public data collection but not at the expense of publiclydisclosing their daily location traces and patterns. Whatmechanisms can ensure privacy and guarantee a level ofanonymity for users and yet enable groups to makeconnections and foster open debates with their data?Calibration and DIY Culture – Citizen science bydefinition explicitly enables the use of scientific datacollection equipment by non-experts. The handling andusage of the sensors and measurement conditions will varywildly – in and out of elevators, handbags, pockets, subwaystations, etc. How can we reliably calibrate these sensors‘in the wild’? How can we create a common citizen scienceknowledge pool, lingo and nomenclature to identify, shareand discuss measurement data?Sensor Selection – What would be a reasonable set ofsensors to use and what conditions make sense to measure?Where should the sensors be mounted and in what contextsand positions are they best sampled?Environmental Impact – Finally, perhaps of greatestimportance, while the vision is to provide millions ofsensors to citizens to empower new collective action andinspire environmental awareness by sampling our world,the impact of the production, use, and discarding, ofmillions of ubiquitous sensors must be addressed. Does theoverall benefit of citizen science enabled by these newdevices offset their production, manufacturing, andenvironmental costs?Other Issues: Authentication and trust, hardwareextensibility, open platforms, software for sharing, and othertechnology that can support citizen science and grassrootsactivism such as wearables and carriables.SOUTH KOREA AND ENVIRONMENTAL ACTIVISMSouth Korea has a long history of environmental activismand provides an ideal setting to explore a set of culturallyspecific environmental challenges and the efforts to solvethem. For example, the Citizen Movement forEnvironmental Justice (CMEJ) founded by Seo Wang-jin in1999, has since become one of Korea’s fastest growingNGOs focusing on environmental justice and the fairdistribution of national resources. Korean environmentalcivic groups are also involved in grassroots politicalactivities. For example, the Civil Action for the 2000General Election (CAGE) consisting of 423 civilorganizations incl. a number of green groups successfullylaunched a ‘blacklist’ campaign in 2000. The blacklistcampaign was established to single out politicians they feltwere “not qualified to run” due to positions onenvironmental and social issues. Of 86 blacklistedcandidates, more than 60% failed to win their election.WORKSHOP FORMAT AND ACTIVITIESWe want to actively engage and acknowledge the culturalhistory and landscape of Seoul in the workshop’sinterrogation, learning, and debate of <strong>UbiComp</strong> technologyand strategies for environmental awareness, sustainability,and grassroots efforts. The workshop brings togetherpassionate practitioners into a shared forum to debateimportant issues emerging in this rapidly evolving field.To that end the workshop format balances a small degree ofindividual presentations of work with a more involvedseries of collective brainstorming activities and designinterventions. The workshop will serve as a ‘safe place’ toexplore this design space away from the pressures of ‘beingright’ and ‘bad ideas’ and leverage the location of Seoul asa palimpsest for active learning and exploration of thisimportant topic. The overall outcome will be a series ofnew design sketches and approaches to guiding <strong>UbiComp</strong>research forward in harmony with the issues of theenvironment and sustainability.THE ORGANISERSEric Paulos: Director, Urban Atmospheres, Intel ResearchBerkeley, USA. www.paulos.netMarcus Foth: Australian Postdoctoral Fellow, Institute forCreative Industries and Innovation, Queensland Universityof Technology, Australia. www.urbaninformatics.netChristine Satchell: Australian Postdoctoral Fellow(Industry), QUT & Interaction Design Group, TheUniversity of Melbourne, Australia.Younghui Kim: Professor of Digital Media Design,School of the Art and Design, Hongik University, Korea.Co-Founder, Missing Pixel, New York.www.younghui.comPaul Dourish: Professor of Informatics (and ComputerScience and Anthropology), University of California, Irvine.Jaz Hee-jeong Choi: PhD Candidate, Creative IndustriesFaculty, QUT, Brisbane, Australia. www.nicemustard.comREFERENCES1. Paulos, E., Honicky, R.J. and Hooker, B. CitizenScience: Enabling Participatory Urbanism. in Foth, M.ed. Handbook of Research on Urban Informatics: ThePractice and Promise of the Real-Time City, IGIGlobal, Hershey, PA, 2008.169
Live Sustainability: A System for Persuading Userstoward Environmental SustainabilityZita Chao-ling ChenGraduate Institute of Networkingand MultimediaNational Taiwan UniversityTaipei 10617 TAIWAN(886)921158403d96944006@ntu.edu.twYa-wen JongDepartment of ComputerScience and InformationEngineeringNational Taiwan UniversityTaipei 10617 TAIWAN(886)937333794r96922022@ntu.edu.twChad Chien-chia LiuDepartment of Civil EngineeringNational Taiwan UniversityTaipei 10617 TAIWAN(886)911866772r97521608@ntu.edu.twChuin-shan ChenDepartment of Civil EngineeringNational Taiwan UniversityTaipei 10617 TAIWAN(886)912259495dchen@ntu.edu.twChien-nan ChouDepartment of ComputerScience and InformationEngineeringNational Taiwan UniversityTaipei 10617 TAIWAN(886)921517723r96922021@ntu.edu.twABSTRACTThis paper presents an interdisciplinary study on social scienceand persuasive technology to build a novel human-centricsustainable system, Live Sustainability, which is aimed towardschanging the harmful behavior of people on the environment.Three human factors are considered to motivate people tobehave sustainably; these include: (1) awareness, (2) socialnetworking, and (3) feedback with rewards. Live Sustainabilityis used to record a user’s log with a sensing network throughRFID embedded cell phones and to react in real-time accordingto the user’s behavior. Additionally, a website with a rankingsystem and electronic pet for social influence is used to recordthe CO 2 emissions associated with consumption, transportation,and indoor activities. Preliminary studies have shown promisingbehavioral changes using Live Sustainability.KeywordsPersuasive technology, RFID, Sensing, Sustainable design1. INTRODUCTIONHuman behavior plays a key role in environmentalsustainability. Technology, when used properly, can play anactive role in persuading humans to adjust their habits in theirdaily lives to protect the environment. This paper is motivatedby the aforementioned observation and aims to develop ahuman-centric persuasive system, Live Sustainability, whichhelps people, pursue environmentally sustainable habits.In the following paper, we will demonstrate how a wirelesssensor network in conjunction with mobile technology andembedded radio frequency identification (RFID) sensors arePermission to make digital or hard copies of all or part of this work forpersonal or classroom use is granted without fee provided that copies arenot made or distributed for profit or commercial advantage and that copiesbear this notice and the full citation on the first page. To copy otherwise,or republish, to post on servers or to redistribute to lists, requires priorspecific permission and/or a fee.<strong>UbiComp</strong> 2008, Sep 21-24, Seoul, South Korea.<strong>Workshops</strong> Proceedings. Copyright held by the authors.used to enable Live Sustainability to track CO 2 emissions at theindividual level. Furthermore, Live Sustainability calculates thepersonal energy consumption in real-time, and reminds the userthe instant they make an inappropriate decision. The SustainableIndex, collected from the sensor network, measures a user’sdegree of eco-awareness. The index is transferred to the webserver and the mobile device instantaneously updates thisinformation. Lastly, a website is also utilized for peerassessment.2. RELATED WORKSystems associated with sustainability have raised much interestrecently. For example, EcoIsland [[1]] is a system aimed atreducing CO 2 emissions by changing the lifestyle of a family. Itprovides a connected social network for a family and theirneighbors. These families were more aware of environmentalissues after using EcoIsland; with most of them reducing theirCO 2 emissions. However, the lack of real-time monitoring inEcoIsland prevented just-in-time reminders and the resultingimmediate behavioral changes. TerraPed [[2]] motivates users tochange their behaviors that may harm the earth by remindingthem of the wastes they produce. However, it only providesfeedback on air quality while CO 2 emissions by individuals arenot considered. The users may not get direct feedback.The social network method has been used widely to motivateusers to improve their habits. For example, Khan and Canny[[3]] applied social marketing to persuade users to engage inenvironmentally sustainable behavior. In their work, socialinfluence plays an important role in the reduction ofconsumption. However, they only used comparisons betweenfriends to persuade users. Virtual Polar Bear is another socialnetwork example [[4]]. By showing a polar bear on broken ice,it shows the user the direct connection of their behavior to theeffects of global warming. However, the polar bear is only aphoto and does not interact with the user.170
3. HUMAN FACTORS3.1 Awareness: Promoting an environmentalconscience(a) (b) (c)Figure 1. Sensors (a) RFID reader and tags (b) currentsensor (c) screenshot of the cell phoneAwareness of one’s surroundings has a strong influence onone’s lifestyle. Sustainable management leads to more ecofriendlydecisions and thus a better world. In general, people arehabitual in their daily lives. They choose the same road whenthey go to school or office in the morning; eat similar foods; buysimilar groceries from the same stores; and instinctively turn onthe TV at home. All these routines are due to human habitualbehavior. However, these habits may, to different degrees, beharmful to the environment. To this end, the persuasivetechnology can be used to instill an environmental conscience inpeople. This is achieved through real-time reminders usingRFID sensor networks and mobile technology. The system isinstalled into a cell phone with an embedded RFID tag (seeFigure 1(a)) which is integrated into a current sensor network(see Figure 1(b)) and a web-based user interface. The platformof a system with Windows Mobile 6.0 Standard in a smart phonereveals the Sustainable Index with a color bar at the bottom ofthe screen (see Figure 1(c)) whilst the red color bar and phonevibration shows the CO 2 emissions rate. The number inquotation besides the Sustainable Index shows the increasingCO 2 emissions of users. These pre-emptive indicators are usedto remind users to change their behavior.3.2 Social Network: Magical Social Power ofCohesiveness in GroupsSocial networks that exhibit group cohesiveness and peerassessment have been studied [[5]]. The cohesiveness of groupsis an interesting issue. The obvious example is the socialinfluence between teenagers. Their friends, in certaincircumstances have a stronger influence on them than theirparents. Online social network site now has been one of populardestinations on internet such as MySpace and Facebook inUnited States, Cyworld in Korea, and Mixi in Japan [6]. Most ofusers register online social network for friend relationship, datastorage and sharing [7]. The Live Sustainability service utilizesthese group mindsets to motivate people in correcting their badhabits to form a new lifestyle. When one person of influencechanges his or her habits, the others imitate them. Consequently,a chain reaction of life style alteration occurs.Another interesting topic is peer assessment. Using the sameexample, teenagers engage in self-gratification throughcomparison with each other. When one person performs betterthan the others and is rewarded, it is likely to spark competitionwithin the group. In Live Sustainability, the eagerness to be atthe top of the hit parade speeds up this social effect. Our webbasedapplication associated with this system is developed withthe aid of ASP.NET. The Sustainable Index and Bonus arereceived from the server.3.3 Feedback: Emissions Trading SchemeProper feedback and rewards are important to motivate users tomaintain a responsible attitude towards the environment. In LiveSustainability, the origin of the feedback comes from theSustainable Bonus supplied from the CO 2 Bank. The concept ofSustainable Bonus is inspired by the well-known Kyoto protocol[8]. According to the protocol, the member countries have toreduce greenhouse gas emissions. The countries or companiesthat do not achieve their targets are required to buy emissionscredits from other countries or companies. Sustainability thusbecomes a measurable and tradable product.A possible business model is described below. Governmentswho sell emissions credits can give a part of this revenue to theCO 2 Bank to operate the Sustainable Bonus system. This Bankthen uses the Sustainable Index as its base unit for trading. Thisindex is the inverse of CO 2 emissions. Furthermore, this systemconverts the Sustainable Index to the Sustainable Bonus asopportunity cost in that it is generated from the opportunity costof the resources people save through behavioral changes. Thus,the Sustainable Bonus is directly proportion to the SustainableIndex. The Sustainable Bonus can be converted into realcurrency for purchasing commodities in the real world or intosupport of tree planting by a Non-Government Organization(NGO), such as Accin Ecolgica [9], I Plant Trees [10], andTree-planter.com [11]. In this way, a three-way win situation isbuilt by the cooperation between the users of the SustainableBonus system, the CO2 Bank, and the government. Peoplecreate a better world through changing their habits and savingresources. Moreover, these savings could be converted into treeplanting that leads to a more sustainable future.4. PROTOTYPINGFigure 2. System architectureThe system architecture is shown in Figure 2. Current sensorsmeasure real-time electricity usage, and RFIDs detect the user’sID. Electricity usage is converted into CO 2 emissions and thensent with the user’s ID to server. The server converts these CO 2emissions into the Sustainable Index and synchronizessimultaneously with the cell phone and website. Prototyping ofLive Sustainability is performed. Three categories which lead toserver CO 2 emissions are targeted. These are associated with171
(a) (b) (c)Figure 3. Screenshot for simulation (a) Consumption (b) Transportation (c) Indoor activity.consumption, transportation, indoor activity, and LiveSustainability Website as described below.4.1 ConsumptionAccording to [12], consumption is the major emissionsproducing activity in peoples’ daily lives. There are many kindsof products but they come from all over the world. For reducingCO 2 emissions, Live Sustainability encourages users to buylocal products with the immediate reward in the form ofSustainable Index (see Figure 3(a)). Conversely, when the userbuys imported products, they do not receive any rewards.4.2 TransportationTransportation is the second major activity of people. LiveSustainability tries to reduce CO 2 emissions by notifying theuser (in the form of a message to their cell phone) of theenvironmental impact of their chosen transport, such as thehigher CO 2 emissions of driving a car instead of taking publictransportation (see Figure 3(b)). The user may then change theirdecision due to the increased awareness of the harmful nature oftheir activity to the environment.4.3 Indoor ActivitiesThe third major source of CO 2 emission is the range of activitiesthat take place indoors. When the user enters into an indoorspace, Live Sustainability calculates the CO 2 emissionsassociated with turning on electronic appliances such as airconditioning, a television, a computer, etc. When other userscome in, all of the users share the CO 2 emissions (see Figure3(c)). For this reason, the operation of Live Sustainabilityencourages users to utilize this space in a more sustainablemanner.4.4 Live Sustainability WebsiteThe World Map shows a global view of people’s sustainablebehavior on earth (see Figure 4(a)). The system uses tree ranksbased on the Sustainable Index to indicate the level ofsustainability in the region. A tree with more flowers representsmore behavioral changes in a country. In Social Network, a top-10 rank of Sustainable Index with a personal photo is used forreinforcing a strong eco-awareness. Take MakeMeSustainable[13] for example, they provide users to achieve sustainable goalby tracking users’ energy consumption and using blog to sharesustainable strategies. In Our system, the users compete withtheir friends and feel satisfaction and pride in their rank. Themembers of the group are formed from the user’s friends inMSN, AOL, Yahoo massager, etc. Electronic pets are used toencourage behavioral change. The electronic pet simulates themolt of a caterpillar to various kinds of butterflies (see Figure4(b)). Moreover, the environment where the electronic pet liveschanges with their grades. The higher the level of a user’sSustainable Index, the more luxurious an environment isgenerated. With this peer competition, the user will try todecrease CO 2 emissions in order to reach a higher ranking in agroup. Tree Paradise provides a public call to encourage usersto donate their Sustainable Bonus for tree planting (see Figure4(c)). A tree map shows how many trees are contributed by auser in an area by donating their Sustainable Bonus. Each treeon the map appended with the donators’ names for publicityencourages the feedback of other users. In addition, a saplingindicates an area which is closest to receiving a completedonation. It encourages users to donate their bonus immediatelyso that they feel that they are a key figure in the tree’s birth.Finally, the Personal Log helps users to visualize the history ofCO2 emissions in their lives daily, weekly, and even yearly (seeFigure 4(d)). Through the log, the users can identify the patternof their CO2 emissions and the activities behind this pattern.4.5 ExperimentWe aim to build and demonstrate a working Live Sustainabilitysystem in Taipei at the end of 2007 to the middle of 2008. Theproposed test site is the Smart Home, in OpenLab, NTU. Inaddition there are opportunities to engage some of the other fieldlaboratories in the demonstration such as the Image and VisionLab, Intelligent Robotics and Automation Lab. We propose totie in access to some of these laboratories campus WiFinetworks, as well as populating the area with our own testnetwork and provide some of the graduate students with userdevices that they can loan to the laboratories to test the system.In this way we intend from the beginning to test not only thetechnical proficiency, but the life and social context too. Thefeedback from the tested students is positive that the LiveSustainability system changes their habits intuitively.(a) (b) (c) (d)Figure 4. Screenshot of web services (a) World trees map (b) Social network (c) Tree paradise (d) Personal log172
4.6 ScenarioBefore Live SustainabilityBob is a graduate student. He goes to lab by car every day. Upongetting to the lab, he always turns on all the lights and the airconditioning. As many people do, due to high temperature in thelab, he usually turns the air conditioning to the coldest setting.At noon, Bob goes out for lunch with his friends, but hesometimes leaves the air conditioning on. At the end of the day,he goes back home and surfs the internet.After Live SustainabilityOne day Bob finds many of his good friends using LiveSustainability so he immediately creates an account to keep infashion.Next morning, Bob prepares to drive his car to the lab as usual.When he is at the door, the phone vibrates. He finds out the LiveSustainability bar becomes red and the message shows, “HighCO 2 emission action, please take public transportation”. Afterreading the message, Bob decides to take the subway to go toschool. By avoiding heavy road traffic, Bob even reaches schoolearlier than he would when driving.After getting to the lab, Bob switches on the lights and the airconditioning as usual. His phone vibrates again. He realizes thatthe temperature he just set was too low, so he turns up thetemperature.At noon Bob goes for lunch. In the middle of lunch, his phonevibrates again; the message shows that the air conditioning isturned on without anyone being in the lab. He turns off the airconditioning remotely.On the way home, Bob stops by a grocery store to buy cookingoil. In front of the oil section, there are many kinds of oils. Hepicks up two different oils: one is a local product and the otherone is imported. He notices that there is a CO 2 reduction markon the bottle of the local oil. He decides to buy the local one.After dinner at home, he surfs on the internet as usual. He logson to the Live Sustainability website. On the website, he findsmany of his MSN friends on the top-10 rank. He selects the“Social Network” page and finds out that one of his friends,Mary, has an electronic pet that is still in the pupa level, whilsthis own pet has already turned into a caterpillar. He shows thisoff to Mary. After that, he clicks on the Tree Paradise icon. Hefinds a tree that can be planted after his donation, so he donateshis bonus for the tree to be planted. Right after his donation, hisphoto appears on the tree. He feels proud of himself.5. CONCLUSIONSA human-centric sustainable system is designed by consideringawareness, social network and feedback. A persuasive systemnamed Live Sustainability is developed. The system tracks theCO 2 emissions of people to generate a personal SustainableIndex. Pre-emptive reminders are issued to promote behavioralchange to improve sustainability. A business model involvingthe government, the CO 2 bank and the users is proposed torealize the system in future.6. BIOGRAPHYZita Chao-ling Chen: currently pursues a Ph.D. Degree atGraduate Institute of networking and multimedia in ComputerScience and Information Engineering at National TaiwanUniversity. Her research interests include: Storytelling,Interactive Media, and Psychogeometry to study how new mediacan be used to help people to discover their inner side.Chad Chien-Chia Liu: currently pursues a MS Degree in CivilEngineering at National Taiwan University. His researchinterests include: Software Architecture and Development forSmart and Sustainable Home.Chien-Nan Chou: currently pursues a Master’s Degree inComputer Science and Information Engineering at NationalTaiwan University. His interests include: Ubiquitous Network,Mobile Technology and Persuasive Computing.Ya Wen Jong: currently pursues a Master’s Degree inComputer Science and Information Engineering at NationalTaiwan University. Her research interests include: ServiceDiscovery Protocols and Fault-tolerant Middleware for theSmart Environments.Chuin-Shan Chen: is an Associate Professor in CivilEngineering and Deputy Director General at Center ofInnovation and Synergy for Intelligent Home and LivingTechnology at National Taiwan University. His researchinterests include: Smart Living and Sustainable Technology,Sensors and Actuators, Science-based Engineering Simulation,Multiscale and Multiphysics Simulation.7. REFERENCES[1] Takayama, C. and Lehdonvirta, V. EcoIsland: A system forPersuading users to Reduce CO 2 Emissions, Persuasive 2008[2] Stein, J. TerraPed: A design Concept for Sustainability,Persuasive 2008[3] Khan, O and Canny, J. Promoting Environmentallysustainable Behaviors Using Social Marketing in EmergingPersuasive Technologies, Persuasive 2008[4] Dillahunt, T., Becker, G., Mankoff, J. and Kraut, R.Motivating Environmentally Sustainable Behavior Changeswith a Virtual Polar Bear, Persuasive 2008[5] Asch, S. E. Opinions and social Pressure. ScientificAmerican, pp. 31-35. 1995[6] Boyd, D. Why Youth (Heart) Social Network Sites: TheRole of Networked Publics in Teenage Social Life. In D.Buckingham (Ed.), MacArthur Foundation Series on DigitalLearning, Identity Volume. (ed. David Buckingham).Cambridge, MA: MIT Press. 2007[7] Choi, J. H.-j. Living in Cyworld: Contextualising Cy-Ties inSouth Korea. In A. Bruns & J. Jacobs (eds.) 2006[8] The Kyoto protocol - A brief summary. EuropeanCommission. Available athttp://ec.europa.eu/environment/climat/kyoto.htm[9] Acci n Ecol gica. Available athttp://www.accionecologica.org/[10] I Plant Trees. Available athttp://iplanttrees.org/Home_Page.php[11] Tree-planter.com. Available athttp://www.treeplanter.com/[12] Information of Greenhouse Gases Emissions. Available athttp://co2.saveoursky.org.tw/[13] Make Me Sustainable. Available athttp://makemesustainable.com173
Motivating Sustainable BehaviorIan Oakley, Monchu Chen, Valentina NisiLab:USEUniversity of Madeira, Funchal, Madeira, Portugalian@uma.pt, monchu@andrew.cmu.edu, valentina.nisi@gmail.comABSTRACTPersonal resource consumption is a major issue insustainability. Consequently it has attracted a great deal ofattention in the research community across domainsincluding psychology, design and, more recently, HCI.Extending this body of work, this paper proposes thetheoretical basis and general design of a system intended toenable users to understand the effect of their resourceconsumption practices and the direct influence that changesin their behavior patterns will have. The system has not yetbeen constructed. The design is motivated by the desire toenable users to experiment with, draw conclusions on andpersonally optimize their personal energy consumption.This vision is fundamentally one of citizen scientists,empowered to take responsibility for and reason about theconsequences of their own actions. A further key element inthis paper is to support communities of users as theydevelop, share and promote these sustainable conclusionsand best practices, essentially aiding activists to spread theirlocal message about this key global issue.Author KeywordsMotivation, sustainability, resource consumptionACM Classification KeywordsH5.m. Information interfaces and presentation (e.g., HCI):Miscellaneous.INTRODUCTIONIn the face of environmental scares, rising costs for fuel andfood and diminishing availability of these resources [14],sustainability and the environment have become prominenteconomic and political issues across the globe, literallybecoming make or break issues in elections [e.g. 3]. In spiteof this, the level of change individuals enact in their ownbehavior remains worryingly low. This matters: resourceconsumption in the home and commercial sector is reportedPermission to make digital or hard copies of all or part of this work forpersonal or classroom use is granted without fee provided that copies arenot made or distributed for profit or commercial advantage and that copiesbear this notice and the full citation on the first page. To copy otherwise,or republish, to post on servers or to redistribute to lists, requires priorspecific permission and/or a fee.<strong>UbiComp</strong> 2008, Sep 21-24, Seoul, South Korea.<strong>Workshops</strong> Proceedings. Copyright held by the authors.to be almost 20% percent of overall consumption in theUSA [15], and up to 20 times per head greater than that inthe third world. Europe and developed Asia fare little betterwith multipliers of 12 and 10. This paper explores theissues underlying this discrepancy: why do vote green, butnot act it? And, more importantly, it offers a theoreticalunderstanding of how we as technologists and interactiondesigners can influence this trend.It achieves by reviewing the literature on theories ofmotivation and linking the conclusions of this discussioninto a framework of activism supported by technologicalsystems and services which allow individuals to capture,understand and communicate not only the impact of theirbehaviors but also the impact of their changes in behavior.By designing infrastructures that facilitate citizens inunderstanding and acting in their everyday energyconsumption practice, we hope to promote a positive visionof accepting personal responsibility for the resources weconsume and foster the image (and reality) of achieving abetter quality of life through the adoption of sustainablepractices [9]. We also anticipate that providing users withthese kinds of tool will support the grassroots developmentof products and service solutions [10] tackling sustainableissues.MOTIVATING SUSTAINABILITYThis position paper suggests the fundamental factorunderlying our unwillingness to integrate sustainablepractices into our everyday lives is one of motivation.Introducing DOTT 2007, John Thackara illustrates thissuggestion vividly [13]:"The house is cold, someone keeps turning the lights off,and the grey water toilet is blocked again. As a way of life,sustainability often sounds grim. The media don't help: theytell us we have to consume our way to redemption. Theshopping pages are filled with hideous hessian bags; andads that used to be placed by double-glazing cowboys nowfeature wind turbines, and solar roofs. Adding mentaldiscomfort to the mix, politicians scold our bad behavior asif we were children dropping litter. And preachyenvironmentalists expect us to feel guilty when we fail toembrace their hair-shirted future with joy. Could one planetliving be made desirable, better than what we have now?”174
Indeed, this is a theme which has long been examined in thedesign community (in, for example, the SusHouse project inthe late 90s [18]). It is concisely expressed by Manzini [9]:“the action of consuming less has to be combined with aperception of living better”.However, how this objective can be realized remains a topicof some debate and this paper turns to psychologicaltheories of motivation for insight. Although some of thesehave been explored in the context of computer scienceunder the general banner of captology [5], this paperprovides a brief review specifically focusing on how theycan be used to explain the lack of adoption of sustainablepractices in the developed world.In particular, we highlight goal-setting theory [7]. Thisframework identifies three major factors of an end state thatcontribute to how motivated an individual is to attain it:proximity (the length of time it will take), difficulty (howhard it is) and specificity (how well defined success is). Itsuggests that people are most motivated to achieve goalstates which are clearly defined and not too challenging orlong-haul. Unfortunately, most goals in sustainability donot take this form. For example, reducing a home energybill is a task which will take several months, may involvearduous efforts to enforce good practices on other familymembers and the influence of any given action (say usingless of an appliance) does not have a clearly observableimpact on the final result. Goal-setting theory predicts thatmotivating oneself to achieve a task of this nature would beextremely difficult.Another key concept is the distinction between intrinsic andextrinsic motivations [11]. The latter term refers tomotivations related to the achievement of external goalssuch as avoiding an unpleasant circumstance, impressinganother person or attaining a particular prize or status. Incontrast, intrinsic motivations (which have generally beenstudied by educational psychologists) lack obvious externalincentives but are generally thought to be more powerful.They have been linked to an individual’s belief thataffecting the desired outcome is within their control and ahigh internal level of interest (as in the pursuit of a hobby).Although sustainability concerns are often couchedexclusively in terms of extrinsic motivations such as savingmoney or attaining respect, combining these with appeals tointrinsic, self-driven motivations might make a moreeffective approach. Thackara hints at this issue in the quotegiven earlier: why is sustainability something we must becompelled to embrace? A better approach would surely beto make it more internally desirable, frame it as somethingpeople might actually want to do.CITIZEN SCIENCE AS SELF STUDYThis paper proposes to embody the motivational factorsreviewed above into a framework of citizen science. Toground this discussion, it deals with a specific example ofthe use of electricity in the home, although we believe theconcepts discussed can apply more generally: to water, fueluse and transportation. One key component of this system isa diverse set of devices to measure, display and controlresource usage and the efficiency of that usage. In theelectrical domain, this includes a network of power metersattached to individual sockets, room activity sensors,ambient displays and on/off device controllers. Althoughnumerous, these kinds of device are generally small andconsume relatively little power. They have been studied inthe context of sustainability by many previous researchers(see [2] or [12] for brief reviews) and some commercialproducts are already available.The novel aspect of the approach proposed in this paper isto focus on collating data from these devices with morenormal diary and activity logs in an on-line socialnetworking site. The main goal of this site will be to allowusers to visualize and understand their own resource usageover time through encouraging and supporting them inasking meaningful questions about it. These questionsmight relate to the current state of their energyconsumption, to some change they have enacted in theirhabits, to outcomes of future changes they might adopt or toa comparison between their usage data and that of one ormore other users of the system. By supporting this kind ofsophisticated hypothesis generation and test, people will beable to better understand the consequences of their ownactions and therefore to adjust their behavior in fullknowledge of its effects.This represents a fundamental shift in motivational strategywith the objective of demonstrating to users how smallchanges in their behavior can have clear significant effectsin their consumption. For example, many people may find ithard to connect the use of the lights in their kitchen andrestroom with their monthly electricity bill. Rephrasing thisas a percentage change in usage based on improvedbehavior acted out over the course of a single day or weekand then projecting that forward on to a period of weeks ormonths will make the impact clearer. Goal setting theorypredicts this simpler, more immediate and preciseexpression of goal states will increase people’s levels ofmotivation. Similarly, by empowering users with the abilityto understand the impact of their actions, we can appeal tointrinsic internal motivators. The value of setting achievablegoals has been stated previously in this domain [e.g. 16].The system proposed in this paper extends this concept withits focus on user experimentation in goal setting and goalachievement strategies.This approach also appeals to the concepts outlined inDemocratizing Innovation [6] which suggest that usersthemselves represent the most informed and aware expertsand innovators in many domains. This kind of tool wepropose in this paper will act to leverage this contextualknowledge and insight, and may lead to user generation ofnovel products, services and sustainable solutions tailoredto their specific context. Such outcomes could be used topromote local community change, start businesses or in175
dialog with policy makers and service providers. Thisconcept is expanded upon in the following sectiondiscussing activism.However, practically realizing such a system will be achallenging task. Bridging the gap between the kinds ofquestions and answers that otherwise untrained users mightmake and understand and those which an essentiallyanalytic computational system might reason on and resolveis a formidable problem. This paper indentifies developingsuch systems as a key research challenge and suggests thatthe solution will lie in harnessing the power of a communityof users. By enabling the sharing, searching and explorationof data, questions and results from many users, theknowledge and expertise available throughout thecommunity will be made available. Although there willnever be a one size fits all solution, many users in a givenphysical location will face common problems anddifficulties but some will be more able and willing to tacklethese than others. By leveraging the enthusiasm and skillsof these essentially activist users, a community systemcould promote their results and best-practices widely.Another key aspect of the system would be to enable usersto control and configure the infrastructure installed in theirhomes. This is a key element in the model of communityproblem solving: if one citizen solves a problem, anothermust be easily able to replicate that same fix in their ownlives and homes, including automatically configuring anyequipment installed there. Furthermore, customizable input,control and display infrastructure is essential to the conceptof the citizen scientist asking and answering questionsabout the impact of his or her own behaviors, practices andenvironment on resource consumption. For example, notinga high level of usage from a home entertainment system, auser might choose to connect up an ambient display to showthis information live and later explore whether this had anyeffect. Alternatively, a user might experiment with how hisor her behavior (and overall usage) changes whendeploying automatically controlled lights linked to anactivity sensor in the kitchen.A final benefit of this kind of community system has beenhighlighted by other authors, in particular Mankoff et al. [8]on the topic of sustainability. Grounded on a thoroughreview of the literature they propose exploring whethersocial networking technologies can enable behavior changerelating to resource consumption by tapping into factorssuch as group goal setting and competition. Mankoff’sapproach is clearly relevant to the one put forward in thispaper.ACTIVISMGenerally, activism is used to refer to directed action toinstigate social or political change in relation tocontroversial issues. Activists are often motivated byintrinsic factors, reinforcing the importance of rephrasingsustainability in these terms. Borshuk [1] enumeratesmotivating factors as: self-concept, socialization, the searchfor meaning and identity, values, personality attributes,political consciousness, a quest to join community life and aneed for status. On-line activism has also received attention.Vegh [17] describes three distinct categories:awareness/advocacy, organization/mobilization andaction/reaction. Respectively, these refer to the use ofinformation technology to distribute or promote a message,to organize events in the real world and to engage in“hackivism”, a term for virtual attacks such as denial ofservice.The concept of the activist as someone who engages indirect action, in the form of asking and answering questionsabout behavior and consumption in order to determine bestpractices, is central to the vision proposed in this paper.Equally, Vegh’s concept of using the internet as a means tospread awareness of issues and advocate for change iscentral. Highly motivated activists are a critical componentof how the system proposed here might work in an actualcommunity. Realistically, not all individuals will want toundertake the kind of hands-on investigations outlined inthis paper. So by providing enhanced tools to support thosewho do to communicate to and influence those who do not,we may be able to increase the rate at which new,sustainable practices are adopted. Furthermore, theempirical, numerical data that the system we propose cancapture may be able to create compelling, supportedarguments which citizens can present to other energystakeholders such as providers, policy makers andregulatory bodies. This kind of lobbying is a core part ofactivism and this proposed system has the potential toenhance it.EVALUATION APPROACHA multi-faceted evaluation of the approach outlined in thispaper is important. The simplest metric would be to assessthe ability of the system to effect changes in an individual’sbehavior. This is relatively easy to achieve by empiricallylogging resources consumed and qualitatively observinghow habits and practices develop. However, the socialcontext in which activism and community change takesplace calls for a broader mandate. The overall goal of theframework described in this paper is to promote bestpractices of resource consumption and energy efficiencymore effectively across a whole community.Correspondingly, any comprehensive evaluation needs toanswer the question of whether the approach described hereaccelerates the rate of social change compared to thatachieved with existing activist and top-down policystructures. This can only be realized by detailed, postprojectcomparative case studies contrasting the overallsocial and physical environment of a community which hasbeen using the system against one which has not. Althoughambitious and large scale, only through such in depthqualitative study can the true worth of the approachproposed in this paper be validated.176
CONCLUSIONSThis position paper has proposed a vision of motivatedcitizen scientists equipped with specialized tools whichenable them to capture and understand their resourceconsumption practices and in the role of activists,seamlessly communicate the most optimal ones to othersystem users and large-scale policy makers. These conceptsare in the preliminary stage of development, but we firmlybelieve they represent an empowering way in whichcitizens can take concrete action to generate novel solutionson sustainability issues and communicate these to theirpeers. It has been suggested that to achieve a sustainablelevel of resource consumption, a reduction of up to 90%from current levels may be called for [9]. Supporting usersin the generation of grass-roots solutions to their localproblems will be an important mechanism by which suchradical change can be achieved and this paper outlines oneway this activity can be supported.MADEIRA AND MUSE 2008This position paper is one result of MUSE 2008, a twoweek brainstorming workshop held in early July byLab:USE, a research group at the University of Madeira inPortugal. The theme of the workshop was “Interaction forSustainability”. Madeira is an isolated island (Morocco isthe closest continental country) with an increasinglyaffluent local population (of 270,000) and a large touristindustry. It has developed very rapidly in recent years.Beyond the common moral imperative to behavesustainably, these factors combine to place heavy demandson existing resource infrastructures. Sustainability is acritical issue for Madeira and the goal of this workshop wasto generate research proposals to address how interactivetechnologies could serve this need. Although its work onthis topic is at an early stage, Lab:USE is committed topursuing innovative research in the area of interaction forsustainability.Other concepts explored at MUSE 2008 included thegeneration of new services for tourism, a series ofawareness, educational and motivational games related torecycling and rubbish disposal and the requirements for acommunity and social networking site which would offercitizens a canvas on which to express their concernsrelating to environmental issues and development projects.AUTHOR BIOGRAPHIESIan Oakley is an assistant professor at the University ofMadeira and an adjunct assistant professor at CMU underthe CMU|Portugal agreement. His research interests are inthe psychology of interaction: the perceptual and cognitivehuman issues that underlie and affect how people adopt, useand relate to computational systems. Under this broadbanner, sustainability is an emerging topic of interest and hesees attending this Ubicomp workshop as an importantopportunity to get in touch with the community which isforming around this topic. He has recently spent two yearsdoing R&D in Korea (split between positions at GIST inGwangju and ETRI in Daejeon) and as a Scot shares PaulDourish’s affection for haggis.Monchu Chen is an Assistant Professor at the University ofMadeira teaching Interface and Interaction Design. Heholds a both a Masters and PhD in Human-ComputerInteraction from Carnegie Mellon University. He also hasan MA in Design from the National Chiao-TungUniversity and a BS in Computer Science from theNational Chiao-Tung University. He has lectured in theDept. of Arts and Design, University of Science andTechnology Beijing and has been a research associate at theACT-R Group, in the Department of Psychology atCarnegie Mellon University. Previously he has beena Research Assistant at the Lab of Brain and BehavioralScience, Dept. of Psychiatry, Chang-Gung Memorial and aHospital System Developer at Dayi.com. Monchu hasalso worked as a Multimedia Designer at EduPlus.com anda Software Engineering Officer, Combined Service ForceWeb Designer at the National Museum of Natural Scienceand at National Center for High-Performance Computingand Taipei National University of the Arts.Valentina Nisi is an Assistant Professor at the University ofMadeira under the CMU|Portugal agreement where sheteaches Designing for Service. She holds PhD on LocationAware Narratives and an MSc in Multimedia Systems fromTrinity College Dublin (TCD). Between 2006 and 2008Valentina worked as a designer and producer of LocationBased Mobile Stories in Ireland and Holland. Previouslyshe worked at MediaLabEurope in the StoryNetworksgroup and in the Distributed Systems research group atTCD researching the potential of wireless mobiletechnologies and audiovisual non-linear narratives.ACKNOWLEDGMENTSWe thank the participants of the University of Madeira’sMUSE 2008 event: Hong-mei Chen, Mark Gross, RickKazman, Charles Rich, Candy Sidner, John Zimmermanand the all the local Lab:USE faculty.REFERENCES1. Borshuk, C. (2004). “An Interpretive Investigation intoMotivations for Outgroup Activism”. The QualitativeReport, 9 (2), pp 300-319.2. Davis, J. (2008). “Towards Participatory Design ofAmbient Persuasive Technology” in PervasivePersuasive Technology and EnvironmentalSustainability (a workshop at the 6th InternationalConference on Pervasive Computing).3. Davis, M. (2007). "Rudd's renewable 2020 vision", TheSydney Morning Herald, October 31, 2007. Retrievedon 2008-07-02.4. Earth Trends. World Resources Institute. (2006).“Source:International Energy Agency (IEA) StatisticsDivision. 2006”. Retrieved on 2008-07-05.177
5. Fogg, B. J. (2002). “Persuasive Technology: UsingComputers to Change What We Think and Do”. MorganKaufman Publishers.6. Hippel, von, E., (2005). “Democratising Innovation”.MIT press.Cambridge, Massachusetts. London,England.7. Locke E, A. & Latham, G.P. (2002). “Building aPractically Useful Theory of Goal Setting and TaskMotivation”, American Psychologist, 57 (9), pp 705-717.8. Mankoff, J., Matthews, D., Fussell, S. R. & Johnson, M.(2007). “Leveraging Social Networks To MotivateIndividuals to Reduce their Ecological Footprints”. InProceedings of the Fortieth Annual Hawaii InternationalConference on System Sciences, Computer SocietyPress.9. Manzini, E., (2006) "Design for Sustanability",http://www.sustainable-everyday.net/manzini/, onlinepaper retrieved on the 4.07.2008.10.Morelli, N., (2002) "Designing Product/Servicesystems". In Design Issues, Vol 18, N.3, Pag. 3-17.11.Ryan, R.M. &Deci, E.L. (2000). “Intrinsic and ExtrinsicMotivations: Classic Definitions and New Directions”.Contemporary Educational Psychology, 25 (1), pp 54-67.12.Sustainable-everyday.net:http://www.sustainableeveryday.net/scenarios/?.page_id=26. Retrieved on the 4-07-2008.13.Thackara, J. (2007) “Why our design festival has nothings in it”. www.doorsofperception.com/archives/2007/10/why_our_design.php. Retrieved on 2008-07-05.14.United Nations Environment Programme (2007).“Global Environmental Outlook: GEO4 Report”.15.U.S. Department of Energy (2008). “Annual EnergyOutlook 2008”. Energy Information Administration,Washington, DC DOE/EIA-0383.16.van Houwelingen, J. H. & W. F. van Raajj (1989). TheEffect of Goal-Setting and Daily Electronic Feedback onIn-Home Energy Use. Journal of Consumer Research,16(1), pp 98-105.17.Vegh, S. (2003) ‘Classifying Forms of Online Activism:The Case of Cyberprotests against the World Bank,’ pp.71-96 in McCaughey and M.D. Ayers (eds.)Cyberactivism: Online Activism in Theory and Practice,New York and London: Routledge.18.Vergragt,P., Green K., "The SusHouse Methodology.Design Orienting Scenarios for Sustainable Solutions",Journal of Design Resarch 2001, Vol 1, No 2178
Carbon Metric Collection and Analysis withthe Personal Environmental TrackerRobert S. BrewerUniversity of HawaiiUbiquitous Wireless Applications GroupLaboratory for Interactive Learning TechnologiesDepartment of Information and Computer Sciences1680 East West Road, POST 309Honolulu, HI 96822, USArbrewer@lava.netABSTRACTThe Personal Environmental Tracker (PET) is a proposedsystem for helping people to track their impact on theenvironment, and to make changes to reduce that impact,creating a personal feedback loop. PET consists of sensorsthat collect data such as home electricity or gasoline usageand send it to a database for analysis and presentation to theuser. By collecting data from diverse sources, PET can helpusers decide what aspect of their lives they should makechanges in first to maximize their reduction inenvironmental impact. PET’s open architecture will allowother ubiquitous sustainability researchers to leverage theinfrastructure for research in sensors, data analysis, orpresentation of data.Author KeywordsUbiquitous computing, sensors, environmental change,mobile devices, social networking, feedback loop.ACM Classification KeywordsH5.0. Information interfaces and presentation (e.g., HCI):General. K4.2 Social Issues.INTRODUCTIONIt is widely recognized that the global climate is warmingdue to anthropogenic sources [7]. There are an increasingnumber of people interested in making personal changes toreduce their contribution to climate change. We focus ourefforts on these people who are actively seeking to reducetheir carbon footprint. These users have questions abouthow best to direct their efforts, such as “how muchadditional electricity does increasing the thermostat on thePermission to make digital or hard copies of all or part of this work forpersonal or classroom use is granted without fee provided that copies arenot made or distributed for profit or commercial advantage and that copiesbear this notice and the full citation on the first page. To copy otherwise,or republish, to post on servers or to redistribute to lists, requires priorspecific permission and/or a fee.<strong>UbiComp</strong> 2008, Sep 21-24, Seoul, South Korea.<strong>Workshops</strong> Proceedings. Copyright held by the authors.air conditioner by one degree consume?” or “how muchless carbon is released by carpooling with someone wholives nearby rather than driving alone?” We need to providea system that allows users to perform informal experimentsrelated to their daily lives and provide rapid feedback on theresults of those experiments.Another important question these users face is “what are therelative contributions of different activities to my carbonfootprint (driving, air travel, heating/cooling home,entertainment, food, consumer purchases)?” While trackingusage in individual areas (home electricity usage,automobile gasoline consumption) is important, thecomparative contributions to the user’s carbon footprintmust be determined for rational decision–making. Thisapproach allows users to prioritize among the manypossible ways they can reduce their environmental impact.SYSTEM DESCRIPTIONOur proposed system, the Personal Environmental Trackeror PET, will help users reduce their footprint in three steps:collecting data about their daily activities, converting theraw data into a carbon footprint, and embedding the resultsin social networks, forming a feedback loop forenvironmental change.SensorsPET will collect data about users’ lives through aconstellation of sensor inputs. While our target users arealready motivated, it is critical that the effort required tocollect data is kept as low as possible. Many people livebusy lives, and excessive overhead for data collection mayconvince users that collection is not worth the effort,especially when the environmental results might not be seenfor decades. We see several ways to collect data: physicalsensors, information sensors, and manual sensors.Acquiring data from physical sensors is a commonly usedmethod. For example, systems for tracking electricity usagefor a whole house [4], or a single device [9, 8] already exist.Positional data from GPS units (such as those in somesmartphones) can allow estimation of carbon output based179
on mode of transportation such as the Carbon Hero system[5]. One could even imagine a tailpipe sensor attached to anautomobile that directly tracked greenhouse gas emission.The disadvantage of physical sensors for data acquisition isthat it often requires the purchase and installation ofequipment to collect the data or extract it in digital format.The exceptions are sensors that piggyback on an existingdevice, such as the GPS capabilities of a mobile phonealready carried by the user.Calibration of the sensor data is an important topic toaddress because data can be collected from number ofdifferent types of physical sensors under varyingcircumstances. Because PET will have raw data collectedfrom users with different sensors, the accuracy of sensorscan be compared for users performing similar activities.Users with access to different sensors of the same type(such as whole-home electrical usage) could use bothsensors simultaneously to gauge their accuracy andcompare them to the values provided in the bill from theutility company. For sensors where each instance has avariable degree of error, users could be directed to astandardized trial (such as walking between two points forcalibrating a location sensor) and the results compared toresults from other users.An increasing amount of relevant data is already availableonline; it merely needs to be mined and processed to beuseful to PET. We call these sensors that gather data fromdigital sources information sensors. One area with abundantdata is credit or debit card transactions. Those users whomake most purchases with credit cards possess a wealth ofinformation that can provide data on environmental impact,such as buying gasoline, food, or consumer products.Personal finance web applications such as Wesabe(http://www.wesabe.com/) have demonstrated that it ispossible to securely make use of credit and debit cardtransaction information to aid users in tracking theirfinances. Retrieving electricity usage data from utilitywebsites is another source of data already being used bysystems such as Personal Kyoto (http://personalkyoto.org/).PET can also leverage the data users arevoluntarily maintaining online, such as travel itineraries inthe TripIt web application (http://www.tripit.com/).To reduce overhead for users, automation is generallypreferable to manual data entry. In some cases, however,users will need to take explicit action to record data forPET. We believe mobile devices can significantly reducethe effort required for manual entry, and allow the datacapture to happen at the time and place of event beingrecorded. For example, mobile phones can scan RFID tagscontaining the carbon footprint of products thatmanufacturers may embed in the future [1]. Cameras inmobile devices can capture the ubiquitous barcodes onproducts, or scan receipts for later analysis by opticalcharacter recognition. Speech-to-text services such as Jott(http://jott.com/) can provide for hands-free data entry, andof course, users can always fall back to typing into theirmobile device.AnalysisAs data are collected, PET can provide a variety ofanalyses. One particularly useful analysis would be tocondense the data down to a single number representing theuser’s carbon footprint. A single value would allow the userto easily see how their behavior is impacting theenvironment, and allow comparison with other people andgroups.It is important that the feedback and analysis of the useractivity be as immediate as possible. For effective behaviormodification, the delay between action and understandingits impact should be short, measured in minutes or hours,not days and weeks as most utility bills are.Calculating the carbon footprint of activities requires theuse of estimates and averages for some factors. Because thebest guesses for these values may change over time, orthere might be differences of opinion on how best tocompute the footprint, we propose making the analysismethods user–modifiable, further permitting users toparticipate in the scientific process. To permit comparisonand aggregation of footprint data, there will be a canonicalcalculation formula that will be updated over time as bettertechniques become available. Users can modify thecanonical formula to perform “what if” calculations on theirown data, and share their formulas with other users fordiscussion.PET only displays the results and analyses of users’ actions,and does not prescribe how users should modify theirbehaviors. The aggregation of sensor data from multipleaspects of users’ lives ensures that they can see whatbehavior changes make most sense for them.Social networksAllowing users to go beyond just looking at their ownfootprint, to see it in context with other users’ can be animportant way to motivate change in the long term.Comparisons with friends, neighbors, and others around theworld can give users the motivation to continue to orredouble their efforts. Friendly competition can be helpful,but it’s important that the desire to improve one’s standingthrough manipulation of sensor data not get in the way ofthe underlying goal of reduced environmental impact.Integration into social networks can facilitate users sharingknowledge about how to reduce consumption, andemotional support from like-minded individuals.SYSTEM ARCHITECTURETo support the range of functionality described above, weenvision the architecture of PET as a multi-tiered systemusing HTTP and representational state transfer (REST) [6]to tie the components together. Figure 1 shows a blockdiagram of the system architecture. Sensors are device orservice-specific plugins that collect data and send them to a180
Figure 1: PET system architecturesensor database. The sensor base component simply storesdata for later recall by analysis tools. Analysis tools retrievesensor data from the sensor base, and in some cases, passtheir results to higher-level analysis tools. For example,sensor data about gasoline usage in the sensor base mightbe converted to an estimate of greenhouse gas emissions,which could then be used to compute the relativecontribution of gasoline usage to the user’s carbonfootprint. Presentation tools can take up the results of theseanalyses for display as web pages, to virtual polar bears [3],or interactive games [11]. In fact, the social networkfunctionality discussed earlier could be built as anapplication for existing social network systems (such asFacebook or Orkut) that is just another presentation tool fordata in the sensor base.PET strives to be as open as possible. The use of HTTP andREST allows sensors, analyses, and presentation tools to beimplemented in any language. Standardized formats forsensor data will allow easy implementation of new sensors,and decouple sensor development from analysis andpresentation. Tracking a new type of activity only requiresthe creation of a new sensor that talks to the existing sensorbase. All the existing analyses can be applied to the newdata source. Experiments on new persuasive computingtechniques to change user behavior can be structured asnew analysis and presentation tools on top of the raw sensordata or lower-level analyses.The system will be open source, enabling a broaddevelopment community to take shape. In particular, havingan open source sensor base allows organizations that wishto collect data but do not want it to be public, to set up theirown servers for internal use.Most users would send their data to a centralized defaultserver open to the public. In PET, users will own their data:they should be able to download their data, move itelsewhere, or remove it from the system entirely. Thepersonal finance site Wesabe was a pioneer in this area withtheir users’ “data bill of rights” 1 , which applies equally wellto the environmental data we intend users to collect.The spectrum of data that PET collects on the user’senvironmental impact is potentially quite private (locationtraces, travel history, etc.) and some users may not wish toshare their data. The raw data are required for accurateanalysis; however, for discussion and sharing among theuser’s social network, only the aggregated values resultingfrom the analysis are required. A public PET server cancollect data from all users, but it only allows users access totheir own raw data. The server can distribute aggregateddata and the results of analyses among users without undulyintruding into users’ privacy. For those users who areunwilling to entrust their raw data to a public server, anoption to create a personal analysis system that runs on theuser’s computer can be considered, optionally sending theresults of the analyses to the public server for aggregation.INITIAL IMPLEMENTATIONThe initial implementation of PET should provide the entireworkflow from data collection to analysis and presentationfor two different types of sensor data. The APIs and dataformats used by the sensors and the sensor base need to bewell defined to support additional development by externaldevelopers. This infrastructure would allow an initialevaluation of our claims about the utility of having sensordata from different aspects of daily life merged into a singlepresentation.Once the initial implementation is complete, we would seekto build an open source community around the system tosupport more sensor input types and more analysis andpresentation tools.CONTRIBUTIONSThe idea of recording data about people’s lives and trackingtrends to help reduce their environmental impact has beenthought of before [10]. PET differs from previous work inthis area by offering a comprehensive open framework forthis endeavor. PET would provide infrastructure for otherresearchers in both data collection and analysis, potentiallyspeeding progress. Researchers working on new analyses orpersuasive presentations of data could focus on the analysesrather than having to also spend their time constructing asystem for collecting sensor data. Researchers developingnew sensor inputs would have a natural destination for theirdata that allowed them to perform useful analyses.Since PET will collect data in multiple aspects of users’lives (electricity usage, gasoline usage, etc), it can provideuseful information on the meta question of what area a usershould focus his or her efforts to reduce environmentalimpact. This approach differs from most systems that focuson only one area such as home electricity usage or carbonreleased from personal transportation usage.1 https://www.wesabe.com/page/security181
In order to be useful, PET requires data input from sensorsand analysis by computers, each of which create their ownenvironmental impact. As described earlier, PET acceptsdata not only from physical sensors, but also informationsensors and technology-assisted manual data entry. Thesensors seek to leverage existing devices (such as mobilephones) and existing behaviors (such as personal financialtracking), which significantly limits the additional impact ofdata collection. A survey of studies on usage feedbacksystems in energy consumption found that savings on theorder of 10% or more was quite achievable [2]. If PET canenable users to make a comparable reduction inenvironmental impact, the additional costs of datacollection, analysis, and social collaboration will be quitesmall in comparison.While we have focused on the issue of climate change, PETcould easily be extended to track other sustainability topicssuch as water usage, habitat loss, and social justice throughthe creation of new sensor inputs and new analysis andpresentation tools.PET will provide its users with insight into their ownenvironmental impact, and the impact of others in theirsocial network. That foundation of understanding, based onhard data, provides the platform for advocacy and activismin their jobs and communities. PET users can speak fromdirect experience on how environmental impact can bereduced, and demand those reductions from their employersand their elected officials.In the broader context, the data collected andexperimentation with analyses could provide more accuratemodels for calculating carbon footprints when fine-graineddata are not available. The results could feed back intopolicy decisions, which could be based on data gatheredabout how people actually live. Finally, users positivebehavior modifications would have a direct impact onclimate change.BIOGRAPHYRobert Brewer is a research assistant on the UbiquitousWireless applications team in the Laboratory for InteractiveLearning Technology (LILT) at the University of Hawaii atManoa. He is pursuing a PhD in the Information andComputer Sciences (ICS) department with a focus onubiquitous computing and environmental awareness.Robert graduated from Reed College in Portland, Oregon in1992 with a Bachelor of Arts degree in Physics. In 2000, hereceived a Master of Science degree from the ICSdepartment at the University of Hawaii at Manoa. His thesisresearch focused on improving mailing list archives.Robert also has experience in industry. As one of thefounders of LavaNet (a Hawaii-based Internet ServiceProvider), Robert also took an active management role asvice president and technical manager for the first threeyears of LavaNet's existence. Over LavaNet's 14-yearhistory, he worked as a senior technical specialist on avariety of Internet infrastructure projects.MOTIVATIONThe Ubiquitous Sustainability workshop is closely alignedwith the research area for my dissertation. Feedback fromthis workshop can further shape my ideas as I prepare mydissertation proposal. Learning the latest research directionsfrom like-minded individuals will grow my knowledge ofrelated work in this area.REFERENCES1. Dada, A., Staake, T., and Graf von Reischach, F.Displaying Dynamic Carbon Footprints of Products onMobile Phones. In Demo Session of Pervasive 2008,(2008).2. Darby, S. Making it obvious: designing feedback intoenergy consumption. In Proc 2nd InternationalConference on Energy Efficiency in HouseholdAppliances and Lighting. Italian Association of EnergyEconomists, Naples, 2000.3. Dillahunt. T., Becker, G., Mankoff, J., and Kraut, R.Motivating Environmentally Sustainable BehaviorChanges with a Virtual Polar Bear. In WorkshopPervasive Persuasive Technology and EnvironmentalSustainability. Pervasive 2008, (2008).4. Energy, Inc. The Energy Detective.http://www.theenergydetective.com/.5. European Space Agency. Tracking your carbonfootprint.http://www.esa.int/esaCP/SEM7MVVHJCF_index_0.html6. Fielding, R. T. and Taylor, R. N. Principled design ofthe modern Web architecture. ACM Trans. InternetTechnol. 2, 2 (May. 2002), 115-150.7. Intergovernmental Panel on Climate Change. IPCCFourth Assessment Report: Climate Change 2007,http://www.ipcc.ch/8. LeBlanc, J. Device-Level Power ConsumptionMonitoring. In Workshop on Ubiquitous Sustainability,<strong>UbiComp</strong> (2007).9. P3 International. Kill-A-Watt.http://www.p3international.com/products/special/P4400/P4400-CE.html10.Sutaria, R., Deshmukh, A. Taking the Guesswork out ofEnvironmentally Sustainable Lifestyles. In WorkshopPervasive Persuasive Technology and EnvironmentalSustainability. Pervasive 2008, (2008).11.Takayama, C., Lehdonvirta V. EcoIsland: A System ForPersuading Users To Reduce CO2 Emissions. InWorkshop Pervasive Persuasive Technology andEnvironmental Sustainability. Pervasive 2008, (2008).182
GreenSweeper: A Persuasive Mobile Game forEnvironmental AwarenessHui-chun Lin, Kah Liu, and Nithya SambasivanDepartment of InformaticsUniversity of California, IrvineIrvine 92697-3425, CA, U.S.A.{huichunl, kahliu, nsambasi} @ics.uci.eduABSTRACTIn this paper, we discuss GreenSweeper, a collaborative, mixedreality,photo-based mobile game aimed at promotingenvironmental awareness. By collectively sensing theenvironmental landscape through photographs and textdescriptions of surrounding artefacts, GreenSweeper is designedto be more than just fun, to deliver environmental messages andprovoke reflection. In this paper, we briefly discuss the design andimplementation of GreenSweeper, followed by a brief discussionon the value of persuasion and mixed realities in promotingenvironmental awareness.Categories and Subject DescriptorsD.3.3 H5.2 [Information interfaces and presentation]: UserInterfaces. - Graphical user interfaces. K.4.2.Social IssuesKeywordsMobile games, Sustainability, Urban computing, Persuasivetechnologies, Serious gamesINTRODUCTIONThe urban landscape is constantly negotiated and re-appropriatedthrough informal urbanities, signage, hoardings, and housing orindustrial developments. However, in the midst of these urbanspaces, we rarely stop to think about the damage to surroundingenvironmental landscape. Environmental sustainability is oftentreated as resulting from making conscious, environmentalfriendlydecisions. This form of separation from our everydayinteractions posits environmental sustainability as a complex,disconnected notion. However, weaving environmental awarenessinto our lifestyles, by reflecting on our local surroundings and theartefacts that we use regularly, could help us better understand theworld around us.A characterising feature of infrastructures is that they are sunkPermission to make digital or hard copies of all or part of this workfor personal or classroom use is granted without fee provided that copiesare not made or distributed for profit or commercial advantage and thatcopies bear this notice and the full citation on the first page. To copyotherwise, or republish, to post on servers or to redistribute to lists,requires prior specific permission and/or a fee. <strong>UbiComp</strong> 2008, Sep 21-24, Seoul, South Korea.<strong>Workshops</strong> Proceedings. Copyright held by the authors.into and inside of other structures, social arrangements, andtechnologies, adopting Star’s description [6]. Urbaninfrastructures are fraught with issues such as increasing damageto flora and fauna, energy depletion, pollution, garbage, and toxicwastes. The embeddedness of urban infrastructures results ingreater cumulative damage, which goes unnoticed until itmanifests itself as a colossal catastrophe. The problem here is thatwe do not take notice of the surrounding environmental landscapeon a day-to-day basis.In a parallel vein, the advent of mobile devices has spurred a slewof mobile applications supporting environmental sustainability,such as the usage of mobile sensors to create maps representingenvironmental damage [7], and the generation of environmentaldata for consumer products [5]. We extend the notion ofParticipatory Urbanism and citizens acting as agents of change[4]. We briefly present GreenSweeper, a mobile, mixed reality,photo-based game designed to promote environmental awareness.By collaboratively marking out the greenness of the infrastructure,our goal is to raise awareness of surrounding environmentalsustainability issues that deem further action. GreenSweepermakes use of photographs and text descriptions of artefacts toqualitatively define the environmental landscape. In the followingsections, we will provide descriptions of the game design andtechnical implementation of GreenSweeper.GAME DESIGNOur motivation for GreenSweeper is to promote a new delivery ofenvironmental awareness by combining game play with reflection.GreenSweeper differs from typical handset games like Snake,Tetris, or Bejweled, by layering meaning through combiningelements of the real world with the virtual. It is designed to beplayed by pedestrians or cyclists within bounded urban grids. As aserious game, GreenSweeper informs users about the greenness ofthe surrounding infrastructure, by which we hope to shed light onenvironmental damage and impact. We initially prototyped oursystem to work on the UCI campus, but it could be scaled to anymap. GreenSweeper works both indoors and outdoors, as long asa network connection is available.GreenSweeper is motivated by Minesweeper, in that the primegoal is detecting and avoiding mines on a grid. In our game, thepresence or absence of mines is determined by the level ofgreenness. The user first selects a square on the map, then shootsa picture of the most green/non-green object within an area, and183
provides a relevant description and green/non-green tag. The mapcan be programmed to be any geographical map. This tag servesas input for the learning algorithm which determines whether ornot there is a mine in the area. Initially the mines are chosen atrandom, but on reaching a convergence point with increased inputfrom users, the algorithm thresholds out areas with more nongreentags as mines. The pictures, descriptions, and tags are sentto a public account on Flickr, which are later randomly displayedat the end of each game session, along with the user's picturehistory. By displaying pictures, we provide compelling visualfeedback of environmental impact.The GreenSweeper system architecture is composed of NokiaN800s connecting to Flickr photo sharing web application and anAMP (Apache, MySQL, and PHP) web server. The Nokia N800is the front end of the system, running the GreenSweeperapplication that consists of the graphical user interface and gamelogic. The front end of the system communicates with both Flickr,to store photos, and the web server, for processing. The back endof the system consists of Flickr and GreenSweeper’s web server.The web server serves the content to the Nokia N800 device andalso gathers information from the user’s data stored on Flickr.We do not employ any automatic location-detection techniques;rather we gather location data from the user input. The rationalebehind this design decision is to allow the device to theoreticallywork smoothly in any wirelessly-connected area, but by bypassingproblems of General Positioning Systems (GPS) withinclosed doors and Wi-Fi based positioning in areas without accesspoints. Wi-Fi based positioning is attractive, however, along withthe issue of not having enough access points to cover most areas[2], there is the issue of the variance of Wi-Fi signals. In addition,due to our large environmental landscape, surveying Wi-Fi accesspoints will be an issue. The larger variance of Wi-Fi signals seenby moving users [3] may present problematic data toGreenSweeper’s server, for example, a location can be mistakenlyreported as another.3. SYSTEM ARCHITECTUREBack-end:GreenSweeper offers a game play that reflects the environmentalsustainability of the area that surrounds the users by placing minesin areas that are less environmentally friendly than others. Inaddition, we wanted to support many users accessing the systemand a system that can support a large user base and user generateddata. Our goal for the backend was to create a system that allowedfor scalability, reliability, security, minimal latency, and have agood performance to allow for a multiple users. To support this,we implemented a system that allowed for growth and easyintegration to future development. The developed system usesvarious technologies to collect and generated data from and to theusers.GreenSweeper’s backend is build upon an AMP (Apache,MySQL, and PHP) web server along with Flickr for photostorage. The web server provides GreenSweeper the map ofmines, collect information generated by the user’s game play, anddisplay information on area’s environmental sustainability. TheFlickr account allows a large storage area for users to submit theirphotos along with meta-data that is relevant to the study,including meta-data on the game played, general location, and thegreenness according to the user. The Flickr album is made publicso users of the game can view the pictures of the area played togain more information on what other users perceives asenvironmentally friendly/un-friendly.The mines in GreenSweeper are generated through an algorithmusing the weight based on an area’s greenness. We were able todetermine the area’s greenness by applying a small weight toevery user’s photo submission. The photo submissions includemeta-data on the game played, general location, and the greennessaccording to the user. This user generated data is stored withinFlickr until a nightly update is activated on GreenSweeper’s webserver, in which it parses the information and updates the dataaccordingly. Using this data, we can effectively generating anapproximation of the greenness of an area by allowing the usergenerated location weights within the algorithm. An area that ispersistently non-green will have a higher percentage of having amine than a location that is greener according to the users. Over aperiod of time, we predict the user-generated data will reach aconvergence point in which the data will accurately present a mapwith locations of environmental friendly/un-friendly locations.Figure 1 – High level architecture of GreenSweeper with flow ofinformation within the system.Front-end:The Nokia N800 tablet was chosen for its large screen, built-incamera, and ability to connect to wi-fi networks. The userinterface is written in Python using the PyGTK framework, a setof wrapper classes for the GTK+ library. The application runs onthe default Maemo development platform and Hildon framework.The camera programme is written using Python bindings for theGstreamer library, a multimedia framework.The game logic of GreenSweeper includes network connectionand mine determination. We query the mine map from the serverfor the particular grid, which has a total of 4 mines in 3X3 subgrids,through Python urllib connection. Then, we notify thesever, through urllib protocol, to check photos on the Flickralbum when the game session is over. Pictures taken by the userto Flickr are uploaded by emailing contents through SMTPprotocol directly to the unique address of the Flickr account.Based on the mine map retrieved from the server, the user can seehow many of the square's neighbours are mines. All minesexplode if the square is a mine, ending the game. Also, the usercan flag the square, which is equivalent to right-clicking thesquare and marking it as a suspected mine.184
4. DISCUSSIONIn this section, we will discuss aspects of GreenSweeper relevantto the theme of the workshop.Value of Mixed Reality in Environmental Sustainability:GreenSweeper seamlessly combines elements of the real worldwith the virtual game play. Environmental degradation is aphysical issue – it concerns changes in air quality, level ofcontaminants in water, amount of CFCs released by auto-mobiles,and so on. Solutions to monitor sustainability should be as closetied to the real world as possible. By creating a non-immersiveenvironment, that mandates the player to devote equal amounts ofattention to the physical and the virtual worlds, actions inGreenSweeper directly translate to and result from meaningmakingin the real world.Figure 2 – Various pictures shot using GreenSweeperGreenSweeper as a Persuasive Game: GreenSweeper supportsexisting cultural and social positions by allowing the player todocument artefacts, but also contributes to influencing theposition, leading to a change. When these changes are significant,the player will be motivated to act on the issue. [1] Theimmediate outcome of GreenSweeper is not as important as theunderstanding of the world. The implications of players' actionsserve more than the purpose of momentary recreation orcompetition. The game has function and outcome, both whileplaying the game and outside of it.Raising environmental awareness: Awareness of environmentalissues is the first step towards building a sustainable environment.GreenSweeper underscores artefacts that are typically ignored, byforcing the user to find an artefact and evaluate its greenness.Moreover, the player has to move around the grid to advancefurther in the game, inherently exploring different areas. Bytightly integrating data collection with recreation, we hope tohighlight problems in the surrounding environment. By collectivequalitative sensing, we hope to gather a range of opinions onurban infrastructures.Deductive and Descriptive: We construct a space for twoexperiences – deductive, that allows game play and competition,and descriptive, that allows exploration of the area andcontribution to information content. They are mutually inclusive,since the user has to describe the artefact in order to play thegame. By encouraging deductive playfulness and modelling on afamiliar game, we hope to sustain the interest of the player, whileimplicitly sampling the world.Reflection and reflection: We speak of two kinds of reflectionhere – mirroring and cogitation. By displaying the player's picturehistory, GreenSweeper mirrors the player's pictures to reveal theimport and meaning of hir actions. By displaying other players'pictures and descriptions, unpredictable, intersection/nonintersectingdecisions and artefacts captured by other players areshown. This may lead to cogitation, surprise, amusement,disagreement, or approval. The game aims to bring meaning torituals of walking, waiting, or boredom.Protecting privacy: GreenSweeper protects privacy of the playersthrough anonymity. Only a unique ID for every player isgenerated to distinguish on Flickr and for the processing, butplayer information is not collected. Although this does notestablish reputation of the other players, we are only concernedwith the information contained within the pictures anddescriptions.Ubiquity: Our motivation in making GreenSweeper a mobilegame is to incorporate environmental awareness into the everydaypractices of the user, without requiring additional infrastructure.In addition, it permits unrestricted movement of the user, hencecovering a greater range of artefacts. Furthermore, it encouragespedestrian activity in tagging and covering squares of the grid.The above pictures and descriptions were gathered informallyfrom 5 users to rapidly evaluate our system. We are currentlyconducting large-scale user studies to evaluate and improve oursystem design. Of particular importance is the question of theimpact of the size of the play grid and the population density ofartefacts on the motivation of the player. Parking lots, parks, andother open areas tend to be visited rarely, so the statistics in thatarea affect the convergence of overall sustainability analysis. Thenature of tags and descriptions and its relation to the pictures willalso be evaluated. Above all, we seek to understand the value ofgames in promoting environmental awareness.5. ACKNOWLEDGEMENTSMany thanks to Prof. Bill Tomlinson for advising us and teachingthe Sustainability course, both of which were invaluable in thedesign of the project.5. REFERENCESBogost, I., Persuasive Games: The Expressive Power ofVideogames, MIT Press, 2006Cheng, Y., Chawathe, Y., LaMarca, A., and Krumm, J., Accuracycharacterization for metropolitan-scale Wi-Fi localization, in:Proceedings MobiSys (2005) pp. 233–245.Krumm, J., Horvitz, E.: Locadio: Inferring motion and locationfrom wi-fi signal strengths. In: Proceedings of the FirstAnnual International Conference on Mobile and UbiquitousSystems: Networking and Services, Boston, MA (2004)Paulos, E., Ubiquitous Sustainability: Technologies for GreenValues, Ubicomp 2007Tomlinson, WM "Prototyping a Community-Generated, MobileDevice-Enabled Database of Environmental Impact Reviewsof Consumer Products," hicss, p. 154, HICSS 2008, 2007185
Star, L. S., The Ethnography of Infrastructure, The AmericanBehavioral Scientist, Vol. 43, No. 3. (1999), pp. 377-391.Steed, A. and Milton, R. "Using tracked mobile sensors to makemaps of environmental effects." Personal and UbiquitousComputing (2006). ISSN 161749096. BIOGRAPHYHui-Chun Phoebe Lin is a Master's Student in Informatics at theUniversity of California, Irvine. She received a Bachelor's degreein computer science from National Chiao Tung University inTaiwan (2006). Her research interests include ubiquitouscomputing, mobile computing, and HCI.Kah Liu is a Master's Student in Informatics at the University ofCalifornia, Irvine and Lead System Developer at Halcyon Designin Fullerton, California. He received a B.S. in Information andComputer Science from University of California, Irvine in 2006.His research interests lies within the areas of UbiquitousComputing and HCI.Nithya Sambasivan is a PhD. Student in Informatics at theUniversity of California, Irvine. She has a Master's degree inHuman-computer Interaction from Georgia Institute ofTechnology (2005). Her research interests are in Human-centredComputing, specifically mobilities, ICT4D, urban computing, andmore recently, activism.186
Sensonomy: Envisioning folksonomic urban sensingTakashi Miyaki ††Interfaculty Initiative in InformationStudies, The University of Tokyo7-3-1 Hongo, Bunkyo-ku,Tokyo 113-0033 Japanmiyaki@acm.orgJun Rekimoto †‡‡Interaction Laboratory, Sony ComputerScience Laboratories, Inc.3-14-13 Higashigotanda, Shinagawa-ku,Tokyo 141-0022 Japanrekimoto@acm.orgABSTRACTSensing urban environment with covering extensive area ina precise quality is important issue for sensor network approaches.This paper describes a system called “ParasiticAmbient Logger” which is attachable to mobile devices inorder to sense ambient air environment. Unlike the conventionalsensor network approaches, the system can buildenvironmental sensing infrastructure in a cost effective waybecause it has less limitations of installation cost. Mobilesensor nodes should be able to know its location informationfor practical applications. Our method employs Wi-Fi basedpositioning technology which can get one’s location even indaily urban environment. This grassroots style sensing environmenthelps to gain awareness of our surroundings. Byaggregating the data, large dataset of ambient logging can beused to analyze long-term and city-wide urban environment.Author Keywordsurban sensing, sensor network, folksonomy, mobile deviceINTRODUCTIONEnvironmental sensing using ubiquitous sensor networks isgoing to be remarkable research fields in these days[1]. Acommon research topics in ubiquitous sensor networks hasbeen the development of sensing infrastructure using lowpower static sensor nodes that are connected through wirelessnetworks with flexible topologies. Although these approacheswork well in a controlled environment, there aredifficulties to install sensing infrastructure in a real-worldto investigate city-wide activities[5]. For example, havingto deploy large numbers of sensor nodes everywhere in ourdaily life is a most significant problem. Even if the enormousnumbers of nodes could be prepared, getting property rightsto install every nodes is almost impossible. Moreover, thereare a lot of problems to overcome caused by its battery life,storage size, network access and initial location registration.Thus conventional style of sensor networks can not scale tothe city.One of the practical solutions for this problem, covering everywherethat we live with sensing infrastructure, is using aPermission to make digital or hard copies of all or part of this work for personal orclassroom use is granted without fee provided that copies are not made or distributedfor profit or commercial advantage and that copies bear this notice and the full citationon the first page. To copy otherwise, or republish, to post on servers or to redistributeto lists, requires prior specificpermission and/or a fee.<strong>UbiComp</strong> 2008, Sep 21-24, Seoul, South Korea.<strong>Workshops</strong> Proceedings. Copyright held by the authors.Figure 1. Appearance of “Parasitic Ambient Logger” System. (sensormodules attached to an iPod touch and a laptop computer)mobile platform[2][4]. If the sensors are embedded to thedevice that everyone already has (e.g. mobile phones, musicplayers, portable digital assistants (PDA) and laptop computers),some kinds of limitation will dissolve. Sensors canget longer battery life and larger storage size derived fromthat of the mobile devices.We propose “Sensonomy” which is real world folksonomybased on various sensing technology and peer production.As folksonomy develop in Internet-mediated social indexing,“Sensonomy” is a bottom up style of mobile sensor networkingby citizens in a real world. There are possibilities torealize various kinds of application under this concept (e.g.weather forecasting, pollution investigation, environmentalsensing, etc.)Most significant transition from static to mobile sensor nodesis location registration problem. Although the problem iseven simpler for static sensors, mobile sensor nodes shouldknow its location somehow by itself. In order to get locationinformation of sensor node, one of the most applied technologyis global positioning system (GPS). Although GPSdevice is widely used in static sensor network system in outdoorenvironment, it is not usable to detect one’s locationcontinuously in our daily life because performance of GPSdeclines significantly in indoor environment. Even in out-187
door environment, the accuracy of GPS often getting worthin urban area due to buildings reflection. This problem alsomakes effective urban sensing systems difficult.In our ambient logging system, we employ Wi-Fi based positioningtechnology[6][7] to enable each mobile sensor nodesto detect the location by oneself. By making use of denselyinstalled Wi-Fi access points at urban areas, every Wi-Fiinstalled mobile devices get ability to detect its location indaily situation.In this paper, we introduce our first proof-of-concept prototype,“Parasitic Ambient Logger”, that is composed of commonmobile devices that are easily available today and attachabletiny sensor device. Figure 1 shows working appearanceof the system in two style, sensor module attached tomusic player (Apple iPod touch) and laptop computer. Usingthese kind of easily available devices and parasiticallyattaching sensors to get the help of computational and networkresource, grassroots style sensor networks using mobilesensor nodes can be built in a realistic cost.Following sections consist from the concept of proposed approach,system architectures, our proof-of-concept implementationof “Parasitic Ambient Logger” and its applicationexamples. Our proof-of-concept implementation demonstratedthat the system actually works effectively in a city environment.PROPOSED APPROACHIn this section, we describe a concept of “Parasitic AmbientLogging” that can be alternate style of practical sensornetworking model.Mobile urban sensingEnvironmental sensing in urban area is getting more importantbecause of growing concern about investigating drasticchange of climate or surveying air pollution over large scale.Apart from conventional static sensor network infrastructureunder controlled situation, sensing nodes in the form of mobilephone like devices are strongly needed to achieve thisobject[5][3]. Because deploying large numbers of sensornodes everywhere in our daily life is impossible.One of the practical solutions for this problem, covering everywherethat we live with sensing infrastructure, is usinga mobile platform as seen in [2][4]. If the sensors are embeddedto the device that everyone already has (e.g. mobilephones, music players, portable digital assistants (PDA) andlaptop computers), mobile urban sensing can be realizedMost significant change between previous work and mobileurban sensing is how to tell the location information of sensornodes itself. In case of that the node does not move, itis enough to tell location of the installed device manually atinitial setting up process. On the other hand, it is essentialfor mobile sensor nodes to detect its current location somehow.Figure 2. Top view of the sensor module (with USB connector).Parasitic loggerThere are some other kinds of problems to overcome that isspecific to mobile urban sensing. Because of portability ofsensor nodes, it is not easy for the primitive sensor nodesthat have only lower functionalities to work properly in mobilecontext. For example requirement of battery life, storagesize, network access are also becomes problems in this mobileurban sensing. Some kinds of computational abilities ornetwork accessibilities is strongly needed.It is ideal that embedding necessary sensors into mobile cellphones that already have longer battery life and storage sizethat can go through all day long and network accessibilitiesto share the sensor data, but it is hard to implement environmentalsensors into today’s cell phones because of its limitedprogrammabilities.Our approach employs keeping sensor module simple andresigning these capabilities to common Wi-Fi installed mobiledevices which is available today (e.g. music players,PDAs and laptop computers). Parasitically attaching as simpleas possible sensor module to, it can make the most ofabilities from these mobile devices.Ambient logging and location informationUrban sensing is a technology that records various low-levelenvironmental information continuously and massively fromour daily living space. It is important to sense location informationwhere the data is captured and store time seriesof contextual information from environment. Such archivedinformation can be used for analyzing working environmentof a particular person, enhance the communication modalityusing contextual information around the users and surveyingenvironmental information from geographical mappingsof the data for city-wide scale. To provide such a statisticalinformation in geographical views, most important informationis “location” of where the data is captured.Usually, GPS is used for location sensing as well known.However, GPS is not enough for location sensing, because188
FunctionComponentsMicrocontroller PSoC CY8C24794-24LFXI(Cypress)Carbon dioxide TGS4161 (Figaro)BarometerFPM-15PASR (Fujikura)Temperature/Humidity SHT15 (Sensirion)Table 1. Component list of sensor moduleFigure 3. Wi-Fi access point locations estimation (Tokyo metropolitanarea).People’s living space is mostly indoors and GPS does notwork properly in indoor environments, and also GPS doesnot estimates building floor or room level location, which isimportant for mobile sensor nodes. Wi-Fi based positioninghas a characteristic that it can estimate indoor location orbuilding floor location. Thus we employ this technology.SYSTEMSIn our “Parasitic Ambient Logger” system, each of sensornodes is a set of common mobile devices with attached sensormodule that is easily portable in one’s daily life.Our sensor module is composed of multiple single functionalsensors and microcontroller (shown in Figure 2). Carbondioxide, Barometer, Temperature and Humidity sensors areincluded in this module in order to measure ambient air conditionand low level context information of the environment.This sensor module has low-level sensors (carbon dioxide,barometer, temperature and humidity) and a microcontrollerto sense ambient air condition. Derived sensor data frommodule is transferred to mobile devices via USB or serialport.Wi-Fi based positioningFor Wi-Fi based positioning technology, we use “PlaceEngine”which is previously proposed by Rekimoto et al[7]. PlaceEnginemaintains a Wi-Fi access point location database based onthe estimation algorithm. The current database contains morethan half million access point information that covers majorcities in Japan (Figure 3). It also supports floor and room estimationbased on Wi-Fi Signal fingerprint similarity. Usingthis technology, it becomes possible to record precise locationlog both indoors and outdoors.Hardware detailsWe developed first implementation of our “Parasitic AmbientLogger” using some kind of low-level ambient air sensorsand a microcontroller. To explore the idea of sensormodules this implementation keeps flexibilities in communicationmethod between the mobile devices. An detail listFigure 4. Visualization example of ambient logging. Sensor output data(CO2, barometer, temperature and humidity) is overlaid to its location.of components is shown in table1. We use Cypress PSoCmicrocontroller to make use of its analog amplification andconversion capabilities for capturing the data from sensors.APPLICATIONGiven the continuous ambient logs with location informationare available, a lot of applications can go through. Figure 4shows the plot of the sensor output to a map. This kind ofgeographical representation is easily applied not only timebasedplotting of the sensor output data.DISCUSSIONFor applications described above, most important thing isdata and how to aggregate it, not a particular device. Henceheterogeneous sensor devices and its connection styles arepossible. Figure 5 shows the possible variations of “ParasiticAmbient Logger” system configurations. There aremany kinds of mobile devices in the world, so that one andonly configuration of sensor module is not enough to achievereal-world sensor networks. For example, (a) shows simpleand ideal one. At this moment, it is difficult to embed environmentalsensors to mobile phones, because of size andenergy consumption problems. (b) is more realistic one atnow. sensor modules are connected to mobile phones viabluetooth. (c) and (d) are example configurations demonstratedin this paper. Thus various kinds of configurationsare possible.189
Figure 5. Variations of “Parasitic Ambient Logger” system configurations: (a) Mobile phone with embedded sensors, (b) Mobile phone and Wi-Fiready sensor module (connected via Bluetooth), (c) Laptop computer and sensor module (connected via USB), (d) Music player and sensor module(connected via serial)CONCLUSIONIn this paper, we introduced the main concept of “ParasiticAmbient Logger” that employs mobile sensor nodes to senselarge-scale urban environment, its practical implementationand its application examples in urban area. This can be alternativeapproach against conventional sensor network infrastructurewith static sensor nodes. Major characteristicsof this technologies is using single function sensor modulesattached to commonly available mobile Wi-Fi devices.Simple time based matching of sensor data and location informationfrom Wi-Fi positioning techniques make mobileambient logger possible. Compared with GPS, Wi-Fi basedpositioning can detect one’s location with high accuracy inmost urban daily situations. Thus a mobile sensor node approachin urban environment fits to an application area ofWi-Fi positioning system. Our proof-of-concept prototypesare demonstrated that the mobile sensing platforms workseffectively in urban environment.BIOGRAPHYTakashi Miyaki is an assistant professor in the InterfacultyInitiative in Information Studies at The University of Tokyo.His research interests include human computer interaction,real-world sensing, life-log computing.Jun Rekimoto is a professor in the Interfaculty Initiative inInformation Studies at The University of Tokyo.His research interests include human computer interaction,computer augmented environments, mobile/wearablecomputing, and ubiquitous computing. He has authoreddozens of refereed publications in the area of human-computerinteractions, including ACM, CHI, and UIST. In 2007, Hewas elected to ACM SIGCHI Academy.He suggests “Sensonomy” which is real world folksonomyusing various kind of sensors.2. Burke, J., Estrin, D., Hansen, M., Parker, A.,Ramanathan, N., Reddy, S., and Srivanstava, N.B.Participatory sensing. In Proceedings of the WorldSensor Web Workshop, ACM SENSYS3. Abdelzaher, T., Anokwa, Y.,Boda, P., Burke, J., Estrin,D., Guibas, L., Kansal, A., Madden, S., and Reich, J.Mobiscopes for human spaces. IEEE PervasiveComputingMobile and Ubiquitous Systems, 2007.4. Campbell, A.T., Eisenman, S.B., Lane, N.D., Miluzzo,E., and Peterson, R. People-Centric Urban Sensing. InProceedings of the 2nd ACM/IEEE AnnualInternational Wireless Internet Conference, 2006.5. Cuff, D., Hansen, M., and Kang, J. Urban Sensing: Outof the Woods, Communications of the ACM, Vol. 51,No. 3, 20086. LaMarca, A., Chawathe, Y., Consolvo, S., Hightower,J., Smith, I., Scott, J., Sohn, T., Howard, J., Hughes, J.,Potter, F., Tabert, J., Powledge, P., Borriello, G., andSchilit, B. Place Lab: Device positioning using radiobeacons in the wild. In Proceedings of Pervasive 2005,2005.7. Rekimoto, J., Miyaki, T., and Ishizawa, T. LifeTag:WiFi-based Continuous Location Logging for LifePattern Analysis, 3rd International Symposium onLocation- and Context-Awareness (LOCA2007),pp.35-49, 2007.REFERENCES1. Center for Environmental Sensing and Modeling,http://censam.mit.edu/190
Fresh: Cell-ID based Mobile Forum for CommunityEnvironmental AwarenessABSTRACTEiman KanjoUniversity of CambridgeComputer LabratoryCambridge CB3 0FDek315@cam.ac.uk00441223 765292This paper describes our mobile framework Fresh whichengages the public in location sensitive experiences and inmunicipal monitoring of their environment, available bothon users’ mobile phones, and online.This mobile forum is based on Cell-ID positioning andGPRS communications. It stores and receives informationfrom a remote server which analyses and processes thescientific data received from a scalable mobile sensingframework called MobSens and makes it available to localcommunities through Fresh.Author KeywordsMobile sensing, environmental monitoring, pervasivecomputing, location based applications, Urban computing,Social Network.INTRODUCTIONMobile phones provide us with sounds and imagery fromour homes and neighbourhoods, and the wireless capabilityof these phones will allow us to search, publish or shareenvironmental data easily and immediately. People willhave access to a great diversity of sensors, allowing them tomake even more detailed observations of theirenvironments [2][3][4]. They will be able to cross-referencepublicly available spatially and temporally data - traffic,weather, air quality, -within their vicinity and feel rhythmsof their community.In this paper we describe our work in developing a mobilebased social network called Fresh which utilise mobile andsensor networks power for the benefit of the environment.FreshFresh is a Mobile interface that utilizes GPRS networkingand positioning using the cell-IDs from peoples’ phones toPermission to make digital or hard copies of all or partof this work for personal or classroom use is grantedwithout fee provided that copies are not made ordistributed for profit or commercial advantage and thatcopies bear this notice and the full citation on the firstpage. To copy otherwise, or republish, to post on serversor to redistribute to lists, requires prior specificpermission and/or a fee.<strong>UbiComp</strong> 2008, Sep 21-24, Seoul, South Korea.<strong>Workshops</strong> Proceedings. Copyright held by the authors.Peter LandshoffUniversity of CambridgeCMS, Wilberforce RoadCambridge CB3 0WApvl@damtp.cam.ac.ukallow people to discuss issues related to their localenvironment. This mobile utility (forum) will encourageusers to interact at different locations and times to build apicture of their area and to reduce the carbon footprint intheir environment by getting some advises from moreexperienced users.This mobile forum can quickly help users to discoverwhether anyone within the surrounding area is interested inenvironmental issues. In addition, users will be able toaccess environmental data such as pollution, noise, weatherUsing prompts to trigger information from users, theinterface is a mobile phone tool to engage and encourageparticipation over time from multiple locations (Figure 1).and traffic information which are generated by a real-timeand scalable mobile sensing system [2].MobSens system is being developed by MESSAGE project[1] which enables individuals to monitor their localenvironment and their private spaces (e.g. activities andhealth) by using mobile phones in their day to day life. TheMobSens is a combination of software components thatfacilitates the phone’s internal sensing devices (e.g.Microphone and camera) and external wireless sensors (e.g.data loggers and GPS receivers) for data collection. It alsoadds a new dimension of spatial localization to the datacollection process and provides the user with both textualand spatial cartographic displays. While collecting the data,individuals can interactively add annotations and photoswhich are automatically transferred to a remote server (overGPRS connection). This makes it easy to visualize the data,photos and annotations on a spatial and temporalvisualization tool and web interface.Fresh User InterfaceIn Fresh, initially the world is empty but as the interactionis started the phone cell-ids fill with questions and answerswhich are asked by users who are trying to make their wayacross the city. Users can search their current location forany information about their local environment such aspollution level and weather information. Also they can lookat a tagged questions and answers related to this location.They can choose to answer the question with a short textresponse. If they don’t find what they are looking for theycould start a new discussion by dropping a question forothers to answer.Finally, the on-line website allows users to look upinformation about any specific area they have been to. They191
can view where it has been, who answered their questions,the answers and any related discussion.Whenever a user starts the application they are promptedwith a number of options:• to ask a variety of environmentally basedquestions regarding:o Traffico Pollutiono Weather informationo Health problems• to answer a variety of environmentally basedquestions which has been asked in this particulararea (Cell-ID);• to give advice regarding how to alter theirbehaviour and reduce their environmentalfootprint,;• to view in their current physical area the latest (orlatest maximum) measured pollution level taggedwith location;• to give a personalised user name (nick name)which they could use later to look up their input onthe online interface.All their inputs are automatically associated with theircurrent cell-IDs. Here are an example of some typicalquestions and answers of Fresh system:Q. Is there heavy traffic round here.A. Yes, many use this road to get to M11Q. Is Girton very noisy?A. Yes, it is surrounded by A14Q. Is bee population declining in this area?A. May be, farmers use insecticides excessivelyA. Yes, genetically modified crops can harm beesImplementing FreshFresh employs standard client-server architecture (Figure 2).The software application runs on a mobile phone, which iscurrently any of the Nokia Series 60 phones 3 rd generation,it is written in Native Symbian C++ which is capable of thefollowing:FreshDBMobile Application• logging the phone’s current Cell-ID;• Providing user interface;• Connecting to the server in real-time.Scoot(Traffic data)MobileSensDBLook-Up tableof cell towerinformationWeatherinformationApache Server/PHP ScriptsGPRS (POST/GET)Figure 2 Fresh System Architecture.The server component of the system runs on a standardApache server with PHP and PostGreSql database. PHP isused to script the logic on the server with PostGreSql beingused for persistent storage. Also the PostGIS plugin-tool ofPostGreSql is used for spatial queries.As most mobile phone networks do not provide mobilephones with routable IP addresses, all communicationsrequests must be initiated from the client side. These callsare sent from the client to the server over HTTP usingPOST and GET requests, with the parameters being passedwithin the data of the POST request. The reply is then usedto update the state of the client application. POST is used tosend information to the server such as users new questionsand GET is used to obtain information from the server suchas local traffic information.Information including user IDs, questions, answers, currentlocation (cell-ID) and look-up table of cell-IDs dataincluding Latitude and Longitude of each cell-tower(provided by O2) stored in the database along with thehistory of all previous answers and locations (Figure 3,3,4).Figure 1 Screenshots of the phone software.192
particular question or answer, and can continue to follow itsprogress as the interaction continues.By participating in this forum, we hope local communitieswill change their environmental behaviour towardsustainability, using the information that the systemprovides, and have an engaging, and enjoyable experience.Figure 3 Overlay of O2 cell-IDs (in Cambridge) onGooglemapsFigure 4 Pollution map (Cambridge) based on Cell-IDsFigure 5 O2 Cell-IDs around Cambridge are labelled withfriendly names.The database is also linked to real-time pollution, noise,traffic, weather and environmental information stored inMobSens database which is part of MESSAGE project [1].Future work and conclusionFuture developments will focus on the following:• evaluate where, when, and why people participate;• examine user behaviour and attitudes toward suchsystems;• build context-based and interactive visualisation todraw a picture of this social network;• allow users to interact with the system using mediacontents such as sound, image and video;• extend Fresh to reward the users for their activitiessuch as answering large number of question;• investigate how to develop and deploy large-scale,mass-participatory pervasive systems;We also hope to further improve the web interface to allowusers (or local authorities such as city council) to look upinformation about any questions and answered that theyhave encountered, whether created by themselves or byothers. They can view where it has been, who has created aACKNOWLEDGMENTSWe gratefully acknowledge the support of the EPRSC andDepartment of Transport for funding MESSAGE project.We are also grateful to O2 UK for providing unlimitedGPRS airtime and the locations of their Cell Towers.REFERENCES1. Cambridge Mobile Sensing, MESSAGE project.http://www.escience.cam.ac.uk/mobilesensing/.2. Kanjo, E., Benford, S. MobGeoSen: FacilitatingPersonal GeoSensor Data Collection and Visualizationusing Mobile Phones. Personal Ubiquitous ComputingJournal, Springer, (2007), ISSN 1617-4909 (Print)1617-4917.3. Kanjo, E., Landshoff, P., 'Urban Computing and MobileDevices,' IEEE Distributed Systems Online, vol. 8, no.7, (2007), art. no. 0707-o7002.4. Paulos, E., Honicky, R.J. and Hooker, B.Handbook of Research on Urban Informatics: ThePractice and Promise of the Real-Time City.Hershey, PA: Information Science Reference, IGIGlobal. Edited by Marcus Foth, IGI Global, 2008 (inpress).Author BiographyDr Eiman Kanjo is a Researcher at the ComputerLaboratory and Mathematical Sciences Centre at theUniversity of Cambridge. She is also a member ofCambridge eScience Centre (CeSC). Her main researchinterest is in mobile and pervasive sensing.Prior to joining Cambridge University, Eiman worked at theMRL (Mixed Reality Lab), Computer Science, Universityof Nottingham in the area of Pervasive Computing, locationbased games and mobile development.She has also worked as a researcher and developer at theICCAVE (the International Centre for Computer Gamesand Virtual Entertainment, Dundee) carrying out researchwork in the Interactive Toys and board Games projectwhich is sponsored by the Scottish Enterprise under theProof of Concept Programme.She earned her PhD from the Computer Sciencedepartment, University of Abertay Dundee, UK, in the areaof Pervasive and Tangible interfaces based on ComputerVision and Interactive TableTops in 2005. She is an ACMProfessional Member, a reviewer to a number ofconferences and journals and holds the patent “ObjectTracking System”.193
Nevermind UbiquityJeff BurkeCenter for Research in Engineering, Media and Performance (REMAP)University of California, Los Angeles102 East Melnitz Hall, Los Angeles, CA 90095-1622jburke@remap.ucla.eduABSTRACTSystems-level innovation in many fields is reactionary. Itresponds to the emergence of new components, materials, andprocesses with new ideas for their use. Despite the benefits of thislure of the new, it can risk undervaluing the role of alreadydeployed technologies in addressing unmet needs. This positionpaper draws analogies to the tension between new constructionand adaptive reuse of buildings to discuss alternative designstrategies in ubiquitous computing for citizen science, activism,and resource stewardship.Categories and Subject DescriptorsK.4.1 [Computers and Society]: Public Policy Issues – ethics,regulation, use/abuse of power.General TermsDesign, Economics, Experimentation, Human Factors, LegalAspects.KeywordsUbiquitous computing, pervasive computing, sustainability.1. INTRODUCTIONUbiquity is a quality, not a reason. “Everyone will have a car,”automobile boosters told Southern California. Fifty years later,most of our innovation and hope comes from goals of less, or atleast better, driving—not more.Many reasons for information technology to be embeddedeverywhere are intensely attractive: More communication at lesscost; more data available to more people; linkages of the physicaland digital yielding deeper understanding of the world; perhapseven increased participation and personal empowerment. Yet thecurrent model of everywhere computing, achieved throughbillions of mass produced, semi-disposable devices, which manyof us turn over yearly for incremental improvements, cannot beapplied to sustainability without some irony and, hopefully, somerevision.Permission to make digital or hard copies of all or part of this work forpersonal or classroom use is granted without fee provided that copies arenot made or distributed for profit or commercial advantage and thatcopies bear this notice and the full citation on the first page. To copyotherwise, or republish, to post on servers or to redistribute to lists,requires prior specific permission and/or a fee.<strong>UbiComp</strong> 2008, Sep 21-24, Seoul, South Korea.<strong>Workshops</strong> Proceedings. Copyright held by the authors.2. WHAT WE ALREADY HAVEMarket pressures and increased corporate accountability arepushing manufacturers to reduce the impact of what they build,and as users we are more and more aware of the importance ofrecycling, reusability, and—sometimes—parsimony. Inside thisworkshop, though, imagine something extreme. Consider what itwould be like to never get another mobile phone, a faster internetconnection, a better laptop. Take all of our current technologicalcapacity, and freeze it. We have a sort of ubiquity in ourworkshop room, even embarrassingly so. Now imagine growingold with those devices that we have, the way one might with agrandmother’s watch or a treasured, vintage car. 1 What would webe forced to do? Be lucky to have? Imagine the current, amazingscope of the internet and mobile communications, also frozen.Pacala and Socolow wrote “humanity already possesses thefundamental scientific, technical, and industrial know-how tosolve the carbon and climate problem for the next half-century.”[2] They list fifteen “stabilization wedges” that could be used tomeet the world’s energy needs while limiting the trajectory ofatmospheric CO 2 , essentially orienting fifteen fields aroundperformance goals needed by 2054. More than just know-how,do we already possess the technologies to address significantgoals of citizen science and activism around the challenges ofenvironmental stewardship? As designers, would facing alifetime with our current technologies force us to act moreeffectively towards these goals? What would we do if we weren’tfocusing on the next semi-disposable device or dawningcapability? These questions aren’t about design requirements forsustainable ubiquitous technology. 2 They are about howsustainability means understanding and working with what wehave, as much as dreaming of something more.In architecture, there is a similar drive to create new designswith fresh aesthetics and modern materials, and to build spacesthat address the unmet needs of groups of people. New buildingsare considered cheaper to build, easier to expand and maintain,1 In a recent talk, Saul Griffith mentioned another’s quip thatpeople should be assigned a Mont Blanc and a Rolex at birth,pass them on at death, and never buy another disposable watchor pen in their entire life. Current class implicationsnotwithstanding, it’s a provocative point.2 Though that would be an interesting workshop. For our “frozen”technology, let’s assume that the technology was built to belonger-lasting to begin with, perhaps consistent with the designprinciples of Danny Hillis’ Clock of the Long Now: longevity,maintainability, transparency, evolvability, scalability. [1]194
and more efficient. In fact, many older buildings have thepotential to be more energy efficient than all but the most modernconstruction. [3] Additionally, in old buildings, we can findcraftsmanship most could never afford today, and materials thatwould now be very expensive: stone, wood, and copper, forexample. In some cases, that combination of materials andcraftsmanship, along with the cultural context, create places thatwear well, are appealing, and are part of our identities. To knockdown an old building and create a new one with lower “total costof ownership,” higher “efficiency,” and more “features” seemseasier than fixing the old one. But these are buildings that wemay never be able to make again, and they may resonate as part ofpeople’s identities, something which is not duplicated or quicklyregenerated. In the long view, they may be sturdier and possibleto maintain quite well, given some human ingenuity and effort.Ubiquitous electronics are of a different scale, and rarely does anysingle device contribute to our sense of group identity or resonatewith us like a physical place. We can still take inspiration from(the admittedly more difficult) building practices that mixhistorical and modern structures, from adaptive reuse, from theacknowledgement of the extensive visible and invisible value inwhat we already possess.Given a charge for “adaptive reuse” of the technologies andknow-how that, hypothetically, our workshop now must live withforever, we would need to translate our aspirations for activism,citizen science, and sustainability into innovations that fit withinthe capabilities of the communications technologies we alreadyhave. And they are not lacking! Like working with classicbuildings, it may require thinking that’s not off-the-shelfconventional tech wisdom. In our workshop room, we at leasthave access to wireless devices, local and remote computation andstorage; displays and perhaps a projector; connectivity of variouskinds; local sensing of images, audio and location—and maybemore, depending on what people bring to demonstrate. We havestylus, keyboard and touch interfaces for data entry and probablymany other capabilities. We even have access to existing onlinesystems that facilitate self-report, mapping, data publishing andanalysis, and media sharing. Surprisingly, we may need to spendsome time on a real asset inventory of what we already have. Notonly will we need to assess what our now-lifelong technologicalcapacities are, but what assumptions about them we may havemade “before the freeze” that needn’t apply if we really have tomake what we have work. We will need to create the pieces thatfit between the old and the new, rather than waiting for everythingto be “new.” (Written down, the latter doesn’t seem verylogical—but I find myself doing it all the time.)But work to do what? Next comes the question of where toapply our tools first, on what topics and towards whatcombination of discovering new knowledge, promotingawareness, or directly affecting change. As I understand it,sustainability takes the long view. Activism focuses on the urgentand significant. These are qualities and reasons in a productivetension. We can re-evaluate our existing technological capacityby asking how it can be applied to the significant, the urgent,and—this is what the long view means—what is not for us. It is aview that asks can we meet our needs today in ways that giveothers in the future the capacity to meet theirs?Given an understanding of technology (and our designeffort) as limited resources like any other, and the horizon ofinnovation as just that, there seems little choice but to turn whatwe have towards where we might learn the most and have themost impact. Our current technologies might follow the beforeand-afterof major urban development or interventions; they couldprovide insight into the longitudinal effects of significantlegislation, new medications or sources of food. They couldprovide data on changes in the environment. They could reflectthe contributions of microscale cultural and social decisions intothe larger scale state of the world. They might contributefundamentally to neighborhoods and communities documentingand expressing their lives in a way that promotes a newstewardship of diversity and existing resources. What do we findsignificant? Should it change as our tools do?3. THE CONTEXT FOR DESIGNTo some extent, these applications and questions are beingexplored in the ubicomp and sensing systems communities usingboth current and near-future technologies. There is related workby UCLA, MIT, Dartmouth, Columbia, Carnegie Mellon, Intel,Nokia, and many others in the “urban sensing”, “people-centricsensing”, “participatory urbanism”, and similar areas. [6-12]These approaches could be applied within the proposedtechnological time capsule of our workshop. The significantchallenge facing us is how to move from early research to moresignificant and active contributions, both locally andinternationally.For this workshop, perhaps this thought experiment canhelp uncover assumptions underneath our current design practicesand the status quo of academic research. To continue the earlieranalogy, many supporters of the “green building movement”promote the idea that we can make our building approaches more“sustainable” or energy-efficient while benefiting the bottom-lineof the organizations and people that build them. While this is areasonable goal and often helps such projects find traction enoughto get built, it can encourage assumptions and qualifications toour analyses that do not take into account other social goals,cultural values, or attempt full consideration of the economics orconsumption practices involved.For example, Emily Wadhams of the National Trust forHistoric Preservation makes the argument that to recover theenergy put into the creation of an older building, after it isdemolished and replaced with a new energy efficient one, can takedecades. [3] Similar assumptions to this one—that new buildingswith expensive eco-materials necessarily reduce overall energyuse, that a zero-sum economic result is a minimum criteria forsuccess, or that the commercial market offers the only opportunityfor significant contributions of technology—represent only oneset of possible contexts for our decision-making or for answeringthe questions above. We should consider possible public policymechanisms to bring new capacity to communities or to supportsustainable approaches to meeting people’s needs. These mightinclude not just regulatory enforcement, as in California’s Title 24Building Energy Efficiency Standards, [4] but stimulation ofexpression and innovation in the communication channels createdby new technologies, such as the U.S. Public Broadcasting Act of1967 [5]. (Perhaps it is time to consider publically programmedservices in the rest of the wireless spectrum, and not justtelevision and radio.)As designers, we could start by creating better explanationsof what we think is possible now to others whose expertise couldhelp us relate to it to both local and global challenges. We mightembark on our own investigations with the tools that we have. Ifour technology was frozen, we would have unfamiliar advantage:195
innovating within existing capacity will not be passé orunderfunded. We needn’t worry about our technology beingsuperseded, or having to move to a new platform, or feeling thefamiliar stasis of waiting for the right technology to arrive. Theactive use of current internet and mobile technologies in ad-hoccrisis response and more generally in developing regions illustratethat this is possible and productive.4. CONCLUSIONThe concepts of sustainability and stewardship challenge us tovalue the existing as well as the new, and not to mistake theavailability of a means for the motivation to use it. Perhaps theposition is obvious. It also feels like unfamiliar territory for bothtechnology and pop culture. To leverage the scale of ubiquitouscomputing towards sustainability—to make ubiquity matter—wehave to be willing forget it as a motivation. Sustainabilitydemands by definition that we focus on what already exists out inthe world, and only then on what we will expend energy to buildanew. Hybrids of the two may be some of the most interesting,humane, and challenging solutions we will find. The larger thescale we look at, the bigger variety of devices we will see in use,the older many of them might be, and the more we will have towork with. In this workshop, like Pacala and Socolow, let’s lookat what we already have, and make a similar analysis ofubiquitous computing around what we feel is significant, urgent,and not-for-us.[8] Shilton, K., N. Ramanthan, V. Samanta, J. Burke, D. Estrin,M. Hansen, M. Srivastava. “Participatory Design of UrbanSensing Networks: Strengths and Challenges,” ParticipatoryDesign Conference, Bloomington, Indiana, Sept. 30 – Oct 4,2008.[9] Burke, J., D. Estrin, M. Hansen, A. Parker, N. Ramanathan,S. Reddy, M. B. Srivastava. “Participatory sensing,” WorldSensor Web Workshop, ACM Sensys 2006, Boulder,Colorado, October 31, 2006.[10] Paulos, E. and T. Jenkins, “Urban Probes: Encountering OurEmerging Urban Atmospheres,” Proc. SIGCHI Conf. HumanFactors in Computing Systems (CHI’ 05), ACM Press, 2005,pp. 341–350.[11] Hull, B. et al., “CarTel: A Distributed Mobile SensorComputing System,” Proc. 4th Int’l Conf. EmbeddedNetworked Sensor Systems (SENSYS 06), 2006, ACMPress, pp. 125–138.[12] Murty, R. et al., “CitySense: A Vision for an Urban-ScaleWireless Networking Testbed,” Proc. 2008 IEEE Int’l Conf.Technologies for Homeland Security, IEEE Press, 2008, pp.583–588.[13] Paulos, Eric, et al. “Ubiquitous Sustainability: CitizenScience & Activism,” Ubicomp 2008 Workshop Description,2008.5. ACKNOWLEDGMENTSThe architecture example is heavily influenced by conversationswith Kaitlin Drisko, Peyton Hall, Chris Gray and others of thehistoric preservation community in Los Angeles. Thanks also tothe anonymous reviewers for their insightful comments.6. REFERENCES[1] Hillis, Danny. “Clock design principles.”http://longnow.org/projects/clock/principles/[2] Pacala, S. and Socolow, R. “Stabilization wedges: Solvingthe climate problem for the next 50 years with currenttechnologies.” Science 305, 968 (2004).[3] Coletta, Carol. “SmartCityRadio: Interview with AlexKotlowitz and Emily Wadhams,” Internet radio interview,June 26, 2008.http://www.smartcityradio.com/smartcityradio/past_shows.cfm?showsmartcityID=403[4] California Energy Commission. “2005 Building EnergyEfficiency Standards”, Title 24, Part 6, California Code ofRegulations. http://www.energy.ca.gov/title24/[5] United States Public Broadcasting Act of 1967. Sec. 396 [47U.S.C. 396] Subpart D. http://www.cpb.org/aboutpb/act/[6] Campbell, Andrew T., Shane B. Eisenman, Nicholas D.Lane, Emiliano Miluzzo, Ronald A. Peterson, Hong Lu, XiaoZheng, Mirco Musolesi, Kristóf Fodor, and Gahng-SeopAhn, "The Rise of People-Centric Sensing", In IEEE InternetComputing: Mesh Networking, pp. 30-39, July/August,2008.[7] Abdelzaher, Tarek, et al., “Mobiscopes for Human Spaces,”IEEE Pervasive Computing, vol. 6, no. 2, 2007, pp. 20–29.196
Semantics-based urban sensing for SustainabilityMartin KohlerHafenCity University HamburgSchwarzenbergstr. 95D21073 Hamburg / Germany+49 40 428783589martin.kohler@hcu-hamburg.deJürgen PietschHafenCity UniversitySchwarzenbergstr. 95D21073 Hamburg / Germany+49 40 428783111juergen.pietsch@hcu-hamburg.deABSTRACTThe paper presents a brief discussion to sustainability in urbanareas, a critique of existing definitions of sustainability andcritizes the over-abundance of these definitions which renders theconcept itself almost unusable. For a participative and localrooted involvement of the citizens in questions and policies forsustainable development in urban areas “sustainability” needs tobe substantiated to the specific place, time and people in question.In the connection of individual perspectives and shared globalknowledge in real-world sitations the substantiation can happen asa discursive process and sets the topic in a certain place. Thisraises the question how to connect the particular knowledge of acitizen, a local or simply the user of a place with the knowledgeof others (researchers, politicians, activitsts, other citizens) in acommon field of action to help them to develop “their “ conceptof sustainability for this time, this place and their problems.To bring the people in power and increase their motivation toparticipate in environmental policies on a local level, greatpotential can be seen in serious gaming and alternate realitygames to involve people and translates the invisible social andglobal processes to individual experience and spatial knowledge.Categories and Subject DescriptorsJ.4 [Social and Behavioral Scienes]: SociologyGeneral TermsDesign, Experimentation, Human Factors, TheoryKeywordsUrban computing, Sustainable development, serious gaming, realworldexperimentsPermission to make digital or hard copies of all or part of thiswork for personal or classroom use is granted without feeprovided that copies are not made or distributed for profit orcommercial advantage and that copies bear this notice and thefull citation on the first page. To copy otherwise, or republish, topost on servers or to redistribute to lists, requires prior specificpermission and/or a fee.<strong>UbiComp</strong> 2008, Sep 21-24, Seoul, South Korea.<strong>Workshops</strong> Proceedings. Copyright held by the authors.1. IntroductionIn an ongoing research project the Authors explore the conditionsand potential of gaming like applications to support sustainabledevelopment in urban areas.This paper summarizes the reflections on sustainable developmentand appropriate models of space conceptions as theoreticalfundament for serious games situated in the everydayenvironment. With the conceptual framework of real-worldexperiments, small applications for mobile phones as everydaytechnology can ground abstract descriptions and qualities tospecific real-world situations2. Organizing SustainabilityIf “Sustainability” is supposed to be not just a mere vision orphenomena, but a concrete path of human development thequestion arises how to perceive, manage and plan suchtrajectories.Of course, sustainable development can’t be reduced to a puremanagement issue with clear defined goals, strategies andappropriate instruments to control the process efficiently. Morethan that, we must understand that a sustainable development in aholistic sense is a future-orientated set of learning, exploring anddesigning processes on a societal scale. The inherentcharacteristics are uncertainty, agnosticism and conflicts onvarious levels (Minsch 1998).To complicate the development of methods to organize andmonitor sustainability, the scope and range of a sustainabledevelopment itself transforms rapidly and continuously and ishighly context-related. The ubiquitous ambiguity of“Sustainability” is a vague term and unveils under the lens of thepractitioner and the practical researcher families of widelyvarying concepts systematized in a kind of generations.Metaphorically it’s the same like with culture: Everything isculture, but not everything is the appropriate culture for a certaintask or situation. Analogous, sustainable development has to beattributed to discussion and continued exploration for theappropriate, far more than to the deployment of a certain concept.3. The gallery of definitionsIn the history of sustainability concepts since the beginning in the18th century somewhere in the woods of East Germany, theBrundtland-commision mark the beginning of the modernunderstanding to “meet the needs of the present withoutcompromising the ability of future generations to meet their ownneeds." (Brundtland 1991).197
Since the Brundlandt report a series of different definitions hasevolved and rendered the term “sustainable” almost unusable. Thedebate for the “right” definition of sustainability goes on fordecades now and throws up new concepts and definitions in thesame pace. David Pearce has called this continous flow the“gallery of definitions” (Pearce 1898) at a UNCED conference in1989. In a survey to regional sustainability (DIEFENBACH2001), the economist Hans Diefenbacher pinned down theoutcome in a preliminary summary of the debate: None of the many variations was powerful enough tobecome widely accepted The genuine basic definition rooted in the forestagriculture has been adopted by the “mainstream” of theeconomical theories and transformed to complete newconcept not compatible with the original definition New trajectorial understandings focusing on theecological limits of economies incorporate meaningsfrom the original concept of forestry again (sustainableyield, sustainable growth) The conflicts are solved in dialectical abstract andvague definitionsIn a earlier study examining the sustainable economy on aregional level he states, that the achieved consensus on theunderstanding of sustainable development dissolves already whenquestioning the scope of the concept. Ecology, culture,economics, society, politics – a wide variety of understandings toinclude and exclude these fields appeared in his research.(Diefenbach 1997)In a very strict understanding just the ecological aspects arecovered and as such the term works as an analytical frame for aenvironmental management of resources as the economical baseof human activity.A group of wider definitions agree on the extension of the scopenot merely compromising just the ecological conditions but alsoother aspects of the former mentioned fields. More or less most ofthese definitions can be retraced to the basic model of a “triangleof sustainable development”. In this model the societal,economical and ecological dimension circumscribes thesustainability and possible conflicts between these dimensions areto be conciliated within the hierarchy of goals derived from thethree dimensions. As in the former strict definition theenvironment and the natural resources are the preliminarycondition for the human activity and the existence of latergenerations.Other authors extend the scope to a much wider definition byincorporating the cultural and political sphere – the developmentof democratic institutions, the activity of NGO’s, the emergenceof participative structures etc. Charles Strong formulated in 1976already a first concept for such a wide definition as“…a path of development designed to help people define theirreal goals for growth and to utilize their own available naturalresources and human skills to achieve these goals with patterns ofgrowth that are sustainable, that will not destroy either the naturalresource base upon which continued development depends or thetraditions and value systems of the people concerned.” (Glaeser1984)This approach puts it in the realm of ideas similar to the selfreliancytheory and some concepts developed for the ThirdWorld.This point is essentially helpful on the local level of sustainabilityprocesses as it can be seen in a – unfortunately not verysuccessful - crucial element of the Agenda21. 1In the conference in Rio it became clear to support the efforts fora more sustainable world on the global level with a local strategyto address individual action and behavior as the individual way oflife. The “local agenda 21” was this local strategy. Thought as aparticipative process it represents a way to involve the citizens inenvironmental issues. The local agenda 21 tries to raise awarenesson the potentials and problems of their community as “their”politics, to engage the citiziens in that and to encourage them toextend the scope of action and field of engagement.Despite all implementation problems these goals are still presentand it raises the question how to connect the particular knowledgeof a citizen, a local or simply the user of a place with theknowledge of others (researchers, politicians, activitsts, othercitizens) in a common field of action to help them to develop“their “ concept of sustainability for this time, this place and theirproblems.This is primarily a problem of learning processes in a real worldwhich poses two questions: what are the appropriate spaceconceptions and how can we annotate concrete situations withenvironmentally relevant knowledge.4. New spaces and space conceptionsSustainable development is a spatial term, focused on theactivities of different stakeholders and their impact on theenvironment. But the different stakeholder do not share the sameperception of space. Planning institutions are looking at plans.Plain, rational, abstract documents of a Cartesian space, definedby describable borders. Individuals perceive space as sequencesof subjective impressions. Thus, describing their space asnarratives and linked rows of situations (Certeau 2007) which israther a produced category than an a-priori existing entity.Linking and creating environmental relevant knowledge to spacehas to bridge the gap between these different perceptions and findappropriate models of space matching the user experience.The theoretical perception of „space” has changed from theancient conception as a stable, physical constellation of spatialelements to a dynamic, culturally and socially produced entityand the symbolic and medial level of the city gains significance,topological relations replaces topographical ones and the „city“as spatial continuum is increasingly perceived as dynamic,process orientated structure. “(Maresch 2002)Beside the cultural sciences social sciences and the literature andmedia science discovered the space as a methodologically1 As follow-up of the Brundtland Commission the GeneralAssembly of the U.N. at the Earth Summit, held in Rio deJaneiro in 1992, came up with the Agenda 21. The programmecompiled a comprehensive blueprint of action to be taken bygroups and institutions on a global, national and local level tosupport sustainable development (ref: Rio Declaration ofEnvironment and Development).198
necessary term (Löw 2001, Dünne 2006 , Sturm 2000, Thrift1996, etc.). and interesting models evolved.But also the genuinely space-based disciplines such as geography,architecture, landscape planning and city and spatial planningembraced their original reference system once again after a phaseof time and temporalization (Virilio 1980, Castells 1996, Läpple1992, etc) in the reverberation of the digital revolution. With theRenaissance of space new and existing theoretical approaches tothe phenomena space were rediscovered and evaluated in theirability to solve the problems on the new battlefields of a temporalAND spatial signed society.When embedding sustainable development processes in the citywith ubicomp technologies the consequences are manifold.The complex social, economic and ecological system called the„city“ forms areas, which consist of individual perspectives andsocial, technical, economic and ecological elements in differentvariations. Space theories developed by the social and culturalsciences try to illustrate this. Usually the acceptance of a sociallyconstituted area presupposes however a perceptive space owner.The originating point of our discussion, the ‚purely objectiveobservation of space', is insufficient on the level of the modernurban structure and requires a theoretical founding on the level ofthe individual (i.e. the space owner).Fundamental for the development of a appropriate concept ofsustainability for a specific site, a specific group of people as acommon field of action is a understanding of “space” as a sociallyproduced fluid structure. Such a concept of space, mostappropriate developed by Martina Löw, bases on a relationalconcept of space and place initially developed earlier (Certau2007, Foucault 1982, Lefebvre 1991).. Spacing uses not a metricclassical space but the images and pictures which occur byperceiving the metric space (Löw 2001). The constitution of spacehappens in two processes: spacing as placed social commoditiesand the synthesis by individual perceiving these commodities.Place and location itself develops through both processes –spacing and the synthesis / combination by each individual. Bythis concept a complete social space is constructed as a contextfor learning processes of a heterogenous group of stakeholders.And can be the fundament for applications of learning, seeing,discussing individual and mutual knowledge in the city.5. Individual knowledge for planners andcitizensFor the post-fossil urban development under the impression of theclimate change former planning, land-use and educationalconcepts of the industrial era are unsuitable. Concepts like „theintelligent house “, virtual power stations or the “Ubiquitous city“aim to new possibilities to interact with our environment, butthey remain to a large extent technology-based. i-environmentsopen up potentials for a trend-setting urban environmental andresource management. For citizens, but also for planning expertstools for the genesis of urgently necessary sustainable urban areasare missing.With techniques based on an appropriate space concept refering tothe construction of space through acting in the understanding ofsocial construction of space and the possibility for customizationof describing categories by individual semantic category building(ontologies) and - in semantically weaker form - asFolksonomien, information skeletons of urban situations arepossible and can be integrated in a broader view shared by agroup of people, the milieu, the city population etc. Thus newperceptions of urban areas are possible, which supplement on theone hand the traditional environmental information systems, onthe other hand raise new awareness for environmental issues bythe participative character of such a system. In particular thesupport of community-building and the experience in situ affectincreasingly the motivation to discuss and reflect this topic.6. Experiments and the real worldThe characteristic of urban areas as elements of highly complexsystems and the situatedness of all social processes – thecontextual location of social facts in space and time – outlines thepreconditions for application related research in this field.Accepting the fact that all social behaviour und thus theimplementation of sustainable development concepts issituational, the regular methodologies of natural scienes areunsatisfying. A methodological research design could be moreproductive, to avoid the scientific separation of world andlaboratory, theory and reality. Rooted in the ideas of the ChicageSchool the concept of “real-world experiments” of “PublicExperiments” seems suitable. The general ‘model’ is bothecological and evolutionist: urban social life could best beunderstood as embedded in geographic and materialenvironments. Fieldwork is preferred to laboratory, in fact theworld is the lab.The field carries with it an idea of unadulterated reality, just nowcome upon. Certain field-sites become unique windows on theuniverse, revealing only at this place something that cannot bemoved or replicated in the laboratory. In such instances, ‘beingthere’ becomes an essential part of claiming authority for anobservation or discovery. (Gieryn 2006)Realexperimente are experimentation processes, which take placenot in the special world of the scientific laboratories, but in thesociety itself. Experiments out of the scientific laboratory do notrepresent a deficitary form of the scientific experiments inlaboratories in principle. However some preconditions must befulfilled in a” Realexperimente Design “.Realexperimente aretwosided: as in traditional experiments purposeful interferencescreates measurable results and thus produce new knowledge, butnot just for research and the academical world. While laboratoryexperiments are those procedures, in which scientists can testtheir ideas freely, Realexperimente are embedded into social,ecological and technical organization processes, which are usuallycarried out by many participants. (Gross 2005).Substantial characteristics of the concept by Gross and Hoffmann-Riem is the simultaneousness of application of knowledge andgeneration of knowledge and something called openness tosurprise. In Realexperimenten the production of new knowledgeevolves if the experiment does not behave as foreseen. This„surprise “represents the actual knowledge progress. Thereforethe Design of the experiment must be open to surprise, able tointegrate the unforeseeable in a constructive way.7. Possible outcome / Two projectsThe aforementioned positions towards space, knowledgerepresentation and experimental approaches to address issues of asustainable urban development process on a local level, are part of199
our current research in mobile gaming as tool to enable citizens inunderstanding, creating and sharing knowledge. The paper is lessa normal research report, but more a position paper to show threeimportant focal points for applications to embed sustainabledevelopment processes in the urban with the help of ubicomptechnologies.To sum up these positions and illustrate the underlying thoughts,two small applications act in place of the typical conclusion.„Can you see energy?“Based on technologies like mobile phones and Multiplayer Gamessmall games were developed (Pervasive Gaming/Alternate RealityGames) as serious games, which present themselves as outridersfor new interactions in material environments, concepts andtechnologies. These games have been developed to support aspace and an environmental perception in the context of urbansensing. How can we see energy consumption and does it create adifferent view on the environment when compared with theenergy released by your walking? What visual phenomena andsituations do you mark as being “natural”? And what is thequality of this facet “natural”? The spatial-temporal fixation of allof these collections in space, time and ontological description asan annotated interactive map creates a new opinion to therespective environment as community gererated content. Theontologies for the description of such situations can be providedbeforehand by experts or developed or extended within theapplication by the user. The generated description language,categories of tag clouds can be shared with other users (thecommunity).“Urban space fixations and natural phenomena”Picturing natural phenomena in the urban structure, tagged withthe geographical position and the recording time with mobilephones as side-track to the everyday activities creates a collectionof stream of photographs picturing aspects of processes regardedas being natural.The collected results of the photographs of specific situationcannot only be regarded in maps, but also over time anddescribing terms to be sorted („which natural phenomena of thecategory X documented Y in the periphery of the place Z in theperiod N“). The information here are the the documentedsituations with the abilities of modern Smartphones (GPS forplace, clock for time, camera for visual documents, microphonefor audio documents and ontology based description lists).Additional information such as weather or traffic conditions canbe integrated as information available in the Internet into thesystem, in order to make further semantic lists of new mapsavailable. In the playful generation of these maps the city surfacesas a dynamic network of various natural facets.8. REFERENCES[1] Programme of Action for Sustainable Development, RioDeclaration on Environment and Development; Statement ofForest Principles; Agenda 21 (1992). New York, UnitedNations,.[2] BRUNDTLAND, G. (1991). Our common future (13. impr).Oxford paperbacks. Oxford: Univ. Press.[3] CASTELLS, M. (1996). The rise of the network society(Vol. 1). The information age, Vol. 1. Cambridge, Mass.:Blackwell.[4] CERTEAU, M. (2007). The practice of everyday life([Repr.]). Berkeley: Univ. of California Press.[5] Conference on Environment and Development (1993).Agenda 21: Programme of action for sustainabledevelopment ; Rio declaration on environment anddevelopment ; statement of forest principles ; the final text ofagreements negotiatet by governments at the United NationsConference on Environment and Development (UNCED), 3-14 June 1992, Rio de Janeiro, Brazil. New York: UNDepartment of Public Inf.[6] DIEFENBACH, H. (2001). Die Analyse regionalerNachhaltigkeit im Vergleich verschiedenerBewertungsmethoden. Heidelberg.[7] DIEFENBACH, H., KARCHER, H., STAHMER, C.,TEICHERT, V. (1997). Nachhaltige Wirtschaftsentwicklungim regionalen Bereich.[8] DÜNNE, J. (2006). Raumtheorie: Grundlagentexte ausPhilosophie und Kulturwissenschaften. Frankfurt am Main:Suhrkamp.[9] GLAESER, B. (1984). Ecodevelopment: Concepts, projects,strategies. New York: Pergamon Press.[10] GROß, M., HOFFMANN-RIEM, H., KROHN, W. (2005).Realexperimente: Ökologische Gestaltungsprozesse in derWissensgesellschaft. Bielefeld: transcript-Verl.[11] KEIM, K.-D. (2003). Das Fenster zum Raum: Traktat überdie Erforschung sozialräumlicher Transformation. Opladen:Leske + Budrich.[12] LÄPPLE, D. (1992). Essay über den Raum: Für eingesellschaftswissenschaftliches Raumkonzept. Hamburg:Technische Univ.[13] LEFEBVRE, H. (1991). The Production of Space (D.Nicholson-Smith, Trans.). Oxford: Blackwell.[14] LÖW, M. (2001). Raumsoziologie. Frankfurt am Main:Suhrkamp.[15] MARESCH, R., WERBER, N. (2002). Raum - Wissen -Macht. Frankfurt am Main: Suhrkamp.[16] MINSCH, J. (1998). Institutionelle Reformen für eine Politikder Nachhaltigkeit. KonzeptNachhaltigkeitStudienprogramm. Berlin: Springer.[17] PEARCE, D. W., MARKANDYA, A., & BARBIER, E. B.(1999). Blueprint for a green economy. London: EarthscanPubl.[18] STURM, G. (2000). Wege zum Raum: MethodologischeAnnäherungen an ein Basiskonzept raumbezogenerWissenschaften. Opladen: Leske + Budrich.[19] THRIFT, N. J. (1996). Spatial formations. London: Sage.[20] VIRILIO, P. (1980). Geschwindigkeit und Politik: Ein Essayzur Dromologie. Berlin: Merve-Ver200
Arianna BassoliISIG, London School ofEconomicsLondon, UK WC2 2AEa.bassoli@lse.ac.ukAutomated JourneysJohanna BrewerDonald Bren School of Informationand Computer Sciences,UC Irvine 92697-3440johannab@ics.uci.eduAlex TaylorMicrosoft Research7 J.J. Thomson AveCambridge, UK CB3 0FBast@microsoft.comABSTRACTComputing technology now pervades those moments of ourday when we move through our cities. Mobile phones, musicplayers, vending machines, contact-less payment systemsand RFID-enabled turnstiles are de rigueur on ourdaily journeys. This workshop aims to examine theseaugmented journeys, to reflect on the public, semi-publicand private technologies available to us in them, and tospeculate on what innovations might be to come. Taking asour starting point cities such as Seoul, we aim to take seriouslythe developments in mobile technology as well as theadvancements in autonomous machinery and how thesemesh with our urban journeys. The workshop’s empiricalfocus will be directed at producing 4 envisagements thateither speculate and/or critically reflect on technologicalfutures.ACM Classification KeywordsH5.m. Information interfaces and presentation (e.g., HCI):Miscellaneous.INTRODUCTIONWeiser’s vision of computation moving off the desktop andinto the everyday world is now a reality in many ways.However, while there has been much study on how this hasaffected the household, the workplace and, to some degree,what Oldenburg calls "third places" [4], we are only beginningto understand how it is changing the way we experiencethe cities we live in. The authors have previously explored,through a series of workshops, how this has affectedspecific urban contexts [1,3] and, through an ethnographicstudy, how we might begin to talk about the urban experiencein terms of the journeys we take [2]. With this workshop,then, we will bring these topics together and directlyaddress how the public, semi-public and private technologiesthat we encounter and bring with us into the city shapeour urban journeys. Here, the focus will be on the ways inwhich our interactions with the city become increasinglyautomated and how an awareness of the technological impactson our daily journeys might inspire future designs.THEMESDuring the workshop we will address five interrelatedthemes concerning technology’s role in transforming oururban journeys. By examining how these themes are borneout specifically in the city of Seoul, we will attempt to understandwhat broader implications they might have as well.Automation and public interactions. In our cities, automationis becoming more and more prevalent. Fast food isbecoming even faster – now one can buy a hamburger inSeoul at McDonalds without having to hand over any cashor even a credit card; contact-less mobile phone paymentsare now a reality. Additionally, humans are disappearingeven more from building security with robots in Koreanschools replacing more traditional guards. We can ask,then, with the increasing uptake of automated machines,have urban journeys in Seoul become more individualistic?Does automating technology decrease the level of socialinteraction or instead give rise to new forms?Efficiency vs aesthetics. All sorts of activities are beingtechnologized, often under the guise of efficiency. Stoppingoff at the toilet while on your way to work once was astraight-forward affair, but now toilet users in Seoul areconfronted by toilets with control panels offering heatedseats, jets of water, and the sounds of chirping birds. Evencleaning one’s mobile phone has become a public service;kiosks that allow you to subject your phone to a sanitizingblast while on the go are popping up all over Seoul. But areall of the technologies found in our cities making our journeysmore efficient, or is it just the opposite? Must onechoose between a pleasant experience or a fast one, or dourban technologies represent a new form of aesthetic?Automated identities. Seoul’s T-Money system allows forcontact-less payments in city shops as well as on the subway.With a range of options from RFID cards to mobilephone upgrades to tiny plush characters (that can have theircredit recharged using USB), there are myriad ways to takeadvantage of the system. However, such innovations alsoraise issues around how we are identified in and throughour movements. Do e-money technologies such as T-Money make us more or less anonymous now that we canbe uniquely identified by our RFID train passes, our mobilephones, our credit cards, and so on? And, more fundamentally,does the presence of this automation in our everydayurban lives offer new ways to present our selves? Are webecoming, in the words of Vertesi, technomorphized [5]?Layers of mediation and interaction. We can no longer201
conceive only of human-computer interactions as definedby a single person using a technology. A person can interactwith a public technology (e.g. a ticket machine) through amore personal one (e.g. a mobile phone). Likewise severalpeople can use the same public technology simultaneously,or a person can interact with others through the technologiesaround them. Even technologies themselves are beginningto interact on their own. In Seoul it is now possible tohave robots park your car or to ride in trains that have nohuman conductor. How then, we might ask, are these variousand complex layers of mediation and interaction manifestas we move through our cities? Moreover, with theselayerings, what are the ways in we might come to changeour relations with technology and ultimately each other?The hybrid of technology and tradition. With talk oftechnology transforming our lives it is easy to overlook thecultural traditions in daily life. But in a city like Seoul technologyand tradition exist side by side. In the streets oldstylefood vendors proliferate, and puffed rice isn’t somethingyou make at home with a high-tech cooking device,rather it is something you go out on to the street to purchasefrom an “old fashioned” no-jeom sang (street seller). At thesame time, however, sticker sa-jin (photo sticker) machinesare ubiquitous in those same public spaces, allowing peopleto go out and purchase something made on the fly in a considerablymore hi-tech fashion. This begs the question,then, how are, or how could, the technologies we encounterin our everyday journeys intertwine with older low-techtraditions. Is one replacing the other? Is technology introducingnew traditions or ones simply re-shaping old ones?ORGNIZATIONThe authors all possess ample experience in workshop organization.Drawing on previous successes, we plan topromote this workshop through the www.inbetweeness.orgwebsite, as well as through related mailing lists. The callwill be targeted towards a range of participants from fieldsincluding computer science, interaction design, architecture,social science and the arts. Position papers of 2-4 pages willbe invited about the design, implementation or study oftechnologies for automated journeys, and from these submissionswe will select approximately 16. Accepted submissionswill be published on the website prior to the workshopand a mailing list will be created to foster a dialogueof ideas amongst the participants. The workshop itself willtake place over the course of a single day and includeguided fieldwork, group discussion and design brainstorming.After brief introductions, the participants will be dividedinto 4 groups. Each group will join a local guide whowill take them on a typical daily journey through Seoul.The guides will draw group members’ attention to theautomated systems and help them, where possible, to usethe systems first-hand. After their morning excursions, thegroups will return to the conference center and create shortpresentations about the automating technologies and typesof interactions which they observed. They will then beasked to create a design envisagement that speculatesand/or critically reflects on the future of urban technology.These designs will be presented and discussed, withdiscussions encouraged around the relevance of their ideasto <strong>UbiComp</strong> as a whole. All of the fieldwork material, designenvisagements, and discussion themes will be collectedand published on the inbetweeness website in an archivalformat for the entire community to access. Furthermore, aswe have conducted several workshops exploring technologyin urban settings, we will gauge the interest in a journalspecial issue at the conclusion of the workshop.ABOUT THE ORGANIZERSArianna Bassoli is a PhD student in the Information Systemsand Innovation Group at the London School of Economics.Her interests lie in interaction design research, urbancomputing and how it can be informed by a situatedunderstanding of people’s everyday life. She has experiencein the design of proximity-based and mobile applicationsthat allow people to exchange digital resources in variouseveryday occasions.Johanna Brewer is a PhD student in the Informatics departmentat the University of California, Irvine workingwith Paul Dourish. Her thesis is focused on urban computing,particularly in the design of social technologies. Herresearch centers around how an examination of mobility inurban spaces, specifically the London Underground and theOrange County bus, might help to inform these designs.Alex Taylor is a member of the Socio-Digital SystemsGroup at Microsoft Research, Cambridge. He has undertakeninvestigations into a range of routine aspects of everydaylife. For instance, he's had an unhealthy preoccupationwith hoarding, dirt, clutter and similar seemingly banalsubject matter. Most recently he has begun obsessing overrobots and other curious ‘thinking’ machines.ACKNOWLEDGMENTSThis work was supported in part by the NSF under award0133749 and the EU-funded project BIONETS.REFERENCES1. Bassoli, A., Brewer, J. and Martin, K. 2007. In-betweenTheory and Practice: Dialogues in Design Research.Experience Report at Conf. CHI '07 (San Jose, CA).2. Brewer, J., Mainwaring, S. and Dourish, P. 2008. AestheticJourneys. In Proc. of DIS '08 (Cape Town, SA).3. March, W., Nafus, D., Swan, L. and Taylor, A. Nightand darkness: Interaction after dark. Workshop at Conf.CHI '08 (Florence, Italy).4. Oldenburg, R. 1989. The Great Good Place: Cafes, CoffeeShops, Bookstores, Bars, Hair Salons, and OtherHangouts at the Heart of a Community. New York:Paragon House.5. Vertesi, J. Seeing Like a Rover: Embodied Experienceon the Mars Exploration Rover Mission. In Proc. ofConf. CHI '08 (Florence, Italy).202
Make Me Happy: In Situ Data Collection for Urban SyncStephan BaumannGerman Research Center for Artificial Intelligence67657Kaiserslautern, Germanystephan.baumann@dfki.deABSTRACTThis paper gives a short overview of Urban Sync. Theunderlying research theme of this project is about the matterof personal interaction and relationship building in urbanenvironments. It starts with a storytelling approach tomotivate the research questions and challenges.Furthermore it describes a technical setup to perform in situethnographic research by the author to collect multimodaldata about the context of the urban environment and thephysiological responses of the subject when performingeveryday life activities.Author KeywordsAffective computing, cultural hacking, urban journeys,urban planning, physiological data, emotionsACM Classification KeywordsH5.m. Information interfaces and presentation (e.g., HCI):Miscellaneous.EXCERPT OF MY DAILY DIARY„... damn, missed to recharge the iPod! What about thescooter? hopefully working, I am in a rush to our weeklymeeting to discuss the work of the research group, althoughmy head is filled with ideas for some urban art projects,anyway I need to be happy first! So, what’ s missing? Latte+ Twitter! My scooter is nice and brings me in 10 minutesfrom the suburbs to downtown where I head to the one andonly coffee shop being located in a traditional cosy buildingwith nice chicks around and a perfect italian coffee machinefrom the late 60ties. WiFi is free, WiFi is fast. Yes thismakes me happy! Checking replies and direct messages atTwitter and wondering why people post so much crap ... onother days when I am alone in a new place, a differenturban setting, knowing nobody, like 2 weeks before inParis, I ended up at McDonalds for free WiFi and I was sodamn happy about these silly postings of my „socioborgs“,thats how I call myself and all these nerdy people twitteringas hell. Although the music in the coffeeshop is not suchbad it could be better by exploring the playlists of all theother people sitting around and doodling their MP3s onshiny iPods or being in isolation behind their earplugs, atleast half of them look interesting enough to get rid of mydigital chitchat and get into some real conversation, thatwould make me feel really happy! I wonder if there will beonce in a time a happy machine, a personal companion whoknows about emotions, who has been part of my lifetracking all my interactions with people and things andplaces, logging my implicit and explicit reactions andhaving enough computing power, AI algorithms,connectedness to other machines, people, cities to resolvefrom all these constraints to 1 solely thing for me, hismaster: More Happiness! ...“SCIENTIFIC CHALLENGESAs a trained computer scientist and musician, holding aPh.D in music information retrieval and AI, my researchhas been shifting from pure number crunching toethnographic techno-sociological prototyping. Theunderlying theme gets meanwhile a little bit clearer than itwas in the beginning. Any kind of interaction (man-man,man- mobile device, machine-machine, etc.) which istaking place in my personal habits when encounteringcities, people and technical artefacts seems to resonate withmy most inner search for balance and happiness. Therehave been devices (e.g. the iPOD touch for doing dualmodetwittering over WiFI and listening to my favorite music)and even applications (our prototype BluetunA for sharingmusic taste) that made me feel better, but the same way alot of the things around have been time-consuming,frustrating and separating. Ending up in 2008 indeed urbanplaces act like the main mediator for my personal wellbeingbeing connected to people and devices on differentranges. The mixture of instantaneous, near-field, city-wideand global interaction has to be in perfect balance tooptimize my daily journeys thru the city and life.Therefore the research rationale I will follow has beenblueprinted partially as a short term scientific missionentitled Urban Sync. It will investigate the matter ofhappiness and how it relates to aesthetics vs. efficiency, thehybrid of tradition and technology and the complexity ofmediating layers of diverse granularity and scale in urbanenvironments. As a starting point I will conduct anethnographic study by gathering realtime audio,physiological data, and network activities in the GHz rangein different european capitals. By using a portable GPSdatalogger the data will be underpinned by an accordingspatial representation. The setting of the research is difficultsince the well-known problems of in situ data collectionswhich are aimed at studying emotional responses and203
human behaviour will encounter. The technical setupconsists of a portable digital audio recording device, aprototypical smartband which records heart rate and skinconductance and a scanner to track activities in the HFrange. In combination with the time-stamped GPS datacomplete trails of my personal experiences will be recordedand stored for subsequent post-processing. This latter stagewill seek for correlates between the individual datachannels by using machine learning techniques andinformation visualization techniques.ACKNOWLEDGMENTSI am very thankful that Urban Sync is sponsored by EUCost action STSM-IC0601-3125.REFERENCES1. C. Nold (2004). http://www.biomapping.net/.2. L. Gaye and Mazé, Ramia, Holmquist, Lars Erik (2003).Sonic City: The Urban Environment as a MusicalInterface. NIME2003.3. A. Bassoli (2005). Design For Everyday Urban Life:Conceptualising the socio-technical challenges ofubiquitous computing, Ph.D proposal, Personalcommunication.4. A. Bassoli and Brewer, Johanna, Martin, Karen,Dourish, Paul, Mainwaring, Scott (2007). UndergroundAesthetics: Rethinking Urban Computing, IEEE UrbanComputing.5. S. Baumann and Bassoli, Arianna, Jung, Björn,Wisniowski, Martin (2007). BluetunA: let your neighborknow what music you like, CHI2007 Interactivity Track,San Jose, USA.6. A. Dunne and Raby, Fiona (2001). Design Noir: TheSecret Life of Electronic Objects.http://www.dunneandraby.co.uk..7. I.Thomas (2008). Bubbles of Radio,http://www.nearfield.org/2007/12/fictional-radio-spaces.8. S. Baumann (2008). http://urbansync.wordpress.com.204
Difficulties in Skill Acquisition and PervasiveEnvironmentsAdam BoulangerMIT Media Lab20 Ames St, Cambridge, MA 02139adamb@media.mit.eduABSTRACTPervasive computing implies new application opportunity asa result of technology integrated into everday environments.Whether considering the sophistication of emerging mobileplatforms, or the automation of routine tasks in service provision,technology mediated interaction is woven into thetime between home, work and leisure. Two recently emergingareas of innovation regarding mobile and pervasive applicationspertain to health and learning. However, whererecent findings in these areas seem to indicate the potentialfor ubiquitous applications in everyday environments, thereare caveats presented by the nature of interactions betweentraditional work, home and leisure environments. The paperintroduces the opportunities, challenges and potential solutionsto integrating robust health and training applicationsinto automated journeys.Author KeywordsNovel user experiences, outdoor applications, pervasive applicationdesign, interaction designACM Classification KeywordsH.5.m [Information Interfaces and Presentation]: MiscellaneousINTRODUCTIONWith an ever-growing cohort of individuals getting older,health care and social systems are struggling to redefine whatit means to consume resources and remain engaged duringthe later stages of life. In tandem with this demographicbased need, aging is one of many areas to have had a renaissanceof sorts, in response to recent findings regardingbrain plasticity. The brain is malleable, positively reshapingitself in response to many different forms of learning. Incontrast, as we get older the brain undergoes characteristicdegenerative changes[13]. Somewhere between these twoprocesses, it has been found that maintaining a rich intellectuallife, learning new skills throughout life, and adhering toa minimum of physical activity not only maintains a highergeneral level of cognitive function, but also staves off diseaseprocesses such as Alzheimers disease[12, 7].It becomes possible to envision applications that utilize multimediarich mobile platforms to engage skill acquisition atdiverse moments in our daily lives towards positive health.However, several key considerations of movement throughcities contradict concerted skill acquisition during these transientmoments. When mobile, is it possible to consolidateinformation? Secondly, as one can expect a modicum of passivityin transitional environments, does learning require activeengagement? Lastly, how can training systems competewith the interface of the environment to support any attentionfrom a user?CONSOLIDATIONEfficiency requires downtime. An interesting area that highlightsthis fact is sleep research[11]. It has long been understoodthat sleep is necessary for optimal cognitive function,as it is reflected in the behavior of sleep-deprived individuals.Sleep deprived individuals are worse-off. However,recent neuroscience studies have been providing insight intothe process of consolidation, in which many different typesof memory require a cascade of brain changes that only happenduring sleep. Our understanding of these processes is atthe cellular level of detail. For example, researchers Gais,Rasch, et al. [6], with a placebo controlled crossover design,have shown a visual task where, if a certain neurotransmitteris inhibited during sleep, improvement in the measured visualskill simply does not take place the following morning.Neural cellular processes also support time-course sensitiveprocedural learning while awake[1], as explored by mechanismssuch as long-term potentiation[8] and long-term depression[2](a kind of sensitivity of activated cells to primefor subsequent information from the same stream in the future).The point is that consolidation and downtime is criticalto learning.Turning to everyday environments, the contradiction of integratingskill acquisition tools into our everyday environmentis that efficiency is not monotonically related to theamount of time engaged. Potentially, the time in betweenwork, home and leisure is required to support cellular mechanismsof consolidation. A potential solution is to build systemsthat explore learning with sensitivity away from sheerrepetition. By oscillating between moments where users arebeing exposed to information they are required to engagewith to learn, and moments where the users are allowed tosimply exist in the everyday environment devoid of directengagement, technologies will mutually support skill acquisitionwhile recognizing the biological limits reinforced bynon-engaged movement through the city.PASSIVE VERSUS ACTIVE LEARNINGConstructionism is a dominant theory of education in whichlearning is proposed as part of an active process in which1205
mental models of the world are tested, and tested best whileusers build in their environments[10]. This directly contradictsthe idea that significant learning can take place passively.Moreover, as an individual passes between activeenvironments, whether home, work or leisure activity, thetransient everyday environment may be the exact oppositeof what constructinists have shown to be the type of environmentthat supports active learning.A potential solution once again lies along the time-courseof information presentation. All moments in passing fromone environment to another are not created equal. Some momentswarrant attention, mediating any technology drivenlearning task to the passive background, and other momentsdo not. When a user reads a book on a subway train, theymediate their own give-and-take between activity and passivityof the reading endeavor. Technologies to support skillacquisition need to similarly allow for this give-and-take. Todo so, repetition of key moments in the learning process, orduring the presentation of information, distribute the pressurefor a user to acquire the information across a larger periodof time, supporting their external requirement to be ableto be, at some moments, actively engaged, and at other moments,not. This doesn’t address the lack of building opportunityin the everyday movement through the city, but suchdetail would need to be addressed given the nature of theskill to be acquired or the information to be learned.Multi-sensory InterfacesSimilarly, purely from an interface perspective, the sensorydomains in which a user is engaged at any given time duringtransition in their environment are disproportionately visual,tactile, or auditory, based on the task at hand. The trainis loud. Driving is visually exhausting. Exchanging cashfor services has a user in a tactile exchange. As humancomputerinteraction begins to examine assistive devices anduniversal access[5, 9], as well as multiple domains of inputfor novel systems[3, 4], these research agendas can teachus how to actively engage users across sensory disciplines.If a mobile learning tool, in parallel, presents information tomultiple sensory domains, diverse competitive environmentsto the learning tool can be compensated for. If the environmentin one moment demands disproportionate visual attention,or tactile, the other domains can compensate.CONCLUSIONAt the interface of pervasive computing and our desire to acquireintellectually fulfilling, and subsequently healthy lives,new interfaces that introduce skill acquisition and learninginto our everyday environments are on the horizon. Theseinterfaces have the challenge of existing in the transitionbetween environments that are perhaps more suited to concertedstudy and learning - those of the home, work, or leisureenvironments. However, that does not discount the opportunityto combat where the environment is adverse to skillacquisition. We have shown that a better understanding ofthe biological limits of information consolidation, the natureof different types of learning, and drawing from ongoingresearch into multisensory interfaces can provide researchbased strategies to begin to develop learning applications forthe automated journey.REFERENCES1. W. Abraham and J. Williams. Ltp maintenance and itsprotein synthesis-dependence. Neurobiol Learn Mem,89(3):260–268, 2008.2. M. Bear. A synaptic basis for memory storage in thecerebral cortex. Proc Natl Acad Sci USA,93:13453–13459, Nov 1996.3. S. Carter, A. Hurst, J. Mankoff, and J. Li. Dynamicallyadapting guis to diverse input devices. In Assets ’06:Proceedings of the 8th international ACM SIGACCESSconference on Computers and accessibility, pages63–70, New York, NY, USA, 2006. ACM.4. P. Dhawale, M. Masoodian, and B. Rogers. Bare-hand3d gesture input to interactive systems. In CHINZ ’06:Proceedings of the 7th ACM SIGCHI New Zealandchapter’s international conference on Computer-humaninteraction, pages 25–32, New York, NY, USA, 2006.ACM.5. P. Emiliani and C. Steriadis. Universal access toambient intelligence environments: opportunities andchallenges for people with disabilities. IBM Syst. J.,44(3):605–619, 2005.6. S. Gais, B. Rasch, U. Wagner, and J. Born.Visual-procedural memory consolidation during sleepblocked by glutametergic receptor antagonists. JNeurosci, 28(21):5513–5518, May 2008.7. A. F. Kramer, L. Bherer, S. J. Colcombe, W. Dong, andW. T. Greenough. Environmental influences oncognitive and brain plasticity during aging. J GerontolA Biol Sci Med Sci, 59(9):940–957, 2004.8. R. Malenka and R. Nicoll. Long-term potentiation–adecade of progress? Science, pages 1870–1874, 1999.9. Z. Obrenovic and D. Starcevic. Modeling multimodalhuman-computer interaction. Computer, 37(9):65–72,2004.10. S. Papert and I. Harel. Constructionism. AblexPublishing Corporation, 1991.11. M. Walker. A refined model of sleep and the timecourse of memory formation. Behav Brain Sci,28(1):51–64, 2005.12. R. S. Wilson, C. F. Mendes De Leon, L. L. Barnes,J. A. Schneider, J. L. Bienias, D. A. Evans, and D. A.Bennett. Participation in cognitively stimulatingactivities and risk of incident alzheimer disease. JAMA,287(6):742–748, 2002.13. B. Yankner, T. Lu, and P. Loerch. The aging brain.Annu Rev Pathol, 3:41–66, 2008.2206
Automation as a very familiar placeMads IngstrupUniversity of AarhusAabogade 34, 8000 Aarhus N, Denmarkingstrup@gmail.comABSTRACTWe propose that the constraints set by the infrastructuressupporting our journey through spaces we create are astrong determinant of how we experience those spaces andtheir places. We argue that rigidity of infrastructuralconstraints causes familiarity, and that familiarity breedsthe automatic experience.Author KeywordsAutomation, qualitative experience, infrastructure.ACM Classification KeywordsH5.m. Information interfaces and presentation (e.g., HCI):Miscellaneous.INTRODUCTIONThe train came out of the long tunnel into the snow country.The earth lay white under the night sky. The train pulled upat a signal stop.A girl who had been sitting on the other side of the carcame over and opened the window in front of Shimamura.The snowy cold poured in. Leaning far out the window, thegirl called to the station master as though he were a greatdistance away.—Yasunari Kawabata, Snow CountryThe infrastructure making our journeys through spacespossible have also always shaped our experience of thosespaces. We wish to propose that the constraints ofinfrastructure are an important though certainly not the onlyfactor in producing our experience of the journeys theysupport.We are interested in the qualitative attributes ofinfrastructure and consider their consequences for theautomatic experience. The choice of the wording"qualitative attribute" rather than the software engineeringterm "quality attribute" is intentional—we want to allude tothe richness of meanings that are determined throughqualitative studies rather than the more restricted notion ofquality used in software engineering, which intend tocapture what, when talking about software, is meant by a'quality product'. At the same time, we take note of theexperience in software architecture that the structure orstructures of a system are strong determinants for thatsystem’s quality attributes [1], including usability [2]. Wehypothesize therefore that the architecture of ourtechnological infrastructures is similarly important to theways in which we experience the places and spaces theysupport.The quotation chosen to initiate this paper illustrates howdifference in landscape as evident to a train passenger canbe used to evoke a feeling of place to readers. In the handsof a nobel-prize winning author, the familiar features oftrain cars and a winter landscape are used to reconstruct forreaders a sense of place. Arguably, much of the power inthese concepts as used here lies in their familiarity. Theyare familiar because they are stable across a variety ofcontexts—a journey by train in Scandinavia now comparedwith one in Japan some hundred years ago, while notexactly the same, has some stable and defining features: thepassive traveler situated in the train car, observing thelandscape passing by the window.What is more, the stability across many contexts of howtrain travel is experienced enables a shared understandingbetween people. Much of this stability is due to thetechnically necessary features of rail infrastructure. It bynature defines one or more fixed and non-negotiable routesthrough landscape, and the passenger is necessarilyconfined to “their” place in the train car for much of thejourney. Certainly the passenger can get up and go toanother car, but the practical circumstances given in thetrain car is a strong force for most passengers to surrenderand remain passive in the place defined by others, the traincar.What happens to our experience of journeys such as traintravel if it is infested/blessed with the wave of technologiesubicomp represents—enabling people to increasinglypersonalize their surroundings? Personalize, we must note,is justified precisely because it allows people’s preferencesto direct more aspects of their own experience, enablingthem to make places their own. When people make placestheir own, by e.g. choosing the soundtrack to their journey,they are simultaneously avoiding the alternative. That207
alternative, the place that could have been or the displacedplace, is what we currently have a diminishing opportunityto study. It is rich and important precisely because peoplecannot choose and personalize ad infinity, because it bringsout the frequently collaborative behaviour of appropriationthat, in de Certau’s [3] terms, are the tactics of the weak.Personalizing ones experience rather than producing itcollaboratively would seem particularly likely duringtransportation, as the people one happens to be co-locatedwith are often strangers.Opportunities for personalization, of course, are neverunbounded. Infrastructure always constrains behaviour, andanyone who has tried to reuse software will know that is noless true for digital technology. What is the relationshipbetween the constraints set for us by technologicalinfrastructures supporting mobility and the ways in whichwe experience journeys? Will the digital infrastructures oftomorrow enable future authors to draw on experiences itframes with the same richness that Kawabata does for traintravel? Or will an unprecedented opportunity forpersonalization mask the influence of infrastructure’sconstraints, making them too subtle, localized and personalto allow analysis?Tailoring of technology to the preferences of the individualis to a degree orthogonal to the question of control—who isdoing the personalization. On the one hand authors such asAarts et al. [4] envision environments saturated with AItechnology that are able to artfully adapt to the desires ofthe individual. On the other hand, initiatives such asPalCom [5] emphasize the necessity of people remaining incontrol. We take the position, along with Barad[7], thatdistinctions are always local, including the of distinctionbetween humans and digital agents as pointed out bySuchman[6]. In some contexts this distinction matter, inothers it does not. To designers it often matter a great deal,because designers must try to match technology with use.For users they may not be important—how many of us areaware of when the trains we travel in are steered by ahuman an when by a computer?The position that the distinction between human and digitalagents is localized—important in some contexts and not inothers—enable us to ask the question: in what contexts is itmeaningful to talk about automation as a distinct mode ofcontrol ? Perhaps it is not meaningful in general.Automation does not always mean external to a humanbody. Psychologists know that a large part of our everydaybehaviour is automatic in the sense that we are notconsciously aware of it [8]. The ways in which oftenrepeated patterns of behaviour become automatic is familiarto most people. Distinguishing between what we dounconsciously and what is done for us that we are notconscious about may not be significant in every context.Thus the employee who bicycles to work following thesame route as he or she has for twenty years may have anexperience that is every bit as automatic as that of theperson who for twenty years have been going to work onthe same computer-steered train. Yet if we instead look atthe means available to them for handling contingencies, thedistinction between automation-in-the-body andautomation-in-the-computer becomes significant. If a needarises en route to change the destination, the person in thetrain is left with fewer options—those designed for him orher—than the person who drives a bicycle. This exampleshows that the force causing automation can be of differentmagnitudes—automation-in-the-body is easily changed oroverruled by the individual, whereas automation in whichcontrol is situated in infrastructure is much more rigid.This, interestingly, is true for digital infrastructures aswell—any software architect will agree that changing thearchitecture of a system has far-reaching consequences, andis often very costly.CONCLUSIONWe have suggested that the rigidity of constraints set byinfrastructures, digital or otherwise, is a key factor inproducing the automatic experience. Digital technologiesthat increase the opportunity for personalization maychange the ways in which infrastructure influence ourexperiences. In particular, we raised the question of whetherit makes the meaning of our experiences more personal andtherefore less shared. Further we suggested that the notionof automation can usefully be analyzed in terms of wherecontrol is situated and in terms of the rigidity of itsimplementation.ACKNOWLEDGEMENTSThis work was supported by the Hydra EU project (IST-2005-034891).REFERENCES1. Bass, L., Clements, P., and Kazman, R. Softwarearchitecture in practise. 2 nd ed. Addison-Wesley, 2003.2. John, B.E., and Bass, L. Usability and softwarearchitecture. Behaviour & Information Technology,20(5):329–338, 2001.3. de Certeau, M. The practice of everyday life. Universityof California Press, 1988.4. Aarts, E., Harwig, R., and Schuurmans, M. Ambientintelligence. In P.J. Denning, editor, The invisiblefuture: the seamless integration of technology intoeveryday life, 235–250. McGraw-Hill, 2002.5. PalCom. www.ist-palcom.org.6. Suchman, L. Human-Machine Reconfigurations.Cambridge University Press, 2006?7. Barad, K. Meeting the universe halfway: the … DukeUniversity Press, 2007.8. Bargh, J.A., and Chartrand, T.L. The unbearableautomaticity of being. American Psychologist,54(7):462–479, 1999.208
Connectability in Automated JourneysShin’ichi Konomi and Kaoru SezakiCenter for Spatial Information Science, the University of Tokyo4-6-1, Komaba, Meguro-Ku, Tokyo 153-8505, Japankonomi@csis.u-tokyo.ac.jpABSTRACTAutomated journeys are intimately intertwined withtechnologies that capture, transfer, store, process, anddisplay information. Analyzing the impact of such complexenvironments on urban experiences is a challenging task.As a first step towards understanding automated journeys,we focus on the connections among people, things andplaces, and introduce the notion of connectability in relationto the active human process of establishing meaningfulrelationships. By rethinking existing technologies in a cityfrom the perspective of connectability, we can begin toidentify key dimensions of the design space of technologiesfor meaningful relationships.INTRODUCTIONIn a city like Seoul, pedestrians use digital technologiessuch as mobile phones, RFID transportation tickets/gates,and contactless payment systems. While these technologiesare being proven to make our journeys efficient, theirimpact can go beyond the narrow concerns of efficiency.Indeed, they can enable us to encounter everyday spaces innew ways, creating “alternative spatialities” (Dourish,2006).We can begin to understand automatic journeys’ broaderimpact by analyzing how people, things and spacesencounter one another in such journeys. To closely examinethe process in which people establish connections, wedistinguish connectability and real connections.Connectability arises when there is perceivable relevance ofpeople, things and spaces. People can selectivelyexternalize and/or internalize it as a real connection such asa friendship, a Familiar Stranger (Paulos and Goodman,2004), and a ‘location bookmark.’ Technologies couldautomatically generate connections (e.g., food traceabilitysystems.) Alternatively, they can generate connectabilitythrough the provision of information resources, whichpeople can interpret and use in order to actively establishmeaningful connections.Information media play a key role in communicatingconnectability and thereby influence real connections. Forexample, the rise of the popular print culture may havechanged the connections of geographical spaces in the headof the public 1 . More recently, social networking websites1 Ikegami (2005, p.371) carefully suggests that this could havebeen the case in pre-modern Japan.reflect and influence the connections among people.Embedded devices in a city could similarly influence theconnections that we make in everyday spaces.CONNECTABILITY IN A CITYUbicomp technologies had begun to fill urban spaces withvarious kinds of connections and connectability. 2Dbarcodes printed on food packages digitally connect thefood items and relevant information about farmers, shippingdates, and agricultural chemicals. People use mobile phonebasednavigation systems (e.g., NAVITIME (Arikawa,Konomi and Ohnishi, 2007)) not only for wayfinding butalso for proximity search and geographical ‘bookmarking.’RFID transport tickets (e.g., Japan Railway’s SUICA) storetens of train-ride records in their read/write memory. Theserecords can be displayed or printed for personal reviewingand reflection. NaviTa [www.poster.suica.jp/navita.html]extends the interactive poster SuiPo (Tsunoda et al., 2007),enabling travelers to easily fetch a local map and a directoryof nearby stores/services on their phones (see Figure 1).Systems like this could influence the way we associate onespace with another, and the traces we leave (e.g., throughRFID scanning and wireless web access) influence the waywe present ourselves to the world, possibly influencing theconnectability about us.Figure 1. The NaviTa system at Tokyo Station. People can fetch alocal map and store/service directory by touching their RFIDchippedmobile phones on the green “touch area.”LOVEGETY: LESSONS LEARNEDLovegety (see Figure 2) is a commercial matchmakingdevice that uses short-range radio. It is an extremely simpledevice, having only two push buttons. One is the powerbutton and the other is the mode button for selecting one ofthe Talk, Karaoke and Get modes. (The three small LEDs209
elow the mode button indicate the current mode.) LED 1blinks if peer devices exist in proximity (about 5m) andLED 2 blinks when the modes of the colocated devicesmatch. The slide switch on the left is used to turn on/off thesound that accompanies blinking.The device is not on the market anymore, but we can stilllearn from relevant popular writings such as the book“Lovegety Perfect Manual” (Gety Study Group, 1998). Thisbook has 151 pages,including 40 short anecdotesfrom users, 7 “basic laws”for hooking up smartly, 16pieces of “expert advice,”and 30 maps of populardowntown spots acrossJapan together with shortdescriptions of howLovegety could be used inthese spots.Due to the author’s anonymity and the writing style thatresembles the ones in lowbrow entertainment magazines, itmay be wise to be cautious about the credibility of what thebook says. Yet, the book seems revealing about the subtletyand delicateness of the social space in which the device isembedded. For example, it is not recommended to simplyturn on the device:“If you find someone who you think might have Lovegety,first off, just quietly walk in front of the person, and, atthat moment, cast a quick look and make eye contact.Then, turn on the mode of your Lovegety after one or twominutes. It is said that the talk will go smoothly in thisway.” (p.20)Acknowledging such subtlety around connectability, wecan carefully examine how things are in today’s automatedjourneys and how things could be in the future.TOWARDS SUPPORTING CONNECTABILITYSince connectability is a highly general concept, it may beuseful to consider various kinds of connectability in relationto the following 6 dimensions:(1) People - things- spaces(2) Digital -physical(3) Explicit -implicit(4) Real time -batch(5) One Time -repeatedLED 2SlideswitchFigure 2: LovegetyPowerbuttonModebuttonConnections can be made within and across thefollowing categories: people, things and spaces.Connectability can be represented by using digital,physical, as well as ‘hybrid’ media.Connectability can suggest connections explicitly orimplicitly. Connectability can be ambiguous.Connectability can be identified in real time (e.g.,Lovegety) or through batch processing (e.g., post hocanalysis of GPS traces)Some opportunities to connect arise only once. Othersarise multiple times and even repeatedly. Thisdimension is also relevant to serendipity.(6) Ignorability Connectability can/cannot be ignored without causingnegative effects (cf. “plausible ignorability”)Table 1. Dimensions of connectability.We would like to explore the design space of technologiesfor supporting connectability, based on these 6 dimensions.In doing so, we can consider social networks (Konomi et al.,2006; Konomi, Sezaki and Kitsuregawa, 2009),relationships of spaces, and ecology of objects (Brewer,Mainwaring and Dourish, 2008).CONCLUSIONWe discussed connectability as a first step towardsunderstanding automatic journeys’ broader impact beyondefficiency. Ubicomp technologies can enable new forms ofconnectability in a city, and technologies for supportingconnectability need to be integrated into subtle humanprocesses. We then introduced the 6 dimensions that couldbe used to explore the design space for supportingconnectability. In a related research project, we havequantitatively examined pedestrian movements andproximity patterns in a train station (Konomi et al., 2008),and we plan to qualitatively examine pedestrian experiencesas a next step. We feel our discussions are most related tothe theme “Layers of Mediation and Interaction” althoughwe touched upon the issue of “Automated Identities.”REFERENCES1. Arikawa, M., Konomi, S. and Ohnishi, K. (2007) NAVITIME:Supporting Pedestrian Navigation in the Real World, IEEEPervasive Computing, 6(3), pp.21-29.2. Brewer, J., Mainwaring, S. and Dourish, P. (2008) AestheticJourneys, Proc. DIS’08, pp.333-341.3. Dourish, P. (2006) Re-Space-ing Place: “Place” and “Space”Ten Years On, Proc. CSCW’06, pp.299-308.4. Gety Study Group (1998) Lovegety Perfect Manual, HitenPublishing, Tokyo. (in Japanese)5. Ikegami, E. (2005) Bonds of Civility: Aesthetic Networks andthe Political Origins of Japanese Culture. CambridgeUniversity Press, New York.6. Konomi, S., Inoue, S., Kobayashi, T., Tsuchida, M., andKitsuregawa, M. (2006) Supporting Colocated InteractionsUsing RFID and Social Network Displays. IEEE PervasiveComputing, 5(3), pp.48-56.7. Konomi, S., Li, M., Shao, X., Suzuki, R., Sezaki, K.,Shibasaki, R. and Nakagawa, Y. (2008) Making Sense ofProximity-Based Patterns in a Public Space, AdjunctProceedings of PERVASIVE 2008 (Late Breaking Results),pp.31-35.8. Konomi, S., Sezaki, K., Kitsuregawa, M. (2009) Historyenrichedspaces for shared encounters, Shared Encounters,Springer. (forthcoming)9. Paulos, E. and E. Goodman (2004) The Familiar Stranger:Anxiety, Comfort, and Play in Public Places. Proc. CHI 2004,pp.223-230.10. Tsunoda, F., Matsumoto, T., Nakagawa, T., Utsunomiya, M.(2007) Implementation of interactive poster "SuiPo," CHI’07Experience Report, pp.1863 - 1868.LED 1210210
Liminal, Spiritual, and Ritual: Fabrication and Evasion inUrban Journeys through Portable DevicesNithya SambasivanDepartment of InformaticsUniversity of California, IrvineIrvine 92697-3425, CA, U.S.A.nsambasi@ics.uci.eduLeena Ventä, Jani Mäntyjärvi, and Jonna HäkkiläNokia Research CenterYrttipellontie 690230 Oulu, Finland{firstname.lastname}@nokia.com 211
212
The Everyday CollectorCati VaucelleMassachusetts Institute of TechnologyMIT Media Lab20 Ames StreetCambridge MA 02139cati@media.mit.eduABSTRACTThis paper presents the conceptualization of the EverydayCollector as a bridge between the traditional physicalcollection and the growing digital one. This work supportsa reflection on the collection impulse and the impact thatdigital technologies have on the physical act of collection.Author KeywordsCollection, video, mobile phones, environment,storytelling.ACM Classification KeywordsH5.m. Information interfaces and presentation (e.g., HCI):Miscellaneous.INTRODUCTIONI gather artifacts. They recall my experience. They are aproof that something existed. This sense of appropriatenessof my history through the act of collecting allows me torealize that my past is not gone, and exists in part throughthe process of recollection. I discover someone else’shistory when I play with antique toys. The pleasure isimmense in reading, witnessing, guessing another person’slife, her struggle and hope invested into objects. I create astory for the existence of each object that has one day beenpossessed and cherished.Objects gone from their context can be reinserted throughmemories. Integrated or abandoned from their originalsurroundings, they can be organized, labeled, reinserted intheir period through analysis. The collector looks for cuesin the world to witness a story or to make sense of one. Thecollector visualizes, records, and plays back moments fromher or someone else’s history to reflect on it and beimmersed in experience.The scope of the digital is growing and fundamentallytransforms our lives. Materiality is being technicallyextended. The digital offers another variety of artifacts thatimpact remembrance. The experience of digitally capturingthe everyday and making sense of it through the physicalact of collection could be combined. The digital couldinform the physical, the physical could ground us deeper inour surroundings, and they both could exist independentlyfrom one another.THE EVERYDAY COLLECTORI propose the conceptualization of the Everyday Collectoras a bridge between the traditional physical collection andthe growing digital one. This work supports my reflectionon the collection impulse and the impact that digitaltechnologies have on the physical act of collection. The keyto bind the physical act of collection and the digitalopportunity of representation is metadata. Imagine ascenario where the object discovered grows referencesbeyond the thing held, and the thing seen. The digital worldcan tie to an infinite number of features of the object, onlylimited by the technologies used to analyze and link thedata. However, even simple features gain new meaningthrough tagging to the collected object. I investigatemetadata such as location, temperature, and personaltagging on gathered objects.As an example, the Everyday Collector allows users tocollect temperatures - from the heat of the sun to the cold ofthe ice, invited to capture more complex temperature suchas the soil that is associated with metadata, visuals andauditory samples. The participants retrieve the data pergathered items in their physical and digital laboratory.The system encompasses the experience of the collectorand invites the creation of an associative memory oftextures, smells, temperatures, locations, places and objects.Value is to be found in both the collection of the objectdigitalrelationships, as well as the unique opportunity tore-visit the world represented by this type of tagging andexploration. Individuals collect samples from theirenvironment and connect them to their digital collection.The digital metadata of the collected elements is retrievedin association with the physical keepsakes.DESIGNThe Everyday Collector is envisioned as a valise that offersthe carrying of technical devices that I develop forencoding the context of collected objects. From thefrequency analysis of an object to a sound amplifier for aninsect: a sound recorder's amplifier specifically captures thesound of the most minuscule creature encountered, theanalyzed features of collected objects are translated into a213
digital collection of features to accompany the physicalobject.In addition to collection, the story of gathered elements isretrieved through its digital relationships, queued byfeatures such as the weight of an object. Self contained, thevalise allows both the capture of digital media and objectsin context with one another and the audio-visualization ofthese media, driving the explorer into an experiencewithout separation between physical and digitalopportunities.The workshop will allow me to observe how urbanelements are captured, gathered and collected bothphysically and digitally.DISCUSSION“I was on the beach recently and saw a woman walkingwith her Scottie dog and he had a rock in his mouth. And Isaid, “That’s so nice that your dog is bringing a rock backfrom the beach for you.”. She said, “oh, this is not for us.This dog collects rocks.” And she said he would spendfifteen of twenty minutes on the beach looking around for arock that resembled the ones he already had, which wereroughly hamburger shaped, and put them under the bed. –Charles Randall Dean In The sensibility of the collector.2006. Philoctetes”.The impact of this work is to challenge the exclusivity ofdigital and physical opportunities of interaction, and rather,provide an experience where the physical process ofcollection is completely married to contextualization viadigital means. I plan on documenting how this physicaland digital opportunity leads to new processes of discoveryand wonder in the primitive act of collection.214
UbiWORK: Design and Evaluation ofSmart Environments in the WorkplaceMaribeth BackFX Palo Alto Laboratory3400 Hillview Ave Bldg. 4, Palo Alto CA USAback@fxpal.com(Communicating organizer)ABSTRACTThis workshop is the fourth in a series of <strong>UbiComp</strong>workshops on smart environment technologies andapplications for the workplace. It offers a unique windowinto the state of the art through the participation of a rangeof researchers, designers and builders who exchange bothbasic research and real-world case experiences; and invitesparticipants to share ideas about them. This year we focuson understanding appropriate design processes and creatingvalid evaluation metrics for smart environments (a recurrentrequest from previous workshop participants). What designprocesses allow integration of new ubicomp-style systemswith existing technologies in a room that is in daily use?What evaluation methods and metrics give us an accuratepicture, and how can that information best be applied in aniterative design process?Author KeywordsMeeting support, smart conference rooms, design process,evaluation, augmented environments, multimedia,teleconferencing, user centered design, interactive furniture.ACM Classification KeywordsH5.m. Information interfaces and presentation (e.g., HCI):MiscellaneousINTRODUCTIONThe workplace, and in particular the smart conferenceroom, is one of the places where real-world applications ofubiquitous computing are most highly developed. Webelieve that what is learned there in the domain of designfor usability is relevant for the whole community. This yearwe focus on design issues for such augmentedenvironments, and on the metrics of use and evaluation; atopic that participants in previous workshops agreed iscrucial and where the evolution of a common set ofguidelines is urgently needed to enable wider adoption anduse of smart environment technologies.Saadi Lahlou, EDF R&D,, FranceKazunori Horikiri, Fuji Xerox, JapanMasatomi Inagaki, Fuji Xerox, JapanScott Carter, FX Palo Alto Laboratory, USAGerald Morrison, SMART Technologies, CanadaDesign processes for smart environmentsDiscovery: First, it is necessary to understand and describework context and activity (meeting types, solo orcollaborative work, decision making, idea creation, and soforth). What methods are effective, and what existingresearch is of particular value? How do we categorizeactivity? [2] Different activities may call for different builtsystems; can we effectively set up common guidelines forthe community? How do people know what to expect whenthey walk into a smart environment?Design processes: The design of ubicomp for theworkplace requires integrating devices, systems, and rulesof practice. How do design processes change with thetechnologies for smart environments? Workplaces use amesh of continuously evolving technologies: How can wedesign for continuous updates, devices from multiplevendors, as well as compatibility issues? What designmethods can account for these and similar constraints?Evaluating smart meeting environmentsA smart meeting environment requires investment. It isimportant, then, to perform evaluations in order tounderstand their everyday use as well as how they impactspecific groups as well as the organization at large.Evaluation is also a critical first step in integrating thedesign of a smart environment. However, several barrierscan stand in the way of effective evaluations. As work onmetrics for ubicomp evaluations has shown [1,3], standardeffectiveness, efficiency, and satisfaction metrics areimportant., but many other issues loom large. It is importantalso that users are not too distracted by all of thecapabilities of a smart environment that they find it difficultto complete simple tasks. It can also be problematic tomeasure the effectiveness of collaborative interactions.Furthermore, it is necessary to understand the extent towhich users feel in control of their environment and howwell the space responds to their actions? Users also need tounderstand how the space adapts to their customizationpreferences. Finally, understanding impact is important: Isthe new space accepted, and to what extent does it changeusers' behaviors or even the behaviors of the entireorganization?Workshop format, activities, goals, scopeFormat: Focus will be on discussion and idea sharing,rather than presentation. We will start with a round-robinintroductory session (a couple of minutes per participant),1215
immediately followed by a subset of invited panels,demonstrations and/or short talks on workshop sub-topics,which will serve as provocations and points of departure forlater discussion.Activities: We will begin with brief reviews of and remarkson salient research; a few lightning demos; discussions(alternating between breakout teams to identify and classifyareas of interest, and larger whole-group discussions) andfinally proceed to a collation of ideas. The session will alsoprovide a quick “state of the art” overview to participants.Goals: We will focus on the recurring theme of designprocess and evaluation metrics for smart environments,with the goal of better understanding the iterativerelationship between these. By beginning to develop aconceptual framework for commonalities in these areas, wemay outline a set of guidelines or standards for designingand evaluating smart environments, particularly nextgenerationconference rooms.Scope: The scope of interest includes but is not limited to(in no particular order): design processes for augmentedenvironments and smart conference rooms, integratingmobile devices into smart environments, tools andapplications to support augmented environment design, theroles of sensing and context awareness (particularly inmetrics), and evaluation metrics and methodologies forconference rooms and other smart environments.Organizers of the workshopWe are a deliberately diverse group, drawing from severaldisciplines (computer science, electrical engineering,business systems, smart room hardware/software design,social science, and interactive architecture/design) andcultures (Japan, US, France, Canada). All of us have beenworking in aspects of ubiquitous computing, and smartmeeting rooms in particular, for many years in bothacademia and industry.Maribeth Back is a senior research scientist at FXPAL,and heads the Immersive Collaboration Environmentsproject, focused on mixed-reality workplaces. She hasworked on a number of smart environment systems as wellas mixed reality projects at Xerox PARC, MIT Media Laband Harvard Graduate School of Design. Saadi Lahlou is asocial psychologist who heads the Laboratory of Design forCognition at EDF R&D, a user laboratory in a large enduserorganization that pushes the state of the art and fostersdissemination. He is the coordinator of the rufae (researchon user-friendly augmented environments) network.Masatomi Inagaki, is a technology planner who heads thesmart environment design team in Fuji Xerox’s ubiquitoustechnology area. Currently, his work is focused ondesigning next-generation workplaces for effective andcreative collaboration. Kazunori Horikiri, is a seniorarchitect at Fuji Xerox with expertise in ubiquitouscomputing and distributed computing. Currently, his workis focused on designing computing-embedded workplacesthat enable knowledge workers to achieve effective andcreative collaboration. Scott Carter is a research scientistat FXPAL. He has developed several ubicomptechnologies, including peripheral displays and capture andaccess systems. Gerald Morrison is Director of ExternalResearch for SMART Technologies. Previously he was aSenior Development Engineer and Manager – ImageProcessing for SMART.Soliciting ParticipationWe will strive to attract diverse viewpoints, includingpeople from different cultures, research areas, anddisciplines, while maintaining a cohesive line of inquirythroughout the workshop. We hope to engage people withexpertise in smart environments for the workplace,multimedia communication, ubiquitous display systems,user-centered design, evaluation methods, and mobile andubicomp applications; and to draw engineers, researchers,and designers from both industry and academia.We will post a web site at http://www.fxpal.com/<strong>UbiComp</strong>2008/ todescribe the workshop. The site will be linked from each ofour organizations' web sites. We will also distribute flyersat appropriate related sites, post to email lists, and directlysolicit potential attendees.Selection of workshop participants and presentationswill be based on refereed submissions. Authors are invitedto submit a 1-2 page position statement describing theirinterest, experience or ongoing research in the field, andincluding a brief biography. Position statements shouldhave only one author, and admission to the workshop willbe for that person only. Position statements should be sentdirectly to back@fxpal.com and will be published on thewebsite. We would like to cap the workshop at about 20participants (including organizers). Both the number ofinformal queries we’ve already received about a workshopthis year and the depth of response to previous workshopsreveal considerable continued interest in the topic, and webelieve that entry will be competitive.Expected outcome of the workshopOne objective of this workshop is to form an ongoingframework for smart environment evaluation metrics. Thisincludes writing a collective paper proposing metrics forunderstanding the use of augmented rooms, with the aim ofpublication in a major journal. We are also considering aspecial issue focused on this topic, pulling "best of" workfrom all four years of the workshop.REFERENCES1. Carter, S., J. Mankoff, S. Klemmer, and T. Matthews. Exiting theCleanroom: On Ecological Validity and Ubiquitous Computing.Journal of Human-Computer Interaction, 23(1). Pages: 47-99. 2008.2. Lahlou, S. Human activity Modeling for Systems Design: a Transdisciplinaryand empirical approach. D. Harris (Ed.): EngineeringPsychology and Cognitive Ergonomics, HCII 2007, LNAI, 4562,Springer 2007, pp. 512–521.3. Scholtz, J.,and Consolvo, S. Toward a framework for evaluatingubiquitous computing applications. Pervasive Computing, 3(2), pp.82-88, 2004.216
Illustration of the Intelligent Workload BalancingPrinciple in Distributed Data Storage SystemsSergey Boldyrev and Sergey BalandinNokia Research CentreHelsinki, Finland{sergey.boldyrev, sergey.balandin}@nokia.comAbstract — This paper introduces the intelligent workloadbalancing algorithm which applies stochastic approximationmethod, in particular conditional density propagation[bootstrap], to estimate the importance weights of the tracked“content codewords” inside of local and external workloads andby observing weights to forecast the future accesses to those“content codewords”. As add-on the “content codewords” localitycan be estimated.Keywords: Intelligent workload balancing; distributed storage.I. INTRODUCTIONThe paper discusses workload balancing issues andprovides a novel mechanism of intelligent workload balancingfor highly constrained devices in heterogeneous networks.Within scope of the proposed system architecture any typeof the generated content which is necessary to store is analyzedby means of granular cache mechanism, sliced by informationdispersal mechanism and propagated through the network. Toundertake such activities a form of network transportabstraction, dispersed content codewords distribution androuting layers are usually utilised. The data codewordsdistribution tracking and propagation control approach arebased on conditional density propagation mechanism (for moreinformation see bootstrap filtering techniques and sequentialMonte-Carlo methods).Since any system, by means of a certain channel, is fetchingand delivering particular information the workload isgenerated. Which usually produces impacts to the overallperformance, reliability, and, energy consumption at thecorresponding endpoints. Thus, the mechanism of workloadmanagement is considered as the most important part of anysystem, especially if such system is distributed one.Workload balancing is the most challengeable capability ofany distributed system that is targeted in data storage, back-upor archival operations. This feature becomes especiallyessential when the provided storage space is located on theenergy and computationally constraint devices. There areseveral research studies [2]–[6] that address the problem byapplying different methodologies. However, the question ofnon-uniform or skewed load and/or external workloaddetection and balancing is still on the hype and any sustainablesolution is strongly appreciated by the research community.II. DEFINITION OF THE OPTIMIZATION CRITERIAThe presented approach addresses problem of intelligentworkload management where the workflow estimation andtracking are spatially correlated with a certain cost function.Traditionally, a distributed storage management is based oncertain set of rules or policies which are predetermined bybenchmarking and testing beforehand. It is rare the case, whensuch solution can be applied in highly constrained ordynamically changing environment. A good example of suchenvironment can be any nomadic system which is dynamic bydefinition, and where a number of devices can share storageresources and services. Indeed such environment can provide abetter user experience by allowing user to flexibly bring in newdevices and to access all information available in the multidevice system by using any of the involved devices. But ofcourse that comes at a certain cost.It is well known that the main issues of distributed systemsand distributed storage systems in particular come from theadequate analytical model composition within the real-timescope and in the dimensions of power consumption,responsiveness and predictability. The issues become criticalespecially when parameters of energy, performance andreliability should be managed concurrently. Therefore, adistributed storage solution can be efficiently designed usuallyfor a particular application area (for a certain type of physicalconnectivity and distribution of the device participants).Proposed approach solves issues stated above in the form ofa workflow model stochastic approximation which can beapplied in case if computing environment is dynamicallychanging system with multitude of uncertainties concentratedin dimensions of energy/performance/reliability and providingan effective framework for any new constraint accountingwhich can be incorporated to the system model almostseamlessly in just-in-time fashion.III.APPROACHA. Theoretical backgroundThis paper introduces the intelligent workload balancingalgorithm which applies stochastic approximation method, inparticular conditional density propagation [7], to estimate theimportance weights of the tracked “content codewords” insideof local and external workloads and by observing weights to217
forecast the future accesses to those “content codewords”. Asadd-on the “content codewords” locality can be estimated.As stated before, the workload models characterizeworkflow behaviour over time. To simplify workloadmonitoring these models are considered as auto-regressiveprocesses.Dispersal content distribution serves the role of “blackbox”that should be predicted with help of workload modelapproximation. In that sense autoregressive models capturesinput/output behaviour of that “black-box”.In more general case workload model can represent requestrate not only for the particular data object, which wasdispersed, but for the whole device which plays the role ofstorage provider.Since workload model manages content dispersing(codewords), including skewed and the non-uniform cases,content dispersal facilitate construction of the behaviouralmodels by means of the codewords access patterns analysis.Access pattern is formed as a combination of Read andWrite requests that are issued at a certain request rate.Workload model represents forecasted request rate of a system(device) payload as a function y(t) that depends on series ofactual request rate x i (t) (Read and Write requests).The following workload model estimation is assumed,auto-regressive (AR) with moving average (MA):B. Proposed solutionIn particular the following stages are defined:1. workload approximation by means of AR models andARIMA models, initial sampling provides initialprobabilities of the “content codewords”2. as the workload evolves, sampling against it providesweighted probabilities of the “content codewords”a. sampling against previous state of workload “contentcodewords”b. the weights of the workload calculationc. weights are normalized3. once the new weights are calculated process “contentcodewords” selection is undertakena. substitution with new weighted “content codewords”by re-sampling original (bootstrap filtering)b. proceed with p.2Algorithm presented above can be efficiently utilisedhaving distributed workload model as a sustained part of thewhole approach, and can be illustrated by Figure 1.Mm0y( t) y(t m) x ( t l)(1)mLl0liThis form can be elaborated from the general form of AR:My( t) y(t m) x ( t)(2)m0miAnd, from the general form of MA:Ly( t) x ( t l)(3)l0lThe values of L and M above show the MA and AR orders.Coefficients m , l can be identified using frequency transformmethods, e.g. Fast Fourier Transform (because spectrumdomain and model coefficients have the same information).Workload dynamics are modelled as 2 nd or 3 rd orderprocess, represented in discrete time t as second and third orderauto-regressive process.According to the estimated workload model can elaboratethe necessary impacts on content dispersing and can aggregateand transform conditional probabilities of content codewordslocation.iFigure 1. - Workload control, having process approximation asa part of distributed workload model.Or, in case if workload model, process approximation, isseparate solution, the actual distribution or aggregation can bedirect outcome then, illustrated by Figure 2.Solution above, the actual weighted codewords selection, isundertaken during workload model construction which isseparated superset process. Every time when workload modelis updated or created the determined weighted codewords aredestaged or appended to the model hit list for the nextworkload analysis cycle. Since proposed solution is memorylessand provides reliable estimation even within multimodalcase, it is energy efficient and scalable to different platforms.218
Figure 2. - Workload control, having process approximation asan independent partIV. CONCLUSIONS AND DISCUSSIONThe applicability of current approach and results can beunderpinned by simulation results. One can note the algorithmscalability, in particular to the “hyper”-modal case when thenumber of tracked “content codewords” can be enormous. Toillustrate the answer we can justify the size of the weightedprocess areas and provide a weighted clustering when “contentcodewords” can make groups of “content codewords” withapproximately same weights and process model parameters.The process of clustering can be adjusted by means of anyknown approach, for example by SVM.As it was shown above the main task in this case convergesto the content codewords propagation and locality estimation.It is interesting to note that the overall logic can be recognizedas optimal cache strategy without destage, since two distinctlocality types are valid in this case: temporal and spatial.The application of stochastic approach presented in thiswork provides more flexibility in workload adaptation todifferent environment. This can be characterized by nearlyoptimal performance in comparison with deterministicapproach. As it was shown proposed solution is memory less,which by definition saves more power and demands lesscomputing during the lifetime.This paper provides a sketch of the intelligent workloadbalancing mechanism which is scalable to the different casesand, because of the applied approach, has small needs forenergy and computational resources.REFERENCES[1] G. E. P. Box, G. M. Jenkins, and G. C. Reinsel, TimeSeries Analysis, Forecasting and Control, Third Edition,Prentice-Hall, Upper Saddle River, NJ (1994)[2] D. R. Karger and M. Ruhl, Simple Efficient LoadBalancing Algorithms for Peer-to-Peer Systems, ACMSymposium on Parallelism in Algorithms andArchitectures,http://projectiris.net/irisbib/papers/loadbalance:iptps04/paper.pdf,(2004).[3] G. Weikum, Data partitioning and load balancing inparallel storage systems, Mass Storage Systems,Proceedings of International Symposium TowardsDistributed Storage and Data Management Systems,Dept. of Comput. Sci., Saarlandes Univ., Saarbrucken,http://ieeexplore.ieee.org/xpls/abs_all.jsp?arnumber=373039, (1994)[4] J. Aspnes, J. Kirsch and A. Krishnamurthy, Loadbalancing and locality in range-queriable data structures,Proceedings of 23rd ACM symposium on Principles ofdistributed computing, ACM, NY,http://www.cs.washington.edu/homes/arvind/papers/skipbins.ps (2004)[5] J.D. Birdwell, Z. Tang, J. Chiasson, C.T. Abdallah andM.M. Hayat, Resource-Constrained Load BalancingController for a Parallel Database, Proceedings of 2006American Control Conference, MI,http://ieeexplore.ieee.org/iel5/11005/34689/01657197.pdf(2006)[6] D. Ganesan, B. Greenstein, D. Perelyubskiy, D. Estrinand John Heidemann, An evaluation of multi-resolutionsearch and storage in resource-constrained sensornetworks, Proceedings of ACM Conference on EmbeddedNetworked Sensor Systems (SenSys),http://www.isi.edu/div7/publication_files/evaluation_of_multi.pdf (2003)[7] T. C. Hesterberg, D. S. Moore, S. Monaghan, A. Clipson,and R. Epstein, Bootstrap Methods and Permutation Testshttp://bcs.whfreeman.com/ips5e/content/cat_080/pdf/moore14.pdf (2005)ACKNOWLEDMENTSThe authors would like to thanks Antti Lappetelainen forhelping in reviewing the paper and providing useful feedbackand modification proposals.219
Enhanced and Continuously Connected Environment forCollaborative DesignYoich HanadaKyoto Institute of TechnologyHashigami-chou Sakyo-kuKyoto-shi Kyoto-fu606-8585, JAPAN+81-75-724-7852m7624011@edu.kit.ac.jpYuji MatsumotoKyoto Institute of TechnologyHashigami-chou Sakyo-kuKyoto-shi Kyoto-fu606-8585, JAPAN+81-75-724-7852matu@kit.ac.jpRyusuke NakaKyoto Institute of TechnologyHashigami-chou Sakyo-kuKyoto-shi Kyoto-fu606-8585, JAPAN+81-75-724-7852naka@kit.ac.jpABSTRACTThis paper describes our current study in the developmentof a collaborative design environment that considers ICTand architectural space. The authors focus oncommunication in order to evaluate the collaborationenvironment, so that the objectives are as listed below.Objective 1. The evaluation of using the multi-screen andsharing console applications in the face-to-face designmeeting at the local site.Objective 2. Finding problems and its factors of thecontinuously connected project-rooms in the distributingsites.In our conclusion, we have verified the relation betweenthe communication and the applications of the environmentin the objective 1. with the objective 2, we have realizedand extracted four major issues towards improving thedistributing project-rooms environment in our future study,which is listed in the table.KeywordsContinuously connected, ICT, distributed site,communication, face-to-face group work.INTRODUCTIONUsing white boards and projection screens in a meetingroom is a typical style of a face-to-face meeting. Theprojector becomes a valuable tool because people usedigitized information to work on PC, and project it to shareinformation and discuss issues in a meeting. Although oneof the ways to make collaboration success is to install moretools and applications which are developed through ICT,there is another way of focusing on a spatiality.Projecting on a large screen and white boards of a wall isthat the entire space is transformed into “display”. It is infact primitive cases in which the form of informationdisplays is developing three-dimensionally and beginningto make-up environments that envelop people. When oneattempt to put those kinds of displays into practice, there isa noticeable difference in the way that information appearsbetween cases in which snippets of data appear on smalldisplays at regular intervals and ones in which data isdisplayed in three dimensions space and seen at a singleglance. To put it strongly, when displays are givenspatiality new possibilities in collaboration can bepioneered.When one operate a specialized display that has developedin three dimensions we stand up, raise our heads and showour abilities. Our eye lines meet and new conversations areinitiated. The data structure can be taken in at a glance,understood by repeatedly moving through it, andinternalized into the body.Our study group has been developing a computerizedprototype environment for collaboration, which attempts tosupport synchronous design collaboration in a face-to-facemeeting at a local site, and also in continuously connectedproject-rooms at distributing sites. This paper describes ourcurrent study of the development of the collaborativedesign environment.The specifications of the environment1) Space frame: It can be attached and removed easily forvarious instruments such as projectors, speakers,cameras, microphone, etc. The space structured byframes that creates a sense of being surrounded.2) Four-multi big screens: They are on the white board wall,the glass partition and the roll screen, and the glasstop table:- The White board wall for a wide screen projection.(110inch*2)- The Glass partition and the roll screen made by awhite permeability film for rear-projection. (110inch)One can write in the glass partition by marker pens.The Glass top table on which surface is filmed forunderneath projector has a function for drawing like awhite board on the projected surface.220
There is a central PC, which is connected network andcontrols this environment, and it consists of applicationsfor keyboard-mouse sharing, downward camera controlling,etc. Additionally, in order to support distributedcollaboration, this prototype also provides the desktopsharing application, the analog document sharing systemwith scanner, the scheduler for groups and data storage viainternet.The total number of Japanese characters counted 6847letters in exam A is much higher than one of exam B whichis counted 4733 letters (Fig. 2). Additionally, it can be seenthat each member of exam A talked a lot more than examB. In the result of questionnaire survey, we observedpositive comments that may indicate possibility to activateinteractions of the meeting. For examples, one of thecomments says that it is easier to reflect their own opinionto the meeting directly with own keyboard and mouse.Another comment is that sharing the keyboard and mouseenvironment create a sense of belonging in the meeting.The authors realized in the observation during the examsthat conversations tend to be occurred just after someoneoperates keyboard and mouse, which seems to make themeeting warm up with like the situation someone laughingor the tone of voice change. However, the data wecollected this time doesn’t show this phenomenonquantitatively. The phenomenon will be captured clearly inour future study.Exam A(sharing)Exam B(not sharing)Fig.1. The configuration of the prototypeA Face to Face Local Meeting EnvironmentThe authors focus on “operation” and “visualization” in aface-to-face meeting at local site. Two experiments asshown below have been carried out to evaluate theenvironment base on communication analysis.Exp.1: Sharing the keyboard and mouse for the“operation”. (Exam A, Exam B)Exp.2: Using the four-multi big size of screens for“visualization”. (Exam C, Exam D)The Result of the experiment 1All conversations take place in the exams were recorded onvoice recorder. When and how the keyboard and mouseoperation are recorded during exams. In order to see therelation between communication and the experimentalenvironments, all utterance of each examinee arereproduced on MSWord data sheet. Fig. 2 shows thenumbers of Japanese characters that each examinee spokeout in each exam.Fig.2. The number of Japanese letters (experiment1)The Result of the experiment 2The numbers of Japanese characters in all conversations arecounted in the same way of experiment 1. Fig. 3 shows thesum of the Japanese characters recorded on exam C (1screen) and exam D (4 screens). The total number of it inthe exam C is counted 16888 letters in the meeting periodof 77 minutes. The number of letters and the meeting timein the exam D are 9588 letters and 53 minutes. Thereforethe number of Japanese character counts per one minute is219 counts for exam C and 181 counts for exam D, whichmay explain that four-multi screens makes the meetingmore active than one screen.The authors analyzed the words of conversations that takeplace in the exams, and then categorize it into threecommunications types; “discussion”, "arrangement" and"others". The “discussion” is the communication thatincludes words relating to the subject of the exams. The“arrangement” is the conversation when the examinee talksabout arranging the computer operations and environments.The “others” is the communication that is neither the“discussion” nor the “management”.Fig. 4 shows the percentages of these three types for eachexam C and exam D. This indicates that the “discussion” ofthe exam C is more active than the exam D in the result ofFig. 3 into consideration.In addition, the status of application windows on the screensuch as size of window, position of window, and thenumber of the active-windows are recorded. When more221
than two application windows executed in the meeting ofexam A, the communication for the “discussion” takesplace rather than the communication for the “arrangement”,but on the other hand many execution of the applicationwindows create more “management” than “discussion” inthe exam B. It is likely that the multi screen can lead usersseamlessly to the discussion level of communication due toprojecting many application windows in a same time. Butexecuting many application windows in one screen as theexam B needs to spend a time to manage applicationwindows such as moving, minimizing, maximizing andarranging the windows in the conversation of the meeting.b) Local environment; six personal desks are in theprototype environment.Fig. 5. Distributed environment and Local environmentExam C Exam D(4 screens) (1 screen)Fig.3. The number of Japaneseletters about “discussion”(Experiment2)Exam C Exam D(4 screens) (1 screen)Fig.4. Communication types(Experiment2)Continuously connected distributed project-roomsThe prototype environment attempts to support not only aface-to-face local meeting but also distributed projectrooms.Although the TV conference systems via networkhas developed and been used as a common tool at an officeor a home, the function of these systems tend to designconnecting people to people for a face-to-face meeting ofdistributing sites, which means people connect the systemwhen they want to have a meeting with distributing peoplefor a certain time. On the other hands, our approach todevelop the prototype is to connect space to spacecontinuously. What we expect is that visualizing other siteon a big screen informs a situation and gives an awareness,which may produce communication effectively tocollaborate between distributed sites.In order to understand that the contentiously connectedenvironment affects daily activities, the authors havecarried out the experiment in comparing local environmentand distributed environment for ten days; first five days islocal collaboration and second five days is distributedcollaboration. The examinees are six postgraduatesengaging in architectural proposal project.Configurations of collaboration environment are follows.a) Distributed environment; three personal desks are ineach sites. The main screen connects two distributedproject-rooms via TV conference system. The live imagesat another site are rear-projected on the big screen look likethe same room.PersonalspaceScreen for local siteprojectorScreen fordistributing sitesprojectorspeakerTV meeting systemMeeting tableHost computerprojectorNetwork comunicationvia video meeting systemScreen fordistributing sitesScreen for local siteFig.6. The Continuously Connected EnvironmentPersonalspaceEvaluation and Modification of Continuously ConnectedEnvironmentThe authors evaluate the environments of the continuouslyconnected project-rooms at distributing sites in this paper.The communication that is observed from field survey,self-photography survey, and a questionnaire survey areanalyzed. Examinee takes a photograph about problems ofenvironment and comment with it in the self-photo survey.This will enable us to understand problems picked out byuser about environment. The authors classify allcommunications into two types according to the placewhere communications happened. We pick out three222
aspects about collaboration based on the researches, andconsider the factor. Through the self-photography andquestionnaire survey, and communication analysis, weextracted four major problems that explain communicationbarrier between distributed sites, and considered and listedthe factors that related to the problems.Table 1. The results of contentious connected distributed project-roomsCommunication problems betweendistributing sitesIt is difficult to communicatecasually.More than two conversation groupscannot communicate in the samescreen.Communication take place dependon particular place.Project members tend tocommunicate in local site.The factors to occur the problemsThe casual communication is set lowpriority of conversation.Members feel possibility to interruptand disturb the progress at the other sitedue to less understanding of the context.The screen which shows other site is theonly cannel to communicate todistributing members.Member need to move the positionwhere microphone and camera cancapture their voice and Fig..It is easier to communicate locally.The sound of local conversation is toolow to listen, and the sound breaks dueto network problem so that member atother site can not follow theconversation.The environment is modified in aspects of digital tool andarchitectural space with being clear to distributedenvironment’s defects and theirs factors. We haveimproved the situation of taking place communication andawareness in distributed environment. In case of usingVNC, sharing the desktop computer continuously as triggeractivate communication because it works the awareness of“intention of doing” and” understanding the object”.Changing personal desks layout is mainly effective in“notice the existence of distributed members”. It ismeaningful to make architectural modification, such aschanging personal desks layout without adding anyinformation equipments and applications.Turning our attention to screen that is the hub of thecommunication between distributed sites, the authors verifythe effect of screen layout on communication. Screenlayout are classified as two types which are “Screenvisualizes distributed site” and “Screen shared operationbetween each site”. We sustain the space construction forsmooth communication in meeting, and its effect andimportance of attention on space. Concretely speaking,members in local environment intuitively understand thedirection of pointing and looking in distributed site. And soconsideration to screen layout have smooth communicationenabled.DISCUSSIONIn order to evaluate the face-to-face local meetingenvironment, the console applications of keyboard andmouse and the four-multi big size of screens are focusedand studied based on communication analysis. From theevaluation of sharing console applications, the authorsverified that communication activate if the input device ofthe keyboard and mouse can be owned individually tocontrol central PC. Additionally, we observed thephenomenon that the meeting during the exams gets warmup gradually just after the console applications are operated.In the result of the four-multi big size of screens evaluation,executing several applications and viewing information at aglance on multi-screen cut a time to arrange applicationsand create much time to discuss issues in the meeting. Allof these amounts to saying that four-multi big size ofscreens and sharing console applications makecollaboration proceed seamlessly.The environments of the continuously connected projectroomsat distributing sites are also evaluated. Through theself-photo and questionnaire survey, and communicationanalysis, we extracted four major problems that explaincommunication barrier between distributed site, andconsidered and listed the factors that related to theproblems.Future worksFuture studies might consider examining awareness supportbetween distributing sites of continuously connectedproject-rooms based on the result of this paper.Furthermore, the tabletop interface can be developedconsidering not only local meeting environment but alsocontinuously connected project-room.Reference1. P. Cook, C. Ellis, M. Graf, G. Rein, T., Smith.: 1987,Project NICK: Meetings augmentation and analysis,ACM Transactions on Office Information Systems,5(2), pp. 132-146.2. M.Stefik, G. foster, D. G. Bobrow, K. Kahn.S.Lanning and L. Suchman: Beyond the chalkboard:computer support for collaboration and problemsolving in meetings, Communications of the ACM,1(30), pp.32-47, 19873. Mao-Lin Chiu, Shige Yamaguchi and MitsuoMorozumi: 2001, Supporting Collaborative DesignStudio – Senarios and Tools, CAADRIA 2001,pp.125-1344. Marilyn Mantei: 1988, Capturing the CaptureLabConcepts: A Case Study in the Design of aComputer Supported Meeting Environment,Conference on Computer-Supported CooperativeWork, pp.257-2705. Toizumi, K. S. Yamaguchi: 1999, Computersupported face-to-face meeting environment forArchitectural design collaboration, internationalconference on systems research, infomatics andcybernetics preconference proceedings, pp.39-47.6. Yuji Matsumoto, Yasunobu Onishi, ShigeyukiYamaguchi and Mitsuo Morozumi: 2001, AddingMobile Environment to Design Collaboration on theWeb, eDAADe 2001, pp.311-322223
Secure and Dynamic Coordination ofHeterogeneous Smart SpacesNobuo KAWAGUCHIYohei IWASAKINagoya UniversityNobuhiko NISHIOIsmail ARAIRitsumeikan UniversityKoichi TANAKAShigeo FUJIWARAUchida Yoko Co. Ltd.INTRODUCTIONRecent advances of ubiquitous technology enabledevelopment of smart rooms and spaces in several researchorganizations. Generally, smart rooms and spaces areequipped with sensors, appliances, and computer controlledactuators. Also there might be a middleware or software forcontrolling these smart rooms.Nagoya University has developed a middleware named“cogma”[1] and constructed a smart room named “cogmaroom”. “cogma” can be used as a tool to support everydaylife in the ubiquitous computing. Ritsumeikan Universityand Uchida Yoko Co Ltd. have developed a smart spaceand a control software named “UnitedSpaces”[2]. Like theinitial stage of the internet, this kind of smart rooms shouldbe interconnected each other(Figure.1). However, ourmiddleware are based on completely different concepts. Soit is not possible to directory connect and cooperate eachother. In 2006, we started a joint research project toovercome several difficulties related to federation of thesmart rooms and users.Ritsumeikan Univ.UnitedSpacesFrom the HotelHow to dynamicallyconnect each othersFederate Smart roomsusing a Smart PhoneOutdoorsFrom the TownAd-hoc communicationFigure 1. Secure and Dynamic Coordination ofHeterogeneous Smart Spaces.Nagoya Univ.cogma RoomCURRENT STATUS OF SMART ROOM COORDINATIONWe have developed solutions for each of problems in theheterogeneous coordination of smart spaces.HeterogeneityDifferent smart rooms may have their own design concept.So it is not easy to standardize a protocol for coordinationbetween heterogeneous smart rooms. In the current status,we employ simple “RESTful” Web service interfacedescribed by WADL[3] for smart room services.Secure CommunicationBy employing REST interface, we just use “https” as asecure transport protocol. In the smart room environment, itis not easy to specify the authorization on each user. Weemploy a “ticket” based authorization. In this scheme, themanager issues a ticket for the guest user. Current ticket isdefined as a XML format with digest signature.NAT problemsWe have developed a smart virtual network technologynamed “PeerPool”. By using PeerPool, user can add a directconnection between private networks using dual-NAT.Simple ConfigurationIt is not easy to configure the several technologies. Weintroduce a “Instant messenger” based smart interface forsmart room coordination named “NUE”.ACKNOWLEDGMENTSThis project is supported by SCOPE (061106004) (trategic Informationand Communications R&D Promotion Programme) from the Ministry ofInternal Affairs and Communications(MIC), Japan.REFERENCES1. Nobuo Kawaguchi, Cogma: A Middleware forCooperative Smart Appliances for Adhoc Environment ,ICMU2004, pp.146-151(2004).2. Yu Enokibori, Nobuhiko Nishio: ”Realizing A SecureFederation of Multi-Institutional Service Systems,”UbiSys2004(2004).3. Marc Hadley, Web Application Description Language(WADL), Sun Microsystems Laboratories TechnicalReports (TR-2006-153)224
Toward Easy Operation of Interactive Smart Meeting Spacewith Networked DisplayJongWon Kim, Sangwoo Han, and Namgon KimNetworked Media Lab., School of Information and MechatronicsGwangju Institute of Science and Technology, Gwangju 500-712, Korea{jongwon, swhan, ngkim}@nm.gist.ac.krINTRODUCTIONExtended computing and networking infrastructures are nowenabling diverse set of new services by linking a wide rangeof networked devices embedded in the ubiquitous computingenvironments. As an example, to support advanced collaborationamong knowledge workers distributed geographically,there have been extensive researches under the scopeof ubiquitous computing environments. Especially, to copewith several known problems in traditional room-based collaborationenvironments such as limited display resolution,uncomfortable sharing of visuals and documents, difficultoperation of collaboration tools, several prototypes have beendeveloped [1, 2]. To solve the above restrictions, we havebeen developing a prototype collaboration environment, namedas SMeet (Smart Meeting Space) [3, 4], for practical and interactivecollaboration with ultra-high-resolution interactivenetworked displays.As showcased in [4] and improved afterwards, connectedSMeet nodes are depicted in Fig. 2. Each SMeet node consistsof several networked devices, which can be flexiblycombined to construct customized meeting spaces based onuser intention. To organize collaborative environments betweenvarious types of meeting nodes (e.g., light-weight mobilenode and fully equipped conference room), the designedmeeting space enables users to select and use the most suitablenetworked devices and collaboration services to matchthe capability of meeting nodes. Thus, SMeet is designedto provide users to experience smart meeting rooms withfollowing collaboration services: high-quality audio/videocommunication among participants, large-scale tiled displayrepresenting a variety of video formats simultaneously, anduser-friendly display interaction using pointing and hand motiontracking devices.Recently our development effort on SMeet has been shiftedtoward easy node operation in order to enable the customizationof network-based interactive sharing of HD-quality mediaand data, human-display interaction using multi-trackingpointer-style devices, and intuitive GUI-based configurationsupport.SMART MEETING SPACE (SMEET) AND EASY OPERA-TIONAs mentioned above, SMeet is featuring interactive networkeddisplay for multiple participants. However, the initial prototypein [4] requires the involvement of several operators pereach node. Thus, in order to help participants to operatethe complex SMeet nodes with diverse networked devices,the basic framework of SMeet has been revised as shown inFig. 1.File SharingServiceMediaManagerMediaProducerServiceMediaConsumerServiceContext -awareDecisionEngineMedia & DataDataAdaptationServiceInteractiveGraphicsProducerServiceInteractiveGraphicsConsumerServiceDomainKnowledgePolicy(Automated) Decision MakingKeysUser operationData flowControl flowComponent & Composite ServicesNetworkingSMeetMediatorServiceDiscoveryNetworkConnectorServiceServiceMatchmakerRecommended NodeConfigurationACE ConnectorMultiple UsersNetworkMonitoringServiceSpace RepositoryMeeting Space StatesFilteringContext & ClassifyingServiceConfiguratorServiceComposerSessions &TasksInteractiveDisplayControlServiceMultimodal InteractionPointingServiceLocationTrackingServiceServices &Devices GUIInteractionGUISession GUIRemoteSMeetnodeDisplayNetworkedDisplayServiceDisplay ManagerRemoteSMeetnodeHand MotionTrackingServiceDisplay GUINetworkingGUIInteractionManagerTask GUISMeetNodeGUIs...SMeetSpaceGUIsEasy-to-Use ConfigurationFigure 1. SMeet framework with agent-based mediation and GUIbasedconfiguration.In the revised SMeet framework, following issues are speciallyaddressed.• Multi-agent-based Mediation The SMeet mediator (shownin Fig. 1 is a control point for a meeting node, which discoversdistributed devices and services, configures them(e.g., starting and stopping services, or customizing thetuning of service parameters), combines (or composes)distributed services for supporting user-intended collaborationtasks such as contents sharing by using interactivetiled display. To cooperate with other meeting nodes, theSMeet mediator represents the meeting node in order toexchange information (e.g., sharing meeting context) or tonegotiate with them (e.g., consulting cooperation strategiesfor given task). The meeting context (i.e., situationinformation such as service capability, service status, andusers’ preferences) is united with services, which is storedin the space repository. Also, service agents are attachedfor SMeet collaboration services in order to act as theintermediary between collaboration tools and the SMeet225
AudioProducer/ConsumerVideoConsumerSMeet nodeVideoProducerNetworkedDisplayDeviceNetworked DisplayDisplayControlMachineGateway Gateway GatewayHigh-performanceLANACEMediatorACEMediatorNetworked DisplayNetworkedDisplayDeviceDisplayControlMachineSMeet nodeGatewayHigh-performanceLANVideoConsumerAudioDeviceSmartPointerSmartHandTrackerLocationTrackerACEConnectorACEConnectorVideoProducerACEConnectorPersonalSMeet nodeACEMediatorMulticast -enabledNetworkMulticast -disabledNetworkACEMediatorACEConnectorAudioProducer/ConsumerVideoConsumerPersonalSMeet nodeVideoProducerVenue ServerP2P Overlay NetworkFigure 2. SMeet nodes with diverse networked devices.mediator. It parses the service description and executesthe corresponding collaboration tool. Since service agentscan communicate with the SMeet mediator in each SMeetnode, the desired service can be controlled by followingpre-defined actions such as start, stop, and configuration.Note that we utilize a multi-agent system based on JADE(Java Agent DEvelopment Framework) to realize the requiredmediation. As of now, by using JADE, we are developinga toolkit, where participating users access (viaSMeet mediator) various service agents to be operated bydevice agents.• GUI-based Configuration For each SMeet node, we considerthat, for automatic operation, the SMeet mediatormay consult declarative rule-based inference engines. However,it is believed that manual (easy-to-use) configurationwith minimal intervention of participating users arethe initial key for easy SMeet operation. Collaborationparticipants can manually configure the meeting node byusing specific interaction interfaces such as SMeet SpaceGUIs and SMeet Node GUIs. Note that SMeet SpaceGUIs are covering space-wide aspects and includes Session,Task, Networking, and Interaction GUIs. On thecontrary, SMeet Node GUIs are designed to cover nodespecificaspects and mainly covers Device and ServicesGUI and Display GUI. Note that Networking and InteractionGUIs belong to both Space and Node-level GUIs.The SMeet node is built with services providing elementaryand unique service function(s) for advanced collaboration.Users can select the services to organize customizedmeeting nodes, considering node capabilities andmeeting purpose. The service manager combines relevantservices based on given composition rules and assists toexecute complex collaboration tasks, for example, interactivedisplay control task by using a combination of interactionservices and display services. Finally, as of now,we have rather mature GUI for Display and preliminaryversion of GUIs for Session/Task, Devices/Services, andInteraction.CONCLUSIONIn this paper, we have introduced our vision to improve theusability of SMeet collaboration environments. By focusingon networked display and user-friendly display interaction,we have been prototyping SMeet nodes. With the proposedmulti-agent-based mediation and GUI-based configuration,it is partially verified that we can ease the operation of SMeetnodes.AcknowledgmentsThis research is supported by the Foundation of UbiquitousComputing and Networking (UCN) Project, the Ministry ofKnowledge Economy (MKE) 21st Century Frontier R&DProgram in Korea and a result of subproject UCN 08B3-O2-10M.REFERENCES1. M. Roman, C. Hess, R. Cerqueira, A. Ranganathan, R.H.Campbell, and K. Nahrstedt, “A middleware infrastructurefor active spaces,” Pervasive Computing, vol. 1, no. 4, pp.74-83, Oct. 2002.2. T. Prante, N.A. Streitz, P. Tandler, “Roomware:computers disappear and interaction evolves,” IEEEComputer, vol. 37, no. 12, pp. 47-54, Dec. 2004.3. S. Han, N. Kim, K. Choi, and J. Kim, “Design ofmulti-party meeting system for interactive collaboration,”in Proc. IEEE Int. Conf. on Communication System andSoftware and Middleware (IEEE COMSWARE 2007),Bangalore, India, Jan. 2007.4. S. Han and J. Kim, “SMeet: A smart meeting space withinteractive and networked display,” in Proc.UbiMeet@<strong>UbiComp</strong> 2007 (Workshop on EmbodiedMeeting Support: Mobile, Tangible, Senseable Interactionin Smart Environments), Innsbruck, Austria, Sept. 2007.226
Contents and Conditions of Face-to-Face Communicationin the WorkplaceYuji MatsumotoKyoto Institute of TechnologyMatsugasaki, Sakyo, Kyoto, JPNmatu@kit.ac.jpYoichi HanadaKyoto Institute of TechnologyMatsugasaki, Sakyo, Kyoto, JPNm7624011@edu.kit.ac.jpRyusuke NakaKyoto Institute of TechnologyMatsugasaki, Sakyo, Kyoto, JPNnaka@kit.ac.jpABSTRACTThe aim of this study is to find out suitable spatialrequirements for creative work. This paper focuses on“contents” of communications so that valuablecommunication for creative workers should be evaluated onthe basis of quality rather than quantity. Then we organizedthe relation between communication contents andenvironmental condition when people talk in the office.KeywordsFace to face communication, workplace design, observationINTRODUCTIONKey requirement for the physical office is “workplace forgroups” in order to maximize the knowledge productivityof a company. Effective face-to-face conversations betweenworkers in physical environments are becoming moreimportant in this information age [1]. It is necessary tomake communication active and smooth in a limitedamount of time while people are in the same space [2].This study discusses what constitutes an ideal space tosupport the worker’s good communication in the officethrough a case study. In order to find out the suitableenvironments for the communication we have grasped thesituations of conversation that occurred in office.The authors define the communication that produce aneffect or value as good communication. Communicationhas been evaluated by questionnaires and observation aboutcommunication quantity that is the number of the timesconversation occurred.STUDY FLOWIt is shown the flow of this study in Fig.1. At first, theauthors classified face-to-face communication into fiveindexes by main topics in Table.1. Then we analyzed therelation between the five indexes and eight factors thatexpress the situation of the communication. Moreover weorganized the situation when workers communicate.Contents of communication(Table1)1 23Factors of communication(Table2)5 contents exchanged in communication 8 factors that are important communicationCharacteristic situations are suitable for the each kind ofthe communicationHow is the good space for communication?Fig. 1. Flow of this studyTable 1 indicates five communication topics that occurredin the office and traded the new effect or value. The authorsclassified the main topics of communication into fivecategories (knowledge / information, experience / knowhow,idea, motivation, answer/ new direction / agreement).Table 1. 5 topics that result from communication exchangesIndex1.Knowledge / Information2.Experience / Know-how3.Idea4.Motivation5.Answer/ New direction /AgreementTopicInsights, intuitions and thoughts thatbased on substantive understandingsSkills, techniques that it is difficult toexpress.Conception, thought, imaginationFeelings that people want to achievesomething. Incentive for action.To make decisions, to draw a conclusion.OBSERVATION OF ACTUAL OFFICE SITUATIONOutline of case studyPeople in two of all five sections were selected as subjectsin this company. Group A had 29 workers and Group B had21 workers and their job was to make people comfortable towork in order to increase the efficiency on the company.These fifty workers worked in the same room.The case study was carried out for 8 hours a day during twodays. It was continued for eight hours a day. A fieldobservation, video and interval shooting, and questionnairewere carried out.Office environment that took as object of this studyIt is shown in Fig.2 that we carry out this research. The areaof this office space is 881[m2]. We divided object room forthis case study into four zones; 1) A personal-work zone, 2)An avenue zone, 3) A meeting zone, 4) An amenity zone.227
228
Table 3. Ratios of frequency classified by topics and factors of communicationContinuationNumbershorterthan 1-5min 5-10min 10- 15- 30-60-120min 23 4 5 6 78 91015min 30min 60min1minKnowlede/Informati 1.4 0.9 1.1 0.8 1.2 0.5 1.1 1.0 1.0 1.1 4.2 0.0 0.3 0.0 - -Experience/Knowhow0.3 1.2 1.5 4.0 0.0 1.6 0.0 1.0 1.1 0.0 0.0 0.0 0.0 0.0 - 0.0Idea 0.5 0.9 1.4 5.3 0.0 3.2 4.5 1.1 0.6 4.5 0.0 0.0 0.0 0.0 - 0.0Motivation 2.4 0.5 1.2 0.0 0.0 0.0 0.0 1.2 0.0 0.0 19.1 0.0 0.0 0.0 - 0.0Answer/Newdirection/Agreemen0.5 1.1 1.2 0.5 3.2 3.4 10.1 1.0 0.9 0.2 0.5 - 8.1 - - 0.0Position Trigger CategoryDirectionCrossUsefulUsefulUseful IrrelevanatStandininformationConfronSurrounBe Spokeninformation forinformation informationBeside g and TurnScheduled Speak to Ad hoc Otherfor one'sAcquiretdtoone's workfor one's work for one'sSittingworkdirectlyin the future workindirectlyGive BothKnowlede/Informati 0.7 1.1 1.5 0.8 0.5 0.5 1.0 1.1 1.0 0.8 0.8 1.0 1.5 13.1 0.3 0.9 1.1 1.1Experience/Knowhow0.0 1.7 1.9 0.4 1.3 0.7 0.8 0.8 1.0 1.7 0.0 0.8 1.6 3.7 0.7 1.0 0.9 1.4Idea 0.0 1.3 1.5 0.7 1.2 1.4 2.2 0.9 0.5 1.7 4.4 0.9 1.2 0.0 1.4 0.7 0.8 2.7Motivation 0.0 1.4 1.7 0.2 8.6 0.0 0.0 0.3 0.5 4.5 0.0 0.4 1.3 5.8 5.0 0.7 1.0 2.2Answer/Newdirection/Agreemen2.7 1.0 0.6 1.2 0.5 2.3 2.4 1.0 1.2 0.4 0.3 1.3 0.5 0.3 0.1 1.1 0.9 0.9PlaceMemberPersonal-work Zone Meeting Zone Avenue Zone Amenity ZoneIn otherAroundVendingIn same In other On the section andpersona persona Around Meeting Meeting MeetingAroundSmokingOther floorAisleUtilityRest space machine/ boiler Bath roomsection section other floor on otherl desk l work printer table coner roomcabinetroomroomfloorzoneKnowlede/Informati 1.1 1.2 1.1 0.2 1.3 0.8 2.1 0.4 - 0.5 0.0 1.1 0.0 0.4 1.0 1.2 0.7 0.4Experience/Knowhow1.0 1.3 0.0 0.0 0.0 1.8 3.6 0.0 0.0 0.0 0.0 0.0 0.0 0.0 1.1 0.9 0.7 0.0Idea 1.0 0.0 0.0 1.4 2.2 1.7 1.6 1.1 0.0 1.8 0.0 0.0 0.0 0.0 1.1 0.7 0.0 22.4Motivation 1.0 0.0 0.0 0.0 0.0 0.0 5.0 3.5 0.0 0.0 0.0 0.0 0.0 0.0 1.0 1.2 0.0 0.0Answer/Newdirection/Agreemen1.0 1.2 1.0 1.4 1.7 12.3 0.3 1.3 0.0 0.6 0.0 0.0 0.0 0.8 0.9 1.0 1.7 2.0Features of communication that frequency appearTable3 shows the ratios of frequency classified by topics inface-to-face communication and eight factors that influencecommunication. The following graphs in Fig.6-13 showcharacteristic situations for every kind of content. Only partof the outstanding situations were picked up and mentionedas follows.Knowledge/ InformationRegarding the communication that people exchange“Knowledge / Information”, it showed tendencies to occurin personal-work zone, to talk in a group with 2-4 peoplewho work on the same floor, to do during comparativelyshort time (Fig.6). We can realize in Fig.7 the informationthat seemed to relate in the future got higher pointremarkably than other three categories.60-120min30-60min15-30minShorter than 1min10-15min1-5min5-10mi nFig.6. Conversation lengthIrrelevanat i nformation forone's workUs eful information for one'swork directl y Us eful information for one'swork in the futureUs eful information for one'swork i nd irect lyFig.7. Information categoriesExperience/ Know-howThis kind of communication seemed that the tendency totalk during comparatively long time and to do on aisles oraround personal desks and chairs (Fig.8). Moreover, it isclear that few workers (Fig.9) who are sitting in the nextseats or confront with tend to start communication ad hock.In terms of the category of job, “Experience / Know-how”were often evaluated as the information that seemed toaffect the future of one’s job.personal desk Around pers onal workOn other f loorzo neBath room Around printerVending machine/ boilerMeeti ng tableroomRest spac eSmoking roomUtilityFig.8. PlacesAround cabinetAi sleMeeti ng conerMeeting room98107Fig.9. Number of participantsIdeaIn case of “Ideas”, we can find the tendency that meetingspaces, meeting rooms and meeting tables caused acommunication that was scheduled beforehand such as anarrangement or staff meeting. And these communicationswere often formed by participants from different sections.However, ideas were often expected to be caused ad hock(Fig.10) because we can notice that Fig.11 shows thatalmost idea was exchanged by workers to each other.Moreover, it was only ideas that had high ratio tocommunicate in the smoking room. An interesting point toemphasize is that some communications began whenworkers who were around him/her moved.Ot he rAd hocSc heduledFig. 10. TriggersSpeak toBe Spoken toBoth2Ac quire6354Gi veFig.11. Information direction229
MotivationsMotivations occurred on main aisle ad hock by people whowork in same room during short conversations (Fig.12, 13).Furthermore these communications showed that peopleexchanged motivation interactively. On the occasion that itoccurred around personal desk, we could frequently findthat two people who are sitting closely started to talk adhoc. In this case the contents often had nothing to do withhis/her work directly.60-120min30-60min15-30minShorter than 1mi n1-5min10-15min5-10minFig.12. Conversation lengthOtherAd hocScheduledSpeak toFig.13.TtriggersBe Spoken toAnswer/ New direction/ AgreementAs for communication that people traded during questionand answer discussions, they had tended to be occurred inmeeting rooms between workers belong to differentsections. In addition to this tendency, we can often find outcomparatively long time and scheduled conversation (Fig.14 and 15). Moreover, effective information for one’s jobdirectly occupied about 90%, it is higher ratio than all fivecontents that in communication. Therefore, it is clear thatanswer, new direction or agreement was regard as theeffective information for one’s job directly.Shorter than 1min60-120min1-5min30-60min5-10min15-30min10-15minFig.14. Conversation lengthOtherAd hocSc heduledSpeak toFig.15.TtriggersBe Spoken toCONCLUSIONThe authors focused on the topics of conversation takeplace in the office and propose a way to evaluate qualitiesof communication that regarding the communication thatproduce new knowledge or idea as valuablecommunication. Consequently the communication style inoffice environments between workers became clear. Belowis a table (Table 4) showing special situation.Generally speaking as for the tendency of place thecommunication occurred on “Main aisle” in the officerecurrent. Moreover, concerning trigger the communicationthat people start “ad hock” is high frequency. These seemedto become important viewpoints in order to design space tosupport good communications.All the consequences and consideration of this study arebased on a case study carried out in a section. Therefore,from now on we will perform observations at differentoffices and workers to confirm the results of this study. Wealso need to determine a way to analyze and observe morecarefully.REFERENCES1. I. Nonaka, H. Takeuchi, “The Knowledge: CreatingCompany”, Oxford University Press, 19952. Y. Furukawa, “Creative office environment”, Chikurapublishing company, 20023. S Mizuno, K Kato, M Saji, Y Matsumoto, R Naka, SYamaguchi,, “A study of Relations between OfficeLayouts and Communications”, Proc. 29th Symposiumon Computer Technology of Information, Systems andApplications, pp.55-60, 20064. M. Saji, K. Kato, Y. Matsumoto, R. Naka, SYamaguchi, “A Study of Relations between OfficeLayout and Communications“, Proc. 11th ITA, pp.105-115, 20065. S Yamashita, Y. Miyake, Y. Matsumoto, R. Naka, S.Yamaguchi, “Enhanced and Continuous ConnectedEnvironment for Collaborative Telework”, Proc. 11thITA, pp.92-104, 2006Table4. Characteristic situation classified by 5 topics and 8 factorsAnswer/KnowledgeExperience /IdeaMotivationNew direction // InformationKnow-howAgreementTime - 10-15min Rather long Shorter than 1min Long timeMember - -Other section / otherfloorSame floorOther floorNumber of people 5 people 2-3 people 4 people 2 people 7 peoplePlace Avenue Zone Avenue ZoneMeeting Zone /Avenue ZoneAvenue ZoneMeeting ZonePosition Beside Confront Beside Beside / Turn Cross / EncloseTrigger - Ad hocScheduled /Ad hocAd hocScheduledCategory Useful in the future Useful in the future -Useful in the future /UnrelatedUseful directly230
Author IndexArai Ismail ·········································· 224Auger James ·········································· 1Back Maribeth ···································· 215Balandin Sergey ································· 217Bardram Jakob E. ································ 51Barisic Daniel ······································· 75Bassoli Arianna ·································· 201Baumann Stephan ······························ 203Beigl Guido Stromberg Michael ········· 75Beigl Stephan Sigg Michael ················ 98Bennett Mike ······································ 148Bird Jon ·················································· 2Boldyrev Sergey ································· 217Boulanger Adam ································ 205Brandherm Boris ·································· 68Brewer Johanna ·································· 201Brewer Robert S. ··························· 6, 179Burke Jeff ············································ 194Carson Reynolds ···································· 1Carter Scott ········································ 215Cassinelli Alvaro ················ 1, 22, 26, 34,Chen Chuin-shan ······························· 170Chen M onchu ····································· 174Chen Yiqiang ······································· 30Chen Zita Chao-ling ·························· 170Cheverst Keith ····································· 57Choi Jaz Hee-jeong ···························· 168Chou Chien-nan ································· 170Clark Yvonne Rogers Andy ················· 2Clear Adrian K. ··································· 62Coyle Lorcan ······························ 128, 148Curran Kevin ····································· 136Dobson Simon ······································ 62Dourish Paul ······································ 168Dunne Anthony ····································· 1Ferscha Alois ······································ 129Foth Marcus ······································· 168Fujiwara Shigeo ·································· 224Galani Areti ········································· 57Goumopoulos Dimitrios Economou Christos······························································· 81Häkkilä Jonna ······································ 211Han Sang W oo ·································· 225Hanada Yoichi ···································· 220Hanada Yoichi ···································· 227Hancke Gerrit Niezen Gerhard P. ······ 17Hazlewood William R. ······················ 128Hegarty Rosaleen ······························· 136Hemmert Fabian ································ 140Hertrich Susanna ································· 14Holland Simon ······································· 2Holland Thomas ·································· 62Horikiri Kazunori ······························· 215Hwang Jaeseon ··································· 116Ikeda Takeshi ······································· 45Inagaki M asatomi ······························· 215Inagawa Kaori Fujinami Nobuhiro ···· 121Ingstrup Mads ···································· 207Inoue Yutaka ········································ 45Insua German Lado ··························· 148Ishikawa Alvaro Cassinelli Masatoshi··10Ishikawa Masatoshi ······················· 26, 34Iwasaki Yohei ····································· 224Jong Ya-wen ······································· 170Joseph Samuel R. H. ····························· 6Kameas Achilles ··························· 81, 110Kawaguchi Nobuo ····························· 224Kenny Eugene ···································· 148Kim Jong W on ··································· 225Kim JongW on ····································· 116Kim Nangon ······································· 225Kim Younghui ···································· 168Ko Sujin ·············································· 116Komulainen Hannu Heusala Jere ······· 93Komulainen Jere ································· 104Konomi Shin'ichi ································ 209231
Kray Christian ······························· 38, 57Kunito Goro ········································· 87Lahlou Saadi ······································ 215Landshoff Eiman Kanjo Peter ··········· 191Lim Hyuk ··········································· 116Lim Youn-Kyung ······························· 128Lin Hui-chun ······································ 183Liu Chad Chien-chia ························· 170Liu Kah ·············································· 183Lunney Tom ······································· 136M äntyjärvi Jani ··································· 211M arshall Paul ········································· 2M atsumoto Yuji ·························· 220, 227M eliones Apostolos ······························ 81M orrison Gerald ································· 215Mulvenna Maurice ····························· 136Naka Ryusuke ···························· 220, 227Nakazawa Jin ······································· 87Neely Steve ·········································· 38Ni Hongbo ··········································· 39Nikunen Hannu Heusala Karri ········· 104Nikunen Karri ······································ 93Nishio Nobuhiko ································ 224Nisi Valentina ···································· 174Nixon Paddy ································ 62, 148Oakley Ian ·········································· 174Offenhuber Dietmar ··························· 152Park Jun ············································· 116Park JunSeok ······································ 116Paulos Eric ········································· 168Perrin Sté ··············································· 22Pietsch Martin Kohler Jü ···················· 197Pousman Zachary ······························ 128Prendinger Helmut ······························ 68Qi Juan ················································· 30Quigley Aaron ···································· 148Quigley Aaron ····························· 62, 158Rashid Umar ······································ 158Rekimoto Takashi Miyaki Jun ·········· 187Reynolds Carson ·································· 26Riva Giuseppe ······································ 22Rizzo Antonio ···································· 164Rouncefield Mark ································ 57Sakakibara Hiroshi ······························· 87Sambasivan Nithya ···················· 183, 211Sashima Akio ······································· 45Satchell Christine ······························· 168Scott Neil ··············································· 6Sezaki Kaoru ······································ 209Shannon Ross ······························· 62, 148Stevenson Graeme ······························· 38Sun Zhuo ············································· 30Suthers Daniel ······································· 6Tanaka Koichi ···································· 224Taylor Alex ········································· 201Taylor Nick ·········································· 57Terada Tsutomu ··································· 74Tokuda Tomohiro Nagata Hideyuki ·· 87Torsi Silvia ········································· 164Ullrich Sebastian ·································· 68Vaucelle Cati ······································ 213Ventä Leena ······································· 211W ally Bernhard ·································· 129W ang Haipeng ····································· 39W ang Zhu ············································ 39W u Ruijuan ·········································· 39Yamamoto Kiyoshi ······························· 45Yamashita Tomohisa ···························· 45Yang Guanghong ··································· 6Yonezawa Takuro ································ 87Zerroug Alexis ····································· 34Zhou Xingshe ······································· 39232