Name of the Module PIE CHARTS & LINE GRAPHS - Sreenivasa ...
Name of the Module PIE CHARTS & LINE GRAPHS - Sreenivasa ...
Name of the Module PIE CHARTS & LINE GRAPHS - Sreenivasa ...
- No tags were found...

Create successful ePaper yourself
Turn your PDF publications into a flip-book with our unique Google optimized e-Paper software.
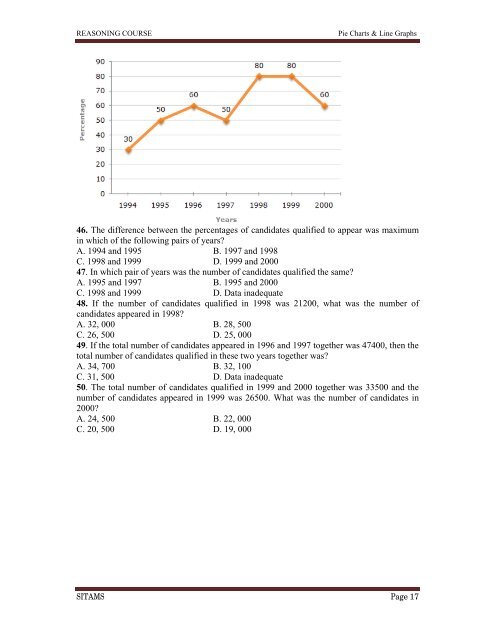
REASONING COURSEPie Charts & Line Graphs46. The difference between <strong>the</strong> percentages <strong>of</strong> candidates qualified to appear was maximumin which <strong>of</strong> <strong>the</strong> following pairs <strong>of</strong> years?A. 1994 and 1995 B. 1997 and 1998C. 1998 and 1999 D. 1999 and 200047. In which pair <strong>of</strong> years was <strong>the</strong> number <strong>of</strong> candidates qualified <strong>the</strong> same?A. 1995 and 1997 B. 1995 and 2000C. 1998 and 1999 D. Data inadequate48. If <strong>the</strong> number <strong>of</strong> candidates qualified in 1998 was 21200, what was <strong>the</strong> number <strong>of</strong>candidates appeared in 1998?A. 32, 000 B. 28, 500C. 26, 500 D. 25, 00049. If <strong>the</strong> total number <strong>of</strong> candidates appeared in 1996 and 1997 toge<strong>the</strong>r was 47400, <strong>the</strong>n <strong>the</strong>total number <strong>of</strong> candidates qualified in <strong>the</strong>se two years toge<strong>the</strong>r was?A. 34, 700 B. 32, 100C. 31, 500 D. Data inadequate50. The total number <strong>of</strong> candidates qualified in 1999 and 2000 toge<strong>the</strong>r was 33500 and <strong>the</strong>number <strong>of</strong> candidates appeared in 1999 was 26500. What was <strong>the</strong> number <strong>of</strong> candidates in2000?A. 24, 500 B. 22, 000C. 20, 500 D. 19, 000SITAMS Page 17