Name of the Module PIE CHARTS & LINE GRAPHS - Sreenivasa ...
Name of the Module PIE CHARTS & LINE GRAPHS - Sreenivasa ...
Name of the Module PIE CHARTS & LINE GRAPHS - Sreenivasa ...
- No tags were found...

You also want an ePaper? Increase the reach of your titles
YUMPU automatically turns print PDFs into web optimized ePapers that Google loves.
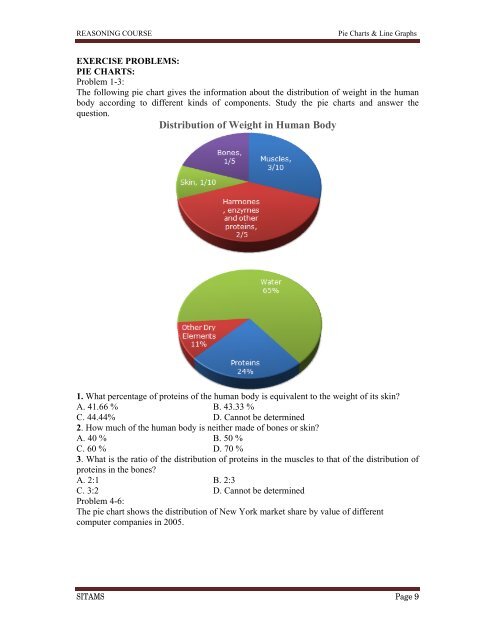
REASONING COURSEPie Charts & Line GraphsEXERCISE PROBLEMS:<strong>PIE</strong> <strong>CHARTS</strong>:Problem 1-3:The following pie chart gives <strong>the</strong> information about <strong>the</strong> distribution <strong>of</strong> weight in <strong>the</strong> humanbody according to different kinds <strong>of</strong> components. Study <strong>the</strong> pie charts and answer <strong>the</strong>question.Distribution <strong>of</strong> Weight in Human Body1. What percentage <strong>of</strong> proteins <strong>of</strong> <strong>the</strong> human body is equivalent to <strong>the</strong> weight <strong>of</strong> its skin?A. 41.66 % B. 43.33 %C. 44.44% D. Cannot be determined2. How much <strong>of</strong> <strong>the</strong> human body is nei<strong>the</strong>r made <strong>of</strong> bones or skin?A. 40 % B. 50 %C. 60 % D. 70 %3. What is <strong>the</strong> ratio <strong>of</strong> <strong>the</strong> distribution <strong>of</strong> proteins in <strong>the</strong> muscles to that <strong>of</strong> <strong>the</strong> distribution <strong>of</strong>proteins in <strong>the</strong> bones?A. 2:1 B. 2:3C. 3:2 D. Cannot be determinedProblem 4-6:The pie chart shows <strong>the</strong> distribution <strong>of</strong> New York market share by value <strong>of</strong> differentcomputer companies in 2005.SITAMS Page 9