Code profiling for optimization
Code profiling for optimization
Code profiling for optimization
- No tags were found...
Create successful ePaper yourself
Turn your PDF publications into a flip-book with our unique Google optimized e-Paper software.
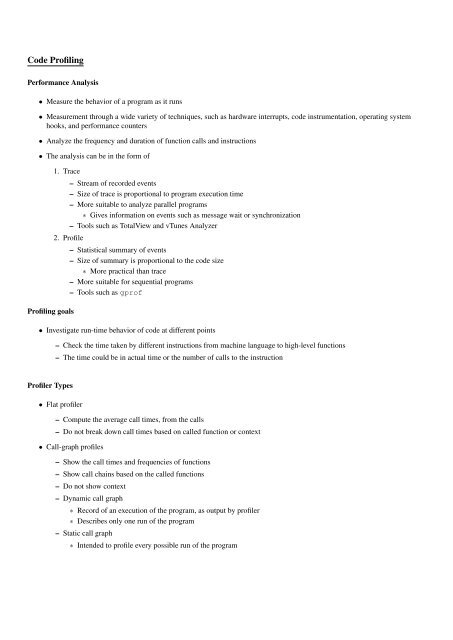
<strong>Code</strong> ProfilingPer<strong>for</strong>mance Analysis• Measure the behavior of a program as it runs• Measurement through a wide variety of techniques, such as hardware interrupts, code instrumentation, operating systemhooks, and per<strong>for</strong>mance counters• Analyze the frequency and duration of function calls and instructions• The analysis can be in the <strong>for</strong>m of1. Trace– Stream of recorded events– Size of trace is proportional to program execution time– More suitable to analyze parallel programs∗ Gives in<strong>for</strong>mation on events such as message wait or synchronization– Tools such as TotalView and vTunes Analyzer2. ProfileProfiling goals– Statistical summary of events– Size of summary is proportional to the code size∗ More practical than trace– More suitable <strong>for</strong> sequential programs– Tools such as gprof• Investigate run-time behavior of code at different points– Check the time taken by different instructions from machine language to high-level functions– The time could be in actual time or the number of calls to the instructionProfiler Types• Flat profiler– Compute the average call times, from the calls– Do not break down call times based on called function or context• Call-graph profiles– Show the call times and frequencies of functions– Show call chains based on the called functions– Do not show context– Dynamic call graph∗ Record of an execution of the program, as output by profiler∗ Describes only one run of the program– Static call graph∗ Intended to profile every possible run of the program
<strong>Code</strong> Profiling 2∗ Computationally undecideable; so static call graph algorithms are just overapproximationsgprof• Produces an execution profile of a program– Effect of called functions is incorporated in the profile of caller– Data is taken from a call graph profile file generated by programs that are compiled with the option -pg with gccor g++– Default name <strong>for</strong> the profile data file is gmon.out• Reads and correlates symbol table from the executable image (a.out) with the graph profile file


