Appendix
Appendix
Appendix
- No tags were found...

You also want an ePaper? Increase the reach of your titles
YUMPU automatically turns print PDFs into web optimized ePapers that Google loves.
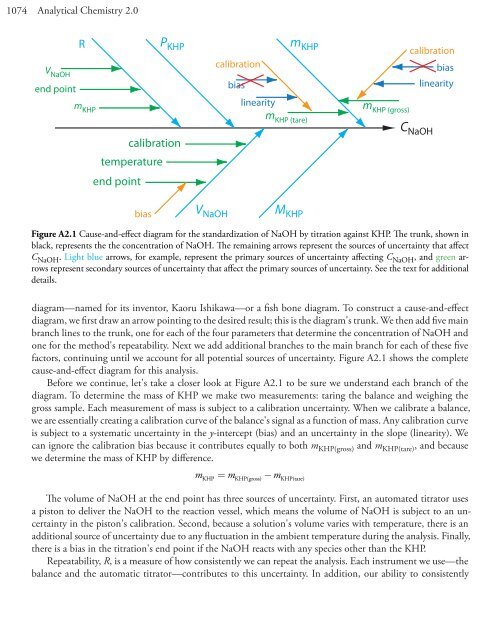
1074 Analytical Chemistry 2.0V NaOHend pointRP KHPm KHPcalibrationtemperatureend pointm KHPcalibrationbiaslinearitym KHP (tare)m KHP (gross)calibrationbiaslinearityC NaOHbiasV NaOHM KHPFigure A2.1 Cause-and-effect diagram for the standardization of NaOH by titration against KHP. The trunk, shown inblack, represents the the concentration of NaOH. The remaining arrows represent the sources of uncertainty that affectC NaOH . Light blue arrows, for example, represent the primary sources of uncertainty affecting C NaOH , and green arrowsrepresent secondary sources of uncertainty that affect the primary sources of uncertainty. See the text for additionaldetails.diagram—named for its inventor, Kaoru Ishikawa—or a fish bone diagram. To construct a cause-and-effectdiagram, we first draw an arrow pointing to the desired result; this is the diagram's trunk. We then add five mainbranch lines to the trunk, one for each of the four parameters that determine the concentration of NaOH andone for the method's repeatability. Next we add additional branches to the main branch for each of these fivefactors, continuing until we account for all potential sources of uncertainty. Figure A2.1 shows the completecause-and-effect diagram for this analysis.Before we continue, let's take a closer look at Figure A2.1 to be sure we understand each branch of thediagram. To determine the mass of KHP we make two measurements: taring the balance and weighing thegross sample. Each measurement of mass is subject to a calibration uncertainty. When we calibrate a balance,we are essentially creating a calibration curve of the balance's signal as a function of mass. Any calibration curveis subject to a systematic uncertainty in the y-intercept (bias) and an uncertainty in the slope (linearity). Wecan ignore the calibration bias because it contributes equally to both m KHP(gross) and m KHP(tare) , and becausewe determine the mass of KHP by difference.mKHP = mKHP(gross) −mKHP(tare)The volume of NaOH at the end point has three sources of uncertainty. First, an automated titrator usesa piston to deliver the NaOH to the reaction vessel, which means the volume of NaOH is subject to an uncertaintyin the piston's calibration. Second, because a solution's volume varies with temperature, there is anadditional source of uncertainty due to any fluctuation in the ambient temperature during the analysis. Finally,there is a bias in the titration's end point if the NaOH reacts with any species other than the KHP.Repeatability, R, is a measure of how consistently we can repeat the analysis. Each instrument we use—thebalance and the automatic titrator—contributes to this uncertainty. In addition, our ability to consistently