Appendix Gs Air Quality and Greenhouse Gas ... - Peabody Energy
Appendix Gs Air Quality and Greenhouse Gas ... - Peabody Energy
Appendix Gs Air Quality and Greenhouse Gas ... - Peabody Energy
- No tags were found...

Create successful ePaper yourself
Turn your PDF publications into a flip-book with our unique Google optimized e-Paper software.
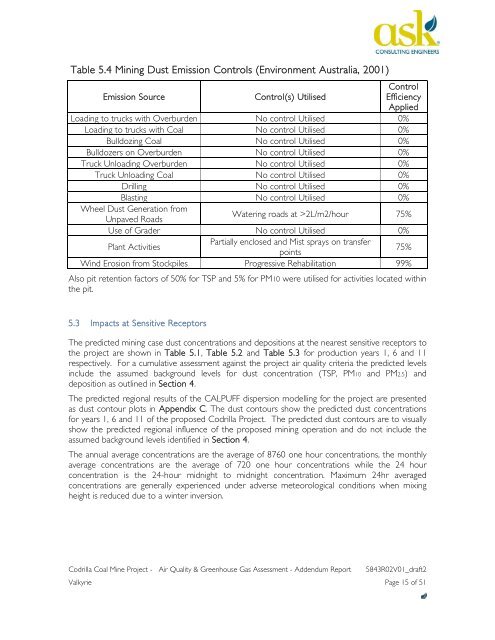
Table 5.4 Mining Dust Emission Controls (Environment Australia, 2001)Emission SourceControl(s) UtilisedControlEfficiencyAppliedLoading to trucks with Overburden No control Utilised 0%Loading to trucks with Coal No control Utilised 0%Bulldozing Coal No control Utilised 0%Bulldozers on Overburden No control Utilised 0%Truck Unloading Overburden No control Utilised 0%Truck Unloading Coal No control Utilised 0%Drilling No control Utilised 0%Blasting No control Utilised 0%Wheel Dust Generation fromUnpaved RoadsWatering roads at >2L/m2/hour 75%Use of Grader No control Utilised 0%Plant ActivitiesPartially enclosed <strong>and</strong> Mist sprays on transferpoints75%Wind Erosion from Stockpiles Progressive Rehabilitation 99%Also pit retention factors of 50% for TSP <strong>and</strong> 5% for PM10 were utilised for activities located withinthe pit.5.3 Impacts at Sensitive ReceptorsThe predicted mining case dust concentrations <strong>and</strong> depositions at the nearest sensitive receptors tothe project are shown in Table 5.1, Table 5.2 <strong>and</strong> Table 5.3 for production years 1, 6 <strong>and</strong> 11respectively. For a cumulative assessment against the project air quality criteria the predicted levelsinclude the assumed background levels for dust concentration (TSP, PM10 <strong>and</strong> PM2.5) <strong>and</strong>deposition as outlined in Section 4.The predicted regional results of the CALPUFF dispersion modelling for the project are presentedas dust contour plots in <strong>Appendix</strong> C. The dust contours show the predicted dust concentrationsfor years 1, 6 <strong>and</strong> 11 of the proposed Codrilla Project. The predicted dust contours are to visuallyshow the predicted regional influence of the proposed mining operation <strong>and</strong> do not include theassumed background levels identified in Section 4.The annual average concentrations are the average of 8760 one hour concentrations, the monthlyaverage concentrations are the average of 720 one hour concentrations while the 24 hourconcentration is the 24-hour midnight to midnight concentration. Maximum 24hr averagedconcentrations are generally experienced under adverse meteorological conditions when mixingheight is reduced due to a winter inversion.Codrilla Coal Mine Project - <strong>Air</strong> <strong>Quality</strong> & <strong>Greenhouse</strong> <strong>Gas</strong> Assessment - Addendum Report 5843R02V01_draft2Valkyrie Page 15 of 51