Appendix Gs Air Quality and Greenhouse Gas ... - Peabody Energy
Appendix Gs Air Quality and Greenhouse Gas ... - Peabody Energy
Appendix Gs Air Quality and Greenhouse Gas ... - Peabody Energy
- No tags were found...
You also want an ePaper? Increase the reach of your titles
YUMPU automatically turns print PDFs into web optimized ePapers that Google loves.
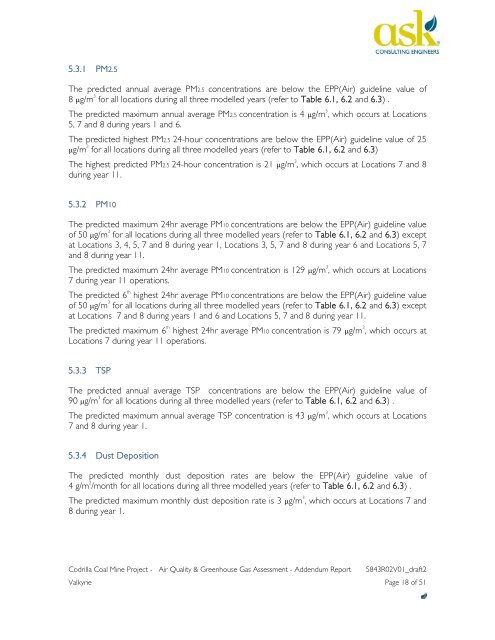
5.3.1 PM2.5The predicted annual average PM2.5 concentrations are below the EPP(<strong>Air</strong>) guideline value of8 g/m 3 for all locations during all three modelled years (refer to Table 6.1, 6.2 <strong>and</strong> 6.3) .The predicted maximum annual average PM2.5 concentration is 4 g/m 3 , which occurs at Locations5, 7 <strong>and</strong> 8 during years 1 <strong>and</strong> 6.The predicted highest PM2.5 24-hour concentrations are below the EPP(<strong>Air</strong>) guideline value of 25g/m 3 for all locations during all three modelled years (refer to Table 6.1, 6.2 <strong>and</strong> 6.3)The highest predicted PM2.5 24-hour concentration is 21 g/m 3 , which occurs at Locations 7 <strong>and</strong> 8during year 11.5.3.2 PM10The predicted maximum 24hr average PM10 concentrations are below the EPP(<strong>Air</strong>) guideline valueof 50 g/m 3 for all locations during all three modelled years (refer to Table 6.1, 6.2 <strong>and</strong> 6.3) exceptat Locations 3, 4, 5, 7 <strong>and</strong> 8 during year 1, Locations 3, 5, 7 <strong>and</strong> 8 during year 6 <strong>and</strong> Locations 5, 7<strong>and</strong> 8 during year 11.The predicted maximum 24hr average PM10 concentration is 129 g/m 3 , which occurs at Locations7 during year 11 operations.The predicted 6 th highest 24hr average PM10 concentrations are below the EPP(<strong>Air</strong>) guideline valueof 50 g/m 3 for all locations during all three modelled years (refer to Table 6.1, 6.2 <strong>and</strong> 6.3) exceptat Locations 7 <strong>and</strong> 8 during years 1 <strong>and</strong> 6 <strong>and</strong> Locations 5, 7 <strong>and</strong> 8 during year 11.The predicted maximum 6 th highest 24hr average PM10 concentration is 79 g/m 3 , which occurs atLocations 7 during year 11 operations.5.3.3 TSPThe predicted annual average TSP concentrations are below the EPP(<strong>Air</strong>) guideline value of90 g/m 3 for all locations during all three modelled years (refer to Table 6.1, 6.2 <strong>and</strong> 6.3) .The predicted maximum annual average TSP concentration is 43 g/m 3 , which occurs at Locations7 <strong>and</strong> 8 during year 1.5.3.4 Dust DepositionThe predicted monthly dust deposition rates are below the EPP(<strong>Air</strong>) guideline value of4 g/m 2 /month for all locations during all three modelled years (refer to Table 6.1, 6.2 <strong>and</strong> 6.3) .The predicted maximum monthly dust deposition rate is 3 g/m 3 , which occurs at Locations 7 <strong>and</strong>8 during year 1.Codrilla Coal Mine Project - <strong>Air</strong> <strong>Quality</strong> & <strong>Greenhouse</strong> <strong>Gas</strong> Assessment - Addendum Report 5843R02V01_draft2Valkyrie Page 18 of 51


