Already we have used the print statement to make animatedgraphics. We used the poke command in the last instalment tomake a more complicated animation. Both of those weretechnically animation, but nothing like the games you have seenor I talked about earlier, we used only one little character fromthe 256 that exist in the computer. OK clarify that, from thestock ones that exist. Remember that you can create your owncharacters.Well you saw that moving those little graphics symbols aroundtook some typing work. Also it took a bit of knowledge that atpresent we just don't have in our memory. By that I meanknowing things like the value to variables and how to structurethe lines. OK a big action game would be pretty muchimpossible to create in the way we have done. Simply put, wewon't always be limited to just a character from the characterset. You would like a larger thing on the screen for the gameright?That is where the idea of a sprite comes into play . What then is a sprite? A small somewhat evil creature inan AD&D game. No wait, sorry mind was in the wrong place.In the Beginning 10\Lord Ronin from Q-Link\www.commodorefree.comsprite and your shot hits, and because it hits in the right place,you make a collision with the bad guy. Simple idea and it tookme months to understand what was being said.On screen it was easier to see the idea of moving in front ofsomething or behind it. There is a book that I want to get thathas a demo disk of the things that are covered in the book.Sprites are one of them, I remember that the book showed a carthat drove by a garage, the car came back again and entered intothe garage. Now this garage had a simple window in it, and youcould see the car, or part of it through the window. That is whatclicked in my mind for putting a sprite in front of another one,or even behind it, and making it look good.Some bad examples are some games that I have played. One thatcomes to my mind is an aeroplane game. Simple sprites, with acouple of planes that are controlled by the joystick, youbasically Blast unlimited bullets at each other. Its a rather funsimple, little thinking, game. Sprite collisions here are thebullets hitting the planes. Now it would have been real nice ifthe clouds where something you could go behind, but no theyare as hard as granite. Hit a cloud and you don't go behind or infront of it, you crash and burn."A Sprite is a high-resolution programmable object that can bemade into just about any shape – through BASIC commands.The object can be easily moved around the screen by simplytelling the computer the position the sprite should be moved to.The computer takes care of the rest." 4th paragraph page 68 inthe user's manual.Strange words huh man? The book goes on to say that the spritehas "more power than just that". Colours can be changed.Collision detection, move in front or behind each other, changein size and more.Right that takes care of the two paragraphs quoted andinformation and you are more confused than I was the first timeI read the passages. Now then before you need to take a nitrotab, I'll try to explain all this weird talk.To the best of my knowledge all the 8 bit games played withsprites. Asteroids, defender, pacman and the like. OK maybethat isn't the correct word to use. I'm a lamer as you remember.Still the point is that these games I mentioned above, at least onthe C= use sprites. That can give you an idea of what a spritecan become in your future work.Yes you can change the colour of a sprite, you can also changethe size of a sprite. Three things that I quoted above come intomy explanation of a sprite. Moving in front or behind andcollisions. Sprite collisions are a strange concept and term, theguy that got me to understand it, to some degree was watchingme try to play a flying game. Sorry don't really remember thegame, may have been Zennon, anyway as I kept shooting theother space ships. He would just whisper out "Collision". WhenI crashed the space ship, he would shout out "Collision".Wanted to deck him at times., but he did show me theconnection of what I was doing to the sprite collision thing. I'lladmit that he also showed me a cartridge that plugged into theC=64 and then pointed out an option called something like,collision killer. Yeah that is what it did, I could smash up andnot be killed off in the game. I tell you that I then bought thatcart for my collection.Basically what I am saying is that you can make a shoot 'em upgame, blast at the bad guy, your shot is a sprite, the bad guy is aExamples out of the way, here we are only going to make somesimple sprites. There are books and programs to create sprites.Some of the little programs I have used make the processsimpler than what we will be doing next. For those that have a128. There is a sprite maker in the 40c mode.The book tells us that making a sprite isn't as difficult as they orI make it out to be. Well it is something that you will need to domore than once to get the full feel of making a sprite by scratch.We have a separate picture maker in the C=64 for sprites. "Thispicture maker handles the video display." So says the book. Geeman that sounds so friendly! We are told that the computerhandles the tasks of keeping track of the characters and graphicsand the colour and of moving the object around. Wait for it, getsconfusing real soon.Time for that real soon part then. There are 46 different"ON/OFF" locations "which act like internal memory locations,each of these locations breaks down into a series of 8 blocks.And each block can be either 'on' or 'off'."A lot of members just tossed the book to the side at that point.The book stopped being friendly and got complicated. Beforeyou blank out . Take that stuff and put it off to the side for agood amount of time. What we are going to do is poke thingsinto these areas to make stuff happen. On screen again I repeatthat there are programs that take a lot of this work out of the taskof making sprites.Eight memory locations are used. Tell you now that you haveonly 8 sprites at a time "ACTIVE" on the screen. You can havemore waiting to be used though.You may want to make a grid chart here to help you draw outyour sprites. A sprite is 24 dots wide and 21 dots (or pixels) tall."Sprites are displayed in a special independent 320 dot wide by200 dot high area. However you can use your sprite with anymode high-resolution, low resolution, text, etc." And I knowthat makes very little, or no sense at this moment.What is going to happen is that we are going to make a ballooncharacter, and have it float across the screen. We will also beIssue 24 November 2008 Page 18
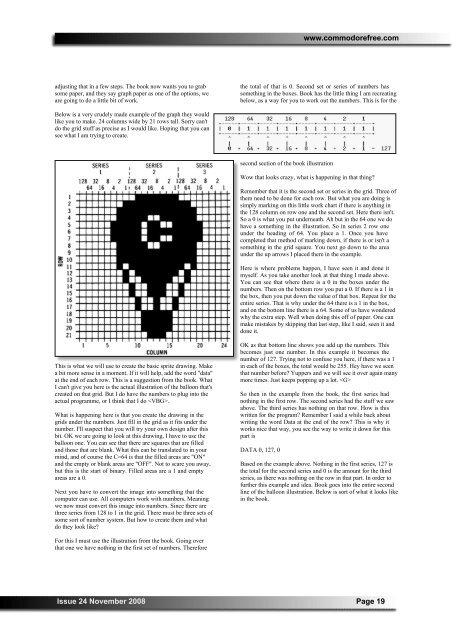
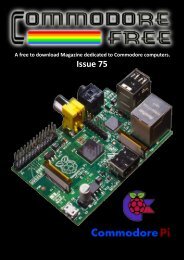
www.commodorefree.comadjusting that in a few steps. The book now wants you to grabsome paper, and they say graph paper as one of the options, weare going to do a little bit of work.the total of that is 0. Second set or series of numbers hassomething in the boxes. Book has the little thing I am recreatingbelow, as a way for you to work out the numbers. This is for theBelow is a very crudely made example of the graph they wouldlike you to make. 24 columns wide by 21 rows tall. Sorry can'tdo the grid stuff as precise as I would like. Hoping that you cansee what I am trying to create.second section of the book illustrationWow that looks crazy, what is happening in that thing?Remember that it is the second set or series in the grid. Three ofthem need to be done for each row. But what you are doing issimply marking on this little work chart if there is anything inthe 128 column on row one and the second set. Here there isn't.So a 0 is what you put underneath. Ah but in the 64 one we dohave a something in the illustration. So in series 2 row oneunder the heading of 64. You place a 1. Once you havecompleted that method of marking down, if there is or isn't asomething in the grid square. You next go down to the areaunder the up arrows I placed there in the example.Here is where problems happen, I have seen it and done itmyself. As you take another look at that thing I made above.You can see that where there is a 0 in the boxes under thenumbers. Then on the bottom row you put a 0. If there is a 1 inthe box, then you put down the value of that box. Repeat for theentire series. That is why under the 64 there is a 1 in the box,and on the bottom line there is a 64. Some of us have wonderedwhy the extra step. Well when doing this off of paper. One canmake mistakes by skipping that last step, like I said, seen it anddone it.This is what we will use to create the basic sprite drawing. Makea bit more sense in a moment. If it will help, add the word "data"at the end of each row. This is a suggestion from the book. WhatI can't give you here is the actual illustration of the balloon that'screated on that grid. But I do have the numbers to plug into theactual programme, or I think that I do .What is happening here is that you create the drawing in thegrids under the numbers. Just fill in the grid as it fits under thenumber. I'll suspect that you will try your own design after thisbit. OK we are going to look at this drawing, I have to use theballoon one. You can see that there are squares that are filledand those that are blank. What this can be translated to in yourmind, and of course the C=64 is that the filled areas are "ON"and the empty or blank areas are "OFF". Not to scare you away,but this is the start of binary. Filled areas are a 1 and emptyareas are a 0.Next you have to convert the image into something that thecomputer can use. All computers work with numbers. Meaningwe now must convert this image into numbers. Since there arethree series from 128 to 1 in the grid. There must be three sets ofsome sort of number system. But how to create them and whatdo they look like?OK as that bottom line shows you add up the numbers. Thisbecomes just one number. In this example it becomes thenumber of 127. Trying not to confuse you here, if there was a 1in each of the boxes, the total would be 255. Hey have we seenthat number before? Yuppers and we will see it over again manymore times. Just keeps popping up a lot. So then in the example from the book, the first series hadnothing in the first row. The second series had the stuff we sawabove. The third series has nothing on that row. How is thiswritten for the program? Remember I said a while back aboutwriting the word Data at the end of the row? This is why itworks nice that way, you see the way to write it down for thispart isDATA 0, 127, 0Based on the example above. Nothing in the first series, 127 isthe total for the second series and 0 is the amount for the thirdseries, as there was nothing on the row in that part. In order tofurther this example and idea. Book goes into the entire secondline of the balloon illustration. Below is sort of what it looks likein the book.For this I must use the illustration from the book. Going overthat one we have nothing in the first set of numbers. ThereforeIssue 24 November 2008 Page 19