A Guide to F-Scale Damage Assessment - Warning Decision ...
A Guide to F-Scale Damage Assessment - Warning Decision ...
A Guide to F-Scale Damage Assessment - Warning Decision ...

Create successful ePaper yourself
Turn your PDF publications into a flip-book with our unique Google optimized e-Paper software.
A <strong>Guide</strong> <strong>to</strong> F-<strong>Scale</strong> <strong>Damage</strong> <strong>Assessment</strong><br />
U.S. DEPARTMENT OF COMMERCE<br />
National Oceanic and Atmospheric Administration<br />
National Weather Service<br />
Silver Spring, Maryland
Cover Pho<strong>to</strong>: <strong>Damage</strong> from the violent <strong>to</strong>rnado that struck the Oklahoma City,<br />
Oklahoma metropolitan area on 3 May 1999 (Federal Emergency Management Agency<br />
[FEMA] pho<strong>to</strong>graph by C. Doswell)<br />
NOTE: All images identified in this work as being copyrighted (with the copyright<br />
symbol “©”) are not <strong>to</strong> be reproduced in any form whatsoever without the expressed<br />
consent of the copyright holders. Federal Law provides copyright protection of these<br />
images.
A <strong>Guide</strong> <strong>to</strong> F-<strong>Scale</strong> <strong>Damage</strong> <strong>Assessment</strong><br />
April 2003<br />
U.S. DEPARTMENT OF COMMERCE<br />
Donald L. Evans, Secretary<br />
National Oceanic and Atmospheric Administration<br />
Vice Admiral Conrad C. Lautenbacher, Jr., Administra<strong>to</strong>r<br />
National Weather Service<br />
John J. Kelly, Jr., Assistant Administra<strong>to</strong>r
Preface<br />
Recent <strong>to</strong>rnado events have highlighted the need for a definitive F-scale<br />
assessment guide <strong>to</strong> assist our field personnel in conducting reliable post-s<strong>to</strong>rm damage<br />
assessments and determine the magnitude of extreme wind events. This guide has been<br />
prepared as a contribution <strong>to</strong> our ongoing effort <strong>to</strong> improve our personnel’s training in<br />
post-s<strong>to</strong>rm damage assessment techniques.<br />
My gratitude is expressed <strong>to</strong> Dr. Charles A. Doswell III (President, Doswell<br />
Scientific Consulting) who served as the main author in preparing this document. Special<br />
thanks are also awarded <strong>to</strong> Dr. Greg Forbes (Severe Weather Expert, The Weather<br />
Channel), Tim Marshall (Engineer/ Meteorologist, Haag Engineering Co.), Bill Bunting<br />
(Meteorologist-In-Charge, NWS Dallas/Fort Worth, TX), Brian Smith (<strong>Warning</strong><br />
Coordination Meteorologist, NWS Omaha, NE), Don Burgess (Meteorologist, National<br />
Severe S<strong>to</strong>rms Labora<strong>to</strong>ry), and Stephan C. Kuhl (National <strong>Warning</strong> Coordination<br />
Meteorologist Program Manager, NWS Headquarters, Silver Spring, MD) for their<br />
technical review of this manuscript. Thanks also <strong>to</strong> Neal Rasmussen, Jim Williams, Tim<br />
Marshall, and Dr. Joe Golden (Forecast Systems Labora<strong>to</strong>ry) for allowing the use of their<br />
pho<strong>to</strong>graphs within this guide. Dr. Harold E. Brooks (National Severe S<strong>to</strong>rms<br />
Labora<strong>to</strong>ry) generously provided data for some of the figures used.<br />
I am confident that every one of our field personnel who are charged with<br />
assessing post-s<strong>to</strong>rm damage <strong>to</strong> determine final wind s<strong>to</strong>rm intensity will find this guide<br />
both useful and beneficial.<br />
Gregory A. Mandt<br />
Direc<strong>to</strong>r, NWS Office of Climate,<br />
Water, and Weather Services<br />
April 2003<br />
ii
Table of Contents<br />
iii<br />
Page<br />
Title Page ...........................................................................................................................i<br />
Preface...............................................................................................................................ii<br />
Table of Contents.............................................................................................................iii<br />
I. The Fujita scale of <strong>to</strong>rnado intensity ........................................................................1<br />
A. A short his<strong>to</strong>ry.................................................................................................1<br />
B. <strong>Damage</strong> and intensity (windspeed) .................................................................5<br />
1. A nonlinear relationship.......................................................................5<br />
2. Variable resistance issues.....................................................................8<br />
3. How structural damage occurs...........................................................10<br />
a. Wind loading ...........................................................................10<br />
i. Lift forces.....................................................................11<br />
ii. Horizontal forces .........................................................12<br />
b. Projectile impacts and the envelope and pressurization..........13<br />
c. Failure points and damage propagation...................................14<br />
4. Duration of strong winds ...................................................................15<br />
5. Windspeed variations .........................................................................16<br />
a. Subvortices ..............................................................................16<br />
b. Satellite vortices ......................................................................20<br />
c. Boundary layer effects.............................................................21<br />
d. Tornado families......................................................................21<br />
e. Downburst winds in supercells................................................22<br />
f. Size, appearance, and intensity relationships...........................24<br />
g. Other vortices ..........................................................................26<br />
C. Problems on the high end of the scale ...........................................................28<br />
1. F3 or F4?............................................................................................28<br />
2. F4 or F5?............................................................................................30<br />
3. Nearby damage ..................................................................................32<br />
4. Projectiles...........................................................................................32<br />
5. <strong>Damage</strong> <strong>to</strong> vegetation.........................................................................34<br />
6. “Scouring” of pavement.....................................................................35<br />
D. Problems on the low end of the scale............................................................36<br />
1. Tornado or downburst? ......................................................................36<br />
a. Evidence of rotation? ...............................................................36<br />
b. Debris fall direction.................................................................37<br />
c. S<strong>to</strong>rm sounds ...........................................................................39<br />
d. Radar signatures ......................................................................40<br />
2. What is a <strong>to</strong>rnado?..............................................................................42<br />
3. Skipping and gaps in the path............................................................43<br />
a. Spatial and temporal variations in wind ..................................44<br />
b. Surface boundary layer character ............................................44<br />
4. Complex <strong>to</strong>rnado tracks ......................................................................45
E. Issues that will arise.......................................................................................46<br />
1. Public reaction <strong>to</strong> damage ..................................................................46<br />
2. Media seeking an “instant analysis”..................................................46<br />
II. Putting <strong>to</strong>gether a survey team..............................................................................46<br />
A. Prior preparation and fast response...............................................................46<br />
B. Team capabilities...........................................................................................48<br />
C. Tools ..............................................................................................................49<br />
1. Equipment ..........................................................................................49<br />
a. Recording media......................................................................49<br />
b. Proper footwear.......................................................................50<br />
c. Headgear ..................................................................................50<br />
d. Local maps...............................................................................50<br />
e. Other gear ................................................................................51<br />
f. Communication........................................................................52<br />
2. Credentials .........................................................................................52<br />
3. Potential aerial survey opportunities..................................................52<br />
D. Planning the survey.......................................................................................53<br />
1. Multiple team coordination................................................................53<br />
2. Priorities.............................................................................................54<br />
3. Comprehensive coverage ...................................................................54<br />
4. Coordination.......................................................................................55<br />
a. Other survey teams ..................................................................55<br />
b. Law enforcement .....................................................................56<br />
c. Emergency responders.............................................................56<br />
E. Safety.............................................................................................................56<br />
1. On the ground.....................................................................................56<br />
2. In the air .............................................................................................57<br />
F. Courtesy.........................................................................................................58<br />
1. Interacting with victims .....................................................................58<br />
a. Sensitivity <strong>to</strong> their situation.....................................................58<br />
b. Rendering aid...........................................................................58<br />
2. Interacting with law enforcement ......................................................59<br />
3. Interacting with the media .................................................................59<br />
III. Evaluating the situation........................................................................................59<br />
A. Arriving at an F-scale....................................................................................59<br />
B. Mapping the damage .....................................................................................62<br />
C. Establishing the temporal sequence of events...............................................64<br />
IV. The importance of accurate assessment ..............................................................65<br />
Appendix A. Wind <strong>Damage</strong> <strong>to</strong> Residences <strong>Assessment</strong> Form .................................67<br />
Appendix B. Illustrations for Frame Home <strong>Damage</strong><br />
<strong>Assessment</strong> Checklist...................................................................................................69<br />
iv
Appendix C. Procedure for Assessing Wind <strong>Damage</strong> <strong>to</strong> Wood<br />
Framed Residences .....................................................................................................73<br />
Appendix D. Equipment Checklists ...........................................................................89<br />
Appendix E. Aerial Survey Operation Strategy........................................................90<br />
References......................................................................................................................92<br />
v
A <strong>Guide</strong> <strong>to</strong> F-<strong>Scale</strong> <strong>Damage</strong> <strong>Assessment</strong><br />
I. The Fujita scale of <strong>to</strong>rnado intensity<br />
A. A short his<strong>to</strong>ry<br />
Prior <strong>to</strong> the adoption of T. Theodore Fujita’s <strong>to</strong>rnado intensity rating scale by the<br />
National Weather Service (NWS), there was no formal way <strong>to</strong> attempt <strong>to</strong> differentiate one<br />
<strong>to</strong>rnado from another. With the interest and support of Allen Pearson, then Direc<strong>to</strong>r of<br />
the National Severe S<strong>to</strong>rms Forecast Center, the Fujita scale became the standard for<br />
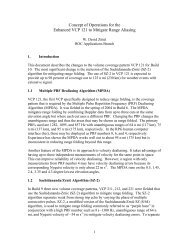
estimating the intensity of <strong>to</strong>rnadoes in the mid-1970s. Fujita originally envisioned this<br />
scale as a way <strong>to</strong> connect the Beaufort wind scale with the Mach speed scale (where<br />
Mach 1.0 is the speed of sound).<br />
Figure 1. Illustration of the relationship of the Fujita scale as a connection between the Beaufort and Mach<br />
scales (Fujita 1987).<br />
Dividing the difference between Beaufort force 12 (73 mph) and Mach 1.0 in<strong>to</strong> 12<br />
increments 1 (Fig. 1), the resulting scale for <strong>to</strong>rnadic windspeeds became the now wellknown<br />
Fujita scale:<br />
1 The reason for the choice of 12 increments has never been made clear. It might have<br />
been related <strong>to</strong> the fact that the Beaufort scale has 12 increments.<br />
1
F-<strong>Scale</strong> Windspeed<br />
(mph)<br />
2<br />
<strong>Damage</strong> description<br />
F0 40-72 Some damage <strong>to</strong> chimneys and TV antennae; breaks twigs off trees, pushes<br />
over shallow-rooted trees<br />
F1 73-112 Peels surfaces off roofs; windows broken; light trailer houses pushed over<br />
or overturned; some trees uprooted or snapped; moving au<strong>to</strong>mobiles<br />
pushed off road<br />
F2 113-157 Roofs <strong>to</strong>rn off frame houses leaving strong upright walls; weak buildings<br />
in rural areas demolished; trailer houses destroyed; large trees snapped or<br />
uprooted; railroad boxcars pushed over; light object missiles generated;<br />
cars blown off highway<br />
F3 158-206 Roofs and some walls <strong>to</strong>rn off frame houses; some rural building<br />
completely demolished; trains overturned; steel-framed hangar-warehouse<br />
type structures <strong>to</strong>rn; cars lifted off the ground; most trees in a forest<br />
uprooted, snapped, or leveled<br />
F4 207-260 Whole frame houses leveled, leaving piles of debris; steel structures badly<br />
damaged; trees debarked by small flying debris; cars and trains thrown<br />
some distance or rolled considerable distances; large missiles generated<br />
F5 261-318 Whole frame houses <strong>to</strong>ssed off foundations; steel-reinforced concrete<br />
structures badly damaged; au<strong>to</strong>mobile -sized missiles generated; incredible<br />
phenomena can occur<br />
Table 1. The Fujita scale of windspeeds, as originally formulated (Fujita 1971).<br />
Fujita added the F0 category <strong>to</strong> include the possibility of a <strong>to</strong>rnado with marginally weak<br />
winds, perhaps even below the threshold normally considered <strong>to</strong> be “severe” by the NWS<br />
(50 kt or 58 mph).<br />
Fujita (1971) specifically defined his “wind” as being measured as the “fastest 1/4<br />
mile” whereas standard “surface” winds are defined as the “fastest mile” – at 60 mph, this<br />
corresponds <strong>to</strong> a 1 min average. At 200 mph, the fastest 1/4 mile windspeed corresponds<br />
<strong>to</strong> a 4 s average value. Although the height of the measurement is not specifically<br />
mentioned, Fujita’s intent with the F-scale was <strong>to</strong> be compatible <strong>to</strong> what an anemometer<br />
would measure (if it could withstand the winds!), so presumably the height above the<br />
surface is that of a standard anemometer (10 m).<br />
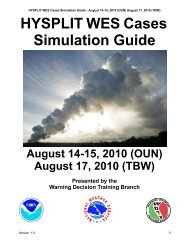
Along with this windspeed scale, Fujita included a description of the damage<br />
associated with each category – those in Table 1 are taken from the original reference<br />
(Fujita 1971). In addition, Fujita used a set of damage pho<strong>to</strong>graphs (Fig. 2) <strong>to</strong> illustrate<br />
the intensity categories. With the introduction of these materials, it became possible for<br />
someone surveying the damage from a <strong>to</strong>rnado <strong>to</strong> estimate the F-scale (implying an<br />
estimate of the range of windspeeds). Further, using newspaper accounts and<br />
pho<strong>to</strong>graphs, it became possible <strong>to</strong> assign an F-scale <strong>to</strong> his<strong>to</strong>rical events, a project which<br />
was undertaken by the National Severe S<strong>to</strong>rms Forecast Center (NSSFC), with the<br />
support of the Nuclear Regula<strong>to</strong>ry Agency in 1976. Students were hired <strong>to</strong> do the<br />
necessary research in<strong>to</strong> old newspapers and other accounts of s<strong>to</strong>rms. They assigned an<br />
F-scale rating <strong>to</strong> as many his<strong>to</strong>rical events as possible based mostly on newspaper<br />
accounts and pho<strong>to</strong>graphs.
Figure 2. Pho<strong>to</strong>graphs of damage associated with F-scale categories taken from the Lubbock <strong>to</strong>rnado of 11<br />
May 1970 (Fujita 1971); no picture was originally provided for F0 damage.<br />
In 1973, the official authority for doing S<strong>to</strong>rm Data passed from the state<br />
clima<strong>to</strong>logists <strong>to</strong> the NWS offices. From the late 1970s <strong>to</strong> the present, it has been<br />
expected that all <strong>to</strong>rnadoes that become part of the S<strong>to</strong>rm Data record will have an Fscale<br />
number assigned <strong>to</strong> them, as well as estimates of the path length and width.<br />
In actual practice, the rating of <strong>to</strong>rnado intensity is necessarily done by assessing<br />
the damage, rather than by windspeed estimates, whatever the original intent of the Fscale<br />
might have been. Given that <strong>to</strong>rnadic windspeeds cannot be measured routinely,<br />
the only way <strong>to</strong> estimate <strong>to</strong>rnado intensity for most reported events is <strong>to</strong> infer the<br />
windspeed from the damage. However, as discussed below, the relationship between<br />
windspeed and damage is not a simple one. With the involvement of structural engineers,<br />
it has become possible <strong>to</strong> use their knowledge of structural integrity and how structures<br />
react <strong>to</strong> the stress imposed by winds<strong>to</strong>rms (e.g., <strong>to</strong>rnadoes) <strong>to</strong> validate the damagewindspeed<br />
relationship assumed by the Fujita scale. Since Fujita’s windspeed-damage<br />
relationship is essentially uncalibrated, engineers have questioned the windspeeds<br />
associated with the F-scale categories (e.g., Minor et al. 1977, Phan and Simiu 2002).<br />
3
Moreover, the actual application of the Fujita scale has been complicated by the<br />
frequent absence of “standard” structures by which the intensity could be estimated.<br />
When a <strong>to</strong>rnado passes through open country (or through vegetation for which no reliable<br />
standards exist) during some or all of its path, there is no obvious way <strong>to</strong> apply the<br />
standards developed by Fujita’s work for those segments of the path. Therefore, it<br />
becomes challenging <strong>to</strong> know what the windspeeds were. Further, the F-scale estimate<br />
applies <strong>to</strong> the entire event, whereas the rating is based on what might only be a single<br />
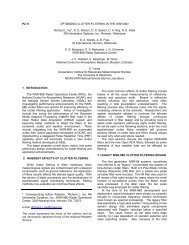
point of the worst damage. Of course, Fujita recognized that a <strong>to</strong>rnado damage path can<br />
be complex in terms of the variation in damage along it (Fig. 3)<br />
Figure 3. Sample of F-scale mapping in Xenia, OH, along a <strong>to</strong>rnado damage path on 3 April 1974,<br />
showing complex debris patterns (after Fujita 1992).<br />
The most intense damage usually is only a small portion of the whole damage swath. For<br />
example, Speheger et al. (2002) found that the F5 damage area in the major <strong>to</strong>rnado that<br />
hit the metropolitan area of Oklahoma City, Oklahoma, was only 1.7% of the <strong>to</strong>tal<br />
damage path area.<br />
Even as this is being written, the Fujita scale is under review by meteorologists<br />
and engineers, and its implied relationship between damage and windspeed is the object<br />
of considerable scrutiny. Alternative rating criteria are being reviewed and it is likely<br />
that in the future, a new scheme will be developed <strong>to</strong> replace the existing one. Whatever<br />
that scheme turns out <strong>to</strong> be, the same challenges discussed in what follows will be present<br />
for those doing s<strong>to</strong>rm damage surveys <strong>to</strong> assess the type of s<strong>to</strong>rm and its intensity after<br />
the event.<br />
4
B. <strong>Damage</strong> and intensity (windspeed)<br />
1. A nonlinear relationship<br />
Clearly, damage and windspeed must be related. For each individual structural<br />
element, 2 there is a “threshold” windspeed that will cause that element <strong>to</strong> fail. Actually,<br />
the failure of a particular structural element is not at a fixed windspeed, for a host of<br />
reasons: for example, each structural element is not exactly identical in all its details <strong>to</strong><br />
every other similar structural element. Therefore the probability of failure for a class of<br />
similar structural elements might look something like Fig. 4:<br />
Figure 4. Schematic illustration of the probability of failure of a type of structural ele ment as the<br />
windspeed increases.<br />
For this simple example, there is a range of windspeeds from about 85 mph <strong>to</strong> 115 mph<br />
over which the failure point can range, such that the likelihood of failure below 85 mph is<br />
essentially negligible, whereas above 115 mph, failure is virtually certain.<br />
Since it is unlikely we would ever know the details of this for every structural<br />
element in a damage zone, we can not know at precisely what windspeed a given failure<br />
occurred. In effect, for a given structural failure, there is a range of windspeeds<br />
associated with the damage that might look something like Fig. 5. The Fujita scale also<br />
gives a range of values for a particular item of observed damage, but it has “hard”<br />
boundaries. For example, according <strong>to</strong> Table 1, a 157 mph windspeed produces F2-type<br />
damage, whereas a 158 mph windspeed produces F3-type damage. This is, of course, not<br />
a plausible way <strong>to</strong> interpret damage. The challenge is that a given damage observation<br />
might well be produced by a range of windspeeds that could encompass two or more Fscale<br />
categories.<br />
As if this isn’t enough of a problem, consider that a <strong>to</strong>rnado’s windspeeds are<br />
constantly fluctuating in time and in space. Idealized models of a <strong>to</strong>rnado envision a<br />
2 A structural element is defined <strong>to</strong> be either a connection between one part of a structure<br />
and another, or an individual component part of that structure.<br />
5
windspeed distribution like Fig. 6, relative <strong>to</strong> the <strong>to</strong>rnado’s axis of rotation, but reality<br />
surely is far more complex.<br />
Figure 5. Schematic illustration of the probability that a particular damage event was produced by wind of<br />
a given value – the <strong>to</strong>tal area under the curve has a probability of 1.0. This distribution is symmetric about<br />
the most probable value and has only one peak probability, but in real examples, the distribution might not<br />
be so simple.<br />
Figure 6. Radial wind profile in an idealized Rankine Combined Vortex Model, having a radius of<br />
maximum winds at a distance of about 30 units from the axis. Speed and distance units are arbitrary.<br />
We already know that a <strong>to</strong>rnado’s speed of motion makes the windspeeds asymmetric<br />
about the axis, adding <strong>to</strong> the wind on the right side of the path of a cyclonic vortex (in the<br />
Northern Hemisphere) and subtracting from the wind on the left side. Moreover, there<br />
are almost sure <strong>to</strong> be many complexities beyond this, including the presence of multiple<br />
vortices. In any given <strong>to</strong>rnado, it is likely that windspeed generally decreases with<br />
distance from the radius of maximum winds, but apart from that general statement, the<br />
true wind speed structure at any given instant is likely <strong>to</strong> be rather far from simple,<br />
idealized models. Add <strong>to</strong> this that the spatial structure of the windfield will change<br />
rapidly with time, and the overall picture of a <strong>to</strong>rnado’s windfield can be exceedingly<br />
6
complicated. This can be unders<strong>to</strong>od simply by watching <strong>to</strong>rnado video and film footage,<br />
but since air is transparent, even such video cannot show all that is going on.<br />
It also is known that the windspeed varies with height. In principle, the<br />
windspeed goes <strong>to</strong> zero right down at the surface, but even a few inches above the<br />
surface, it surely is not zero. Friction in the surface boundary layer generally acts <strong>to</strong><br />
reduce windspeeds (see §I.B.5.c), and therefore the maximum windspeeds anywhere in a<br />
<strong>to</strong>rnado are at some height above the surface (of order tens of meters), but the height of<br />
maximum winds is certainly not likely <strong>to</strong> be fixed in space and time – no doubt there are<br />
multiple maxima in the <strong>to</strong>rnadic wind field from moment <strong>to</strong> moment. Depending on the<br />
“roughness” of the surface, the windspeeds (in the layer where structures and vegetation<br />
are found) will depend <strong>to</strong> some extent on the nature and distribution of structures and<br />
vegetation encountered along the path. The windspeeds within the surface boundary<br />
layer of a <strong>to</strong>rnado passing over a grassy field are likely <strong>to</strong> be greater than those of one<br />
passing through tall trees and buildings. The energy of the wind in the latter situation<br />
will be reduced by the added friction and by the energy lost in causing damage <strong>to</strong> those<br />
structures and vegetation.<br />
Figure. 7. Example of a strange effect caused by the Union City, OK, <strong>to</strong>rnado of 24 May 1973. It is<br />
difficult <strong>to</strong> imagine how the wind accomplished this feat (Pho<strong>to</strong>graph © courtesy of C. Doswell, used by<br />
permission).<br />
Near the surface, not only are the horizontal winds strong and highly variable in<br />
space and time, but so are the vertical winds. One of the reasons that the horizontal<br />
windspeed increases with height above the surface is that the pressure deficit associated<br />
7
with the vortex is largest somewhere above the surface. This intense decrease of pressure<br />
with height drives a powerful acceleration of the vertical wind, as well. This acceleration<br />
can exceed one full gravity [g = 9.8 m s -2 ], which is sufficient <strong>to</strong> propel objects upward<br />
in<strong>to</strong> the strong rotating winds aloft, and is accompanied by a powerful inflow very near<br />
the surface. That inflow may or may not be roughly symmetric – apparently, in some<br />
<strong>to</strong>rnadoes it can be concentrated within one or more narrow inflow bands that spiral in<strong>to</strong><br />
the <strong>to</strong>rnado instead of flowing inward from all directions.<br />
As complex winds interact with structures and vegetation, additional complexities<br />
will be induced in<strong>to</strong> the wind field (flow around solid obstacles creates “turbulent<br />
eddies”, and so on). The interaction between the winds and objects embedded in that<br />
wind flow is usually quite complicated, often leading <strong>to</strong> strange effects, such as shown in<br />
Fig. 7. Nevertheless, neither the wind nor the associated damage is entirely random.<br />
Therefore, a proper description of the windfield along a <strong>to</strong>rnado’s damage path in a<br />
populated area is not that it is “chaotic” but that it may be challenging at times <strong>to</strong> infer the<br />
windspeed from the observed effects.<br />
2. Variable resistance issues<br />
In addition <strong>to</strong> variations in damage caused by variations in the windspeed, it is<br />
clear that the resistance of structures and vegetation <strong>to</strong> failure caused by winds also<br />
varies. In fact, as described in §I.B.1, the resistance can be thought of in terms of a<br />
probability distribution – any particular example is most likely <strong>to</strong> fail at the peak of that<br />
distribution, but that does not preclude the possibility of failure at a higher or lower<br />
windspeed than the peak of the distribution. If all the homes in a certain area were built<br />
according <strong>to</strong> the same standards, variations in damage will typically be observed from<br />
one home <strong>to</strong> another, even though they were all built in some standard way. Not all of<br />
this observed variability can be attributed <strong>to</strong> fluctuations in the wind. It usually is the<br />
case that individual homes, even in the same neighborhood, are built differently,<br />
introducing additional variations in resistance <strong>to</strong> the wind. Building codes, when in<br />
force, only provide minimum community standards. In general, homes built by different<br />
builders will have their own underlying probability distributions in terms of resistance.<br />
Furthermore, methods of frame home construction differ from one geographic<br />
region <strong>to</strong> another, partly because of variations in the building codes and partly because<br />
methods of construction are just not uniform, owing <strong>to</strong> such things as regional soil types,<br />
climatic variations, cultural preferences, and so on. Different regional construction<br />
practices can be thought of as altering the underlying probability distributions. This also<br />
is a source of variability in resistance. Even the orientation of objects <strong>to</strong> the damaging<br />
winds can influence their resistance. The Fujita scale assumes (but does not define) a<br />
“well-constructed frame home” as the standard for judging the windspeeds needed <strong>to</strong><br />
produce the observed damage. Anything that reduces the resistance of the home <strong>to</strong> windinduced<br />
damage below that standard can reduce the F-scale rating.<br />
A critical notion in the understanding of frame home construction is that of the<br />
load path. This is an engineering term for the path by which the weight of the building is<br />
transferred downward <strong>to</strong> the ground. A schematic illustration of the load path is shown in<br />
Fig. 8. The design of such a structure is intended primarily <strong>to</strong> deal with the loads imposed<br />
by the weight of the building. As we will see in the next section, the stresses imposed by<br />
8
interaction with a <strong>to</strong>rnado (or other strong winds) are very different from this, and the<br />
method of construction has a large impact on the ability of the structure <strong>to</strong> resist <strong>to</strong>rnadic<br />
winds.<br />
There are many different types of structures with which a <strong>to</strong>rnado might interact<br />
during its life. Although building codes exist in most metropolitan areas of the United<br />
States, they are primarily in force only in metropolitan areas – rural homes may or may<br />
not be built <strong>to</strong> some code. Building codes can vary from one community <strong>to</strong> the next, so<br />
knowledge of any relevant building codes is important in assessing s<strong>to</strong>rm damage. As<br />
Figure 8. Schematic illustration of the load path for a single-s<strong>to</strong>ry, wood-frame home, with arrows<br />
showing the transfer of the gravity load from the roof <strong>to</strong> the ground. Circles indicate locations for securing<br />
attachments (see BPAT [1999] for details).<br />
noted earlier, building codes specify minimum standards. When meeting codes is the<br />
goal, actual construction practices can fall short of the codes. 3 It also may be the case<br />
that one part of a code conflicts with another. For example, one part of a building code<br />
might require meeting some general engineering standard (i.e., able <strong>to</strong> resist a specified<br />
3 It can be argued that a proper strategy <strong>to</strong> ensure that construction meets codes is <strong>to</strong> set a<br />
goal that will exceed the code requirements.<br />
9
windspeed value), whereas another part of the same code could mandate a particular<br />
construction practice that would make it impossible <strong>to</strong> meet the previous standard. Of<br />
course, code enforcement can also be a problem.<br />
Most of the codes have a windspeed threshold specified, and it is expected that a<br />
structure built <strong>to</strong> that code would have essentially no structural damage if the windspeeds<br />
don’t exceed that threshold. This does not exclude other forms of damage: windows<br />
broken, projectile impacts, loss of non-structural elements, etc. Major structural damage<br />
can occur when trees or other large objects fall on the structure, but this would not imply<br />
that the threshold windspeed was exceeded.<br />
Code violations can and do occur, as shown in numerous post-event surveys.<br />
Generally, communities have periodic code inspections during the process of home<br />
construction, but given limited personnel and resources, code enforcement can be<br />
variably rigorous. Exceptions and waivers <strong>to</strong> building code criteria are granted in some<br />
instances, at the request of builders, and these exceptions can result in reduced resistance<br />
<strong>to</strong> <strong>to</strong>rnadic wind damage.<br />
3. How structural damage occurs<br />
In what follows, some considerable discussion of the processes by which damage<br />
<strong>to</strong> structures occurs is provided <strong>to</strong> facilitate recognition of structural failures during field<br />
surveys. The debris from a <strong>to</strong>rnado might first seem <strong>to</strong> be chaotic, but it is possible <strong>to</strong><br />
recognize key features in the damage that will reveal how the damage occurred, and this<br />
can give considerable insight about the range of windspeeds needed <strong>to</strong> create that<br />
damage.<br />
a. Wind loading<br />
First and foremost, it is important <strong>to</strong> remember that a <strong>to</strong>rnado is a wind s<strong>to</strong>rm.<br />
What makes a <strong>to</strong>rnado unique among winds<strong>to</strong>rms is the intense gradients of wind speed<br />
and direction that can be found in most <strong>to</strong>rnadoes. Clearly, a <strong>to</strong>rnado is wind in strong<br />
rotation, but when objects are much smaller than the <strong>to</strong>rnado, that airflow’s rotation is not<br />
generally apparent. The rotation and movement of the s<strong>to</strong>rm mean that structures and<br />
vegetation in the path will typically experience variations in both wind speed and<br />
direction. These variations are important components in understanding what will be<br />
encountered during a survey.<br />
Construction of structures also varies, and the strength of a structure typically<br />
depends on which direction and in what order the forces on it are operating. In ordinary<br />
situations, the weight of a structure is the dominant load on that structure. When the<br />
wind does not exceed the code-mandated threshold windspeeds, the structure should be<br />
able <strong>to</strong> resist those ordinary winds without structural failure. But when a <strong>to</strong>rnado<br />
interacts with structures, the loads are very far from ordinary, and structural failures can<br />
begin. For weak structures, this might be at windspeeds as low as those associated with<br />
F1 on the Fujita scale. As structural integrity increases, it takes increasing windspeeds <strong>to</strong><br />
initiate structural damage.<br />
10
i. Lift forces<br />
A major contribu<strong>to</strong>r <strong>to</strong> damage in <strong>to</strong>rnadoes is the strong vertical acceleration of<br />
the upward motion near the surface, driven by the pressure field of the <strong>to</strong>rnado itself.<br />
This is the “suction” associated with the <strong>to</strong>rnado and its effect is <strong>to</strong> oppose the ordinary<br />
gravity loading of structures. That is, it acts <strong>to</strong> lift objects and structural elements in<strong>to</strong> the<br />
air. Although most construction is designed <strong>to</strong> resist the ordinary effects of the<br />
downward gravity load, its design can be substantially less effective in resisting lift<br />
forces. For example, when wall studs are “ straight nailed” (see Fig. A2.5 in Appendix<br />
2) <strong>to</strong> the sole plate at the bot<strong>to</strong>m of a wall frame (see Fig. 7), the connection does not<br />
resist an upward force very well; the wall studs are relatively easily pulled off the nails<br />
and the wall section is no longer attached <strong>to</strong> the structure.<br />
Attachments all along the load path shown in Fig. 8 are potential weak points in<br />
the structure, and unless the structural integrity has been enhanced <strong>to</strong> increase its<br />
resistance <strong>to</strong> lift forces (see Figs A2.6-A2.8), these attachments are common failure<br />
initiation points. Unfortunately, it only takes one weak point along the load path <strong>to</strong><br />
initiate structural failure. Generally, the wind seeks the weakest link in the chain. A wall<br />
that is not adequately attached <strong>to</strong> the foundation will allow the structure <strong>to</strong> slide off the<br />
foundation, no matter how strong the rest of the load path attachments are. A poor<br />
attachment of the roof allows the roof <strong>to</strong> “sail” off in the wind, and roofs are actually<br />
important in the structural integrity of the walls. When the roof is gone, the walls<br />
Figure 9. Schematic illustration of airflow interacting with a structure, showing the resulting pressure<br />
effects. The “local” effects arise because the increased airflow at corners due <strong>to</strong> the Bernoulli effect.<br />
become “freestanding” and are more easily blown over than when the roof remains in<br />
place. Generally, any initial structural failures tend <strong>to</strong> spread under the forces imposed<br />
by <strong>to</strong>rnadic winds.<br />
11
ii. Horizontal forces<br />
In addition <strong>to</strong> the lift forces associated with the pressure distribution of the<br />
<strong>to</strong>rnado itself, the horizontal wind creates dynamic wind pressure forces. Consider Fig. 9:<br />
the flow of air over a building can create a dynamic pressure deficit wherever the<br />
horizontal wind is being accelerated and a pressure excess wherever the wind is<br />
decelerated. The pressure deficit associated with the acceleration of the wind in<br />
sometimes referred <strong>to</strong> as the Bernoulli effect. As the figure shows, the result is an upward<br />
pressure as the air accelerates over a roof. The horizontal airflow interacting with the<br />
structure can act <strong>to</strong> increase the lift forces being exerted on the roof by the <strong>to</strong>rnado’s<br />
pressure field.<br />
As has been shown, as the wind interacts with a structure, the horizontal wind is<br />
forced <strong>to</strong> decelerate when approaching a wall. This results in a pressure excess that is the<br />
way the wall “feels” the effect of the wind. The faster the wind when it begins <strong>to</strong> interact<br />
with the wall, the stronger the resulting pressure excess. Generally speaking, the pressure<br />
excess increases as the square of the windspeed prior <strong>to</strong> impinging on the wall. Double<br />
the windspeed and the pressure goes up by a fac<strong>to</strong>r of four, not two. This nonlinear<br />
relationship is one of the reasons most people overestimate windspeeds. Their<br />
experience with windspeeds exceeding 60 mph is so infrequent, they just don’t recognize<br />
how rapidly the wind-induced pressure force goes up as the wind increases. They “feel”<br />
the increased pressure and so overestimate the wind producing what they experience.<br />
Structural attachment points are subject <strong>to</strong> failure during the extraordinary winds<br />
produced by <strong>to</strong>rnadoes. A nailed attachment is more resistant <strong>to</strong> shearing forces<br />
(perpendicular <strong>to</strong> the nail) than it is <strong>to</strong> forces acting <strong>to</strong> pull it up. A wall that has been<br />
attached <strong>to</strong> the foundation with powder-driven cut nails (see Fig. A2.4) is much less<br />
resistant <strong>to</strong> those side loads than one where the wall is bolted <strong>to</strong> the foundation with<br />
nuts. 4 Wind-induced side loads act <strong>to</strong> “rotate” the wall inward, which creates forces that<br />
will pull out the nails, as well as shearing forces. Such nail attachments can create a<br />
“dimple” in the foundation when the nail is driven in, so the attachment is virtually<br />
nonexistent at that point. Weak attachments of the walls <strong>to</strong> the foundation allow the<br />
house simply <strong>to</strong> slide off the foundation when experiencing only moderately strong<br />
winds. Once the structure has moved off the foundation, it can collapse under its own<br />
weight – wind stresses will aid in its subsequent disintegration.<br />
When the roof is removed, its loss promotes the failure of the walls, which are<br />
much more prone simply <strong>to</strong> rotate off the foundation in response <strong>to</strong> wind pressure, and<br />
collapse comes when the attachments pull out. As noted, the tilting of the wall means at<br />
least some of the force on the attachment is in the opposite direction as the gravity load –<br />
recall that pull-out is relatively easier than shearing the nail (or bolt). Sometimes, this<br />
can result in the failure of the sill plate itself, while the bolts (or nails) remain in place.<br />
The quality of the lumber used for framing can be an issue in some instances. Loss of the<br />
roof can be a major fac<strong>to</strong>r in wall failure during side loads induced by the wind.<br />
4 A survey team should be alert <strong>to</strong> the fairly common situation where the nuts have not<br />
been put on the bolts, and the sill plate is simply resting on the bolts. Without the nuts,<br />
the attachment of the wall <strong>to</strong> the foundation has virtually no resistance <strong>to</strong> lift forces.<br />
12
. Projectile impacts and the envelope and pressurization<br />
Studies of <strong>to</strong>rnado damage by structural engineers reveal that an important part of<br />
structural integrity is the integrity of the “envelope” of the structure. That is, the walls<br />
and roof create an “envelope” around the interior space that acts <strong>to</strong> deflect the winds<br />
around the structure, rather than in<strong>to</strong> it. Of course, most homes have built-in weak points<br />
<strong>to</strong> their envelope: doors and windows. Glass windows can be broken readily, and doors<br />
may be poorly attached and unable <strong>to</strong> resist wind-induced side loads as well as the walls<br />
can. Adding <strong>to</strong> this potential loss of envelope integrity is the presence of projectiles<br />
(sometimes referred <strong>to</strong> as “missiles”) in the debris generated by the <strong>to</strong>rnado. Even in a<br />
relatively weak <strong>to</strong>rnado, the air can be filled with objects that are sufficient <strong>to</strong> break<br />
windows: s<strong>to</strong>nes, sticks of wood, yard furniture, etc. A 2 x 4 framing stud moving at just<br />
45 m s -1 (100 mph) has sufficient force <strong>to</strong> penetrate ordinary frame walls with standard<br />
interior and exterior sheathing materials quite easily.<br />
Once flying debris punctures the envelope, wind can enter the structure and<br />
“pressurize” interior spaces. In effect, loss of external envelope integrity on the<br />
windward walls allows the home <strong>to</strong> “blow up” like a balloon. This augments any upward<br />
lift forces on the ceilings and roof, and creates outward side loads on all the interior<br />
walls. Recall that the wind is accelerated on those walls <strong>to</strong> the side of a windward wall,<br />
leading <strong>to</strong> pressure deficits on their exteriors. If the windward wall is breached and the<br />
interior is pressurized as a result, the outward side loads become large enough <strong>to</strong><br />
“explode” the remaining structure (Fig. 10). This is the origin of the myth that the<br />
pressure field of the <strong>to</strong>rnado causes structures <strong>to</strong> “explode”. In reality, this apparent<br />
explosion is the result of dynamic pressure induced by the wind of the <strong>to</strong>rnado, not the<br />
<strong>to</strong>rnado’s pressure deficit. Buildings can indeed “explode” but this result is only<br />
indirectly coupled <strong>to</strong> the <strong>to</strong>rnado’s pressure field: that pressure field drives the winds,<br />
which in turn, create the dynamic pressure effect producing outward forces on structures.<br />
Opening windows <strong>to</strong> “relieve” the pressure effect due <strong>to</strong> the <strong>to</strong>rnado just increases the<br />
likelihood of interior pressurization!<br />
Figure 10. Schematic illustration of “pressurization” as impinging wind (black) enters through a puncture<br />
of a building’s envelope, and the resulting pressure forces from both interior pressurization (white) and<br />
exterior airflow (turquoise).<br />
13
c. Failure points and damage propagation<br />
In a moving <strong>to</strong>rnado, a fixed object can experience a rapidly fluctuating wind<br />
field, not just in speed but in direction. This changing wind field can act <strong>to</strong> “seek out”<br />
weak points in a structure. Structural integrity can have a strong directional dependence.<br />
For example, it has been found that garage doors are common weak points. When the<br />
windspeeds increase as a <strong>to</strong>rnado approaches, garage doors facing the wind from an<br />
approaching <strong>to</strong>rnado may be among the first failures. Failure of the garage door<br />
pressurizes the garage and since many garages are attached <strong>to</strong> their houses, the<br />
“explosion” of the garage can initiate failure of components like the roof of the home,<br />
compromising the structural integrity of the house itself. The initial failure of the garage<br />
door can cause the whole structure including the home <strong>to</strong> “unzip” and induce major<br />
structural damage.<br />
The variability of the wind, combined with variations in the strength of a structure<br />
can combine <strong>to</strong> cause failure of the structure at any time during its interaction with the<br />
<strong>to</strong>rnado. The final position and appearance of the debris remaining depends on when<br />
during the interaction the failure began. The complexity of this interaction can easily<br />
explain much of apparent capriciousness of <strong>to</strong>rnado damage (Fig. 10). The particular<br />
sequence of wind speed and direction experienced by a particular structure can result in<br />
its destruction whereas nearby apparently similar structures are un<strong>to</strong>uched (or viceversa).<br />
Figure 11. Path of a <strong>to</strong>rnado in Xenia, OH, on 20 September 2000, showing near <strong>to</strong>tal destruction of one<br />
home (lower left) even as nearby homes have suffered virtually no structural damage. This is unlikely <strong>to</strong> be<br />
the result of extreme winds but is more likely <strong>to</strong> be a structural failure associated with that particular home,<br />
and is complicated by the damage <strong>to</strong> the home across the street, which surely produced many projectiles.<br />
(Pho<strong>to</strong>graph courtesy of J.H. Golden, used by permission).<br />
14
It has been noted already that damage is the result of the interaction of a complex wind<br />
field in space and time with the characteristics of the objects experiencing that wind.<br />
It is also important <strong>to</strong> keep in mind that the debris created by a <strong>to</strong>rnado is also<br />
interacting with objects. When a <strong>to</strong>rnado comes in<strong>to</strong> a community from surrounding<br />
open country, it carries with it less debris than had it been in another community just<br />
before arriving. The character of that debris depends on the windspeed, of course, as well<br />
as the nature of the objects the <strong>to</strong>rnado has just encountered. Further complicating the<br />
issue is that a <strong>to</strong>rnado coming in from open country has been experiencing relatively<br />
small friction in its boundary layer. Structures and large vegetation (trees) can reduce the<br />
near-surface winds by friction. Therefore, a relatively weak <strong>to</strong>rnado entering a<br />
community from open country might do its worst damage early in its track through the<br />
community and then seem <strong>to</strong> weaken. However, a relatively strong <strong>to</strong>rnado would pick<br />
up a debris load as it interacted with structures such that damage could increase as it<br />
tracked farther in<strong>to</strong> the community, even though the intensity of the <strong>to</strong>rnado itself was not<br />
changing.<br />
Failure points on a structure generally will propagate through the structure – the<br />
failure begins at a weak point and spreads from there. In an analogous way, weak<br />
structures can add <strong>to</strong> the debris load of a <strong>to</strong>rnado and cause further damage as projectiles<br />
injected in<strong>to</strong> the airflow hit other structures. Speheger et al. (2002) have suggested that<br />
this can cause “cones of damage” along the track (Fig. 12). 5<br />
Figure 12. Schematic illustration how damage produced by the failure of a weak structure can create<br />
“damage cones” on the periphery of a <strong>to</strong>rnado track (cf. Fig. 3) – from Speheger et al. (2002).<br />
4. Duration of strong winds<br />
The movement of the <strong>to</strong>rnado is also a fac<strong>to</strong>r in the evolution of the wind field at<br />
some point in the path. A fast-moving, small diameter s<strong>to</strong>rm might interact with a given<br />
house for only a few seconds, whereas a slow-moving, large-diameter <strong>to</strong>rnado would<br />
create an interaction of much longer duration. The effects of duration are not completely<br />
5 Similar patterns have been observed in hurricanes. In fact, many of the principles and<br />
practices described herein can be applied <strong>to</strong> hurricane damage surveys.<br />
15
obvious. Some structural failures would be more likely if the interaction was rapid – if<br />
the forces on a structure increase rapidly, they might be more likely <strong>to</strong> create certain<br />
types of failures than if those same forces increased relatively slowly. On the other hand,<br />
the longer the damaging winds of a <strong>to</strong>rnado have <strong>to</strong> work on potential failure points, the<br />
more likely a failure will become. More discussion of this follows later.<br />
5. Windspeed variations<br />
In order <strong>to</strong> be prepared <strong>to</strong> interpret the observations during a survey of s<strong>to</strong>rm<br />
damage, it is obvious that knowledge of how severe thunders<strong>to</strong>rms and <strong>to</strong>rnadoes behave<br />
is essential. Most of this material is available in the references (see, e.g., Davies-Jones<br />
1986; Lewellen 1993; Davies-Jones et al. 2001), but is reviewed briefly here for<br />
completeness.<br />
a. Subvortices<br />
Although an awareness of the possibility of multiple vortices has been present for<br />
a long time, it wasn’t until Fujita connected this phenomenon <strong>to</strong> evidence at the surface<br />
that this awareness became a part of the scientific consensus understanding of <strong>to</strong>rnadoes.<br />
Description of multiple vortex <strong>to</strong>rnadoes by eyewitnesses and even pho<strong>to</strong>graphs (Fig. 13)<br />
Figure 13. Pho<strong>to</strong>graph of a <strong>to</strong>rnado on 20 May 1957 near Ottawa, KS, clearly showing a multiple vortex<br />
structure (Pho<strong>to</strong>graph courtesy of Charles LeMaster, from Doswell and Ostby 1982).<br />
have existed for some time, but research using a labora<strong>to</strong>ry vortex simula<strong>to</strong>r developed<br />
by Ward (1972) and a study by Fujita (1970) of the Lubbock, Texas <strong>to</strong>rnado of 11 May<br />
1970 made it clear that surface damage from <strong>to</strong>rnadoes exhibiting a multiple vortex<br />
structure would be markedly different from those with a single vortex. Since then, the<br />
spread of inexpensive consumer film and video cameras has meant that numerous<br />
multiple vortex <strong>to</strong>rnadoes have been documented.<br />
16
The existence of multiple vortices means that the windspeed distribution in such a<br />
<strong>to</strong>rnado departs considerably from the simple picture (Fig. 5) of a single vortex <strong>to</strong>rnado.<br />
A snapshot of this can be illustrated by the detailed images captured from a mobile<br />
Doppler radar (Fig. 14).<br />
The winds at the surface will involve the combination of four different<br />
contributions:<br />
Figure 14. High resolution images from a mobile Doppler radar of the spectrum width (a – SW) and radial<br />
velocity (b – Vr) fields showing multip le vortices on 3 May 1999. The <strong>to</strong>rnado is approximately 600 m in<br />
diameter (see the discussion in Wurman 2002) and the subvortices are rotating around the core at 50 m s -1 .<br />
(Image courtesy of Josh Wurman, University of Oklahoma).<br />
1. Movement of the <strong>to</strong>rnado as a whole, Co<br />
2. Winds of the parent vortex, Vo<br />
3. Movement of the subvortex around the parent vortex, Cs<br />
4. Winds of the subvortex, Vs<br />
The complexity of this will be manifested in complex damage patterns. The most<br />
obvious of these are the debris streaks that are occasionally evident from aerial<br />
pho<strong>to</strong>graphs (e.g., Fig. 15). Fujita showed that these marks are the result of the<br />
subvortices rotating about their common center, combined with the movement of the<br />
whole <strong>to</strong>rnado (Fig. 16). These subvortices are relatively transient and almost never<br />
make a complete revolution around the <strong>to</strong>rnado. Rather, they tend <strong>to</strong> form and dissipate<br />
in preferred locations relative <strong>to</strong> the moving parent vortex. This results in their leaving<br />
ground marks (typically, lines of accumulated debris) in the form of segments of a<br />
cycloidal curve. Each such streak marks the path of one subvortex. The existence of<br />
these also helps <strong>to</strong> explain many of the complexities of damage within populated areas –<br />
those locations in the path of a subvortex are subjected <strong>to</strong> stronger winds than in nearby<br />
locations that were not in the path of that subvortex.<br />
Theory of such vortices indicates they develop in a region of strong radial shear,<br />
near (but not at) the radius of maximum winds in the main vortex (see e.g., Snow 1978;<br />
Gall 1985; Nolan and Farrell 1999). The cycloidal marks they produce can be related <strong>to</strong><br />
their rotational velocity about the main vortex (Cs, which does not necessarily equal Vo,<br />
17
ut these two velocities are not likely <strong>to</strong> very different), the radius of that rotation, and<br />
the speed of movement of the main vortex (Co), which probably is not <strong>to</strong>o different from<br />
that of the s<strong>to</strong>rm producing the <strong>to</strong>rnado. Unfortunately, the geometry of the marks can’t<br />
be used <strong>to</strong> estimate the rotational speed within each subvortex, Vs. The additional<br />
tangential windspeed of a subvortex could be on the order of 25-50 m s -1 , but there is no<br />
way <strong>to</strong> estimate this from the cycloidal marks.<br />
Figure 15. Example of cycloidal debris marks associated with a multip le-vortex <strong>to</strong>rnado (Fujita 1992).<br />
18
Figure 16. Schematic model of a <strong>to</strong>rnado with multiple subvortices (adapted from Fujita 1971).<br />
Figure 17. Schematic illustration of how debris would be deposited along the path of a subvortex (from<br />
Fujita 1978b), giving rise <strong>to</strong> the notion of a “suction” vortex.<br />
19
Although debris tracks have been associated with individual subvortices of a<br />
parent <strong>to</strong>rnado, a single vortex <strong>to</strong>rnado can also produce them (Davies-Jones et al. 1978;<br />
Speheger et al. 2002). A single vortex <strong>to</strong>rnado often produces a debris deposition trail,<br />
rather than cycloidal “swirl” marks. The deposition results from the radial inflow in the<br />
near-surface flow of a subvortex, as suggested in Fig. 17.<br />
b. Satellite vortices<br />
Figure 18. A satellite vortex (left) on the periphery of the large main <strong>to</strong>rnado (center) near Chickasha, OK,<br />
on 3 May 1999 (Pho<strong>to</strong>graph © courtesy of N. Rasmussen, used by permission).<br />
Multiple vortices are well known by now, but “satellite” vortices are relatively<br />
newly documented. It appears that within mesocyclone-associated <strong>to</strong>rnadic s<strong>to</strong>rms, it is<br />
quite possible <strong>to</strong> have what are called “satellite” vortices (e.g., Fig. 18). The existence of<br />
these has been suspected from the damage revealed occasionally in detailed damage<br />
surveys, but had not been documented until recently. Like multiple vortex <strong>to</strong>rnadoes, the<br />
spread of inexpensive consumer video cameras and s<strong>to</strong>rm chasing has given us<br />
indisputable evidence of their existence. Satellite vortices may be more common that<br />
suspected – at times, the vortex might not have such an obvious funnel cloud as shown in<br />
Fig. 18. That is, there can be a damage swath from a satellite vortex without a visible<br />
funnel cloud.<br />
As with multiple vortex <strong>to</strong>rnadoes, any survey team should be alert <strong>to</strong> the<br />
possibility of these satellite vortices. They are associated with the mesocyclonic<br />
circulation producing the main <strong>to</strong>rnado and typically rotate around such <strong>to</strong>rnadoes. These<br />
satellite vortices are distinct from the series of <strong>to</strong>rnadoes that can be produced by a cyclic<br />
supercell s<strong>to</strong>rm, described below.<br />
20
c. Boundary layer effects<br />
Although friction inevitably reduces windspeeds, changes in the surface<br />
roughness can have unexpected consequences on a <strong>to</strong>rnado. Above the boundary layer,<br />
the winds in a <strong>to</strong>rnado approach a state of “cyclostrophic balance” where the inertial<br />
force (sometimes referred <strong>to</strong> as “centrifugal” force) is in approximate balance with the<br />
pressure gradient force. Cyclostrophic flow implies a small radial component, so the<br />
flow is nearly circular. In the boundary layer, however, friction acts <strong>to</strong> reduce the<br />
tangential windspeed. This reduction in windspeed causes the air <strong>to</strong> spiral inward<br />
because the inward-directed pressure gradient force is not affected by friction. But<br />
conservation of angular momentum means that this inward spiraling air must also<br />
increase its tangential velocity. The effect of friction, then, is <strong>to</strong> decrease the radius of<br />
maximum winds and <strong>to</strong> increase the inward-directed (radial) component of the wind.<br />
Hence, near the surface, the flow is dominated by intense convergence. A <strong>to</strong>rnado<br />
traveling over a smooth surface that moves in<strong>to</strong> a rough surface will have its force<br />
balance interrupted and the vortex near the surface should decrease its radius. There can<br />
be a transient increase in the peak windspeed after encountering rougher surfaces,<br />
resulting from an “overshoot” of the radial inflow (Fiedler 1993).<br />
d. Tornado families<br />
Research has made it clear that some supercells go through a cyclic evolution<br />
(Burgess et al. 1982; Dowell and Bluestein 2002; Adlerman and Droegemeier 2002),<br />
and the result can be a series of <strong>to</strong>rnadoes. Fujita documented this in his classic study<br />
(Fujita 1960) of the Fargo, North Dakota, supercell s<strong>to</strong>rm (Fig. 19), among others,<br />
including Fujita et al. (1970) or van Tassell (1955).<br />
Figure 19. Mapping of the <strong>to</strong>rnado family in North Dakota on 20 June 1957 (from Fujita 1960).<br />
21
Figure 20. Example of the interaction of successive <strong>to</strong>rnadoes on 13 March 1990. The final stage of the<br />
Hess<strong>to</strong>n, KS <strong>to</strong>rnado (<strong>to</strong>p, left) became caught in the circulation of the rapidly-developing Goessel, KS<br />
<strong>to</strong>rnado (<strong>to</strong>p, right), eventually rotating around the latter and dissipating as it moved around the expanding<br />
Goessel vortex (bot<strong>to</strong>m) [From Davies et al. 1994 (<strong>to</strong>p) and Fujita 1992 (bot<strong>to</strong>m)].<br />
During major outbreaks of <strong>to</strong>rnadoes, cyclic supercells producing <strong>to</strong>rnado families<br />
are typical. Numerous examples can be cited. The intensity of the successive <strong>to</strong>rnadoes<br />
within a family can vary widely, but it is during such outbreaks that violent <strong>to</strong>rnadoes are<br />
most likely. Violent <strong>to</strong>rnadoes during such outbreaks are usually members of a <strong>to</strong>rnado<br />
family produced by a cyclic supercell s<strong>to</strong>rm. They are not always the first <strong>to</strong>rnadoes<br />
produced within the family. In cyclic s<strong>to</strong>rms, it is not uncommon for new <strong>to</strong>rnadoes in<br />
the series <strong>to</strong> be developing even before the dissipation of their predecessors. Thus, there<br />
can be more than one <strong>to</strong>rnado in existence simultaneously, and their damage paths can<br />
overlap. A new <strong>to</strong>rnado developing quickly can “absorb” its weakening predecessor, as<br />
illustrated by Fig. 20.<br />
e. Downburst winds in supercells<br />
Supercells that produce one or more <strong>to</strong>rnadoes often produce strong non<strong>to</strong>rnadic<br />
winds, as well. These are most commonly the result of downbursts within such a s<strong>to</strong>rm,<br />
but occasionally strong inflow winds can be damaging, as well. The inflow winds<br />
associated with the s<strong>to</strong>rm need <strong>to</strong> be distinguished from the inflow <strong>to</strong> a <strong>to</strong>rnado – the<br />
latter is routinely capable of damage, whereas “parent s<strong>to</strong>rm” inflow winds produce<br />
damage only infrequently.<br />
22
A simplified picture of the updrafts and downdrafts within a supercell s<strong>to</strong>rm is<br />
provided in Fig. 21: the most common location for downburst wind damage is with the<br />
Figure 21. Basic airflow associated with a supercell s<strong>to</strong>rm (after Lemon and Doswell 1979), showing the<br />
forward and rear flank downdrafts, denoted "FFD" and "RFD" respectively. The updraft is indicated by<br />
fined stippling and labeled "UD" – the possible location of a <strong>to</strong>rnado is indicated by the circled "T" symbol.<br />
rear flank downdraft (RFD). It is notable that the RFD is closely connected in space <strong>to</strong><br />
any mesocyclonic <strong>to</strong>rnadoes. A “snapshot” image like Fig. 21 does not capture the time<br />
and space evolution of the s<strong>to</strong>rm; embedded within this structure can be a lot of complex<br />
variation. Neither updrafts nor downdrafts are likely <strong>to</strong> be constant for very long. Given<br />
this variability, it is important <strong>to</strong> be alert <strong>to</strong> the possibility that at least some of the<br />
damage along a <strong>to</strong>rnado path can be the result of outflow associated with nearby<br />
downdrafts (i.e., downbursts) of varying scale. 6 In a real event, some of the damage<br />
from downbursts can be interspersed with <strong>to</strong>rnado damage (as suggested by Fig. 22),<br />
adding considerably <strong>to</strong> the difficulty of attributing damage when doing a survey.<br />
It should be clear from this example that it can be difficult <strong>to</strong> separate damage<br />
swaths from different events. This task of separation will be considered below.<br />
6 Technically, if the downburst size is < 4 km, it is a microburst, according <strong>to</strong> Fujita<br />
(1978a).<br />
23
Figure 22. Survey of the 13 June 1976 <strong>to</strong>rnadoes in Iowa by Fujita (1978a ).<br />
f. Size, appearance, and intensity relationships<br />
It is true that size of the damage swath and <strong>to</strong>rnado intensity are related, at least<br />
statistically. As width and, <strong>to</strong> a lesser extent, the length of the path increase, the most<br />
probable F-scale tends <strong>to</strong> increase as well (Fig. 23). Therefore, it would be logical <strong>to</strong><br />
assume that <strong>to</strong>rnado size is a way <strong>to</strong> gauge its intensity. This statistical relationship does<br />
not hold, unfortunately, for specific <strong>to</strong>rnadoes. A statistical tendency does not equate <strong>to</strong><br />
a general rule.<br />
24
Figure 23. The probability of the F-scale rating, given (<strong>to</strong>p) path width, and (b) path length (The figures<br />
were made from data provided by H. Brooks, NSSL) .<br />
Observe that as the path width increases, the most likely F-scale (the peaks in the<br />
probability distributions) shifts upward. For example, given a width of about 1600 m,<br />
around 45% of the <strong>to</strong>rnadoes are violent (F4 – F5), whereas for widths of about 500 m,<br />
only 10% of the <strong>to</strong>rnadoes are violent. At any given width or length, the sum of the<br />
probabilities must equal unity. It appears from these (and other) data that F5 events may<br />
be underrepresented in the his<strong>to</strong>rical record.<br />
For any given <strong>to</strong>rnado, the windfield is a complicated function of space and time,<br />
as already discussed. Since the <strong>to</strong>rnado results ultimately from a process of conservation<br />
of angular momentum (sometimes referred <strong>to</strong> as vortex stretching), the closer the radius<br />
25
of maximum winds <strong>to</strong> the axis of rotation, the faster the associated windspeeds will be,<br />
all other fac<strong>to</strong>rs being equal. Therefore, narrow <strong>to</strong>rnadoes might even be more intense<br />
than wide <strong>to</strong>rnadoes – but not necessarily. In cases of multiple vortex <strong>to</strong>rnadoes, the<br />
fastest windspeeds would be associated with the subvortices. The windspeeds associated<br />
with the “parent” vortex in which the subvortices are embedded might be relatively weak<br />
compared <strong>to</strong> those in the transient subvortices. But the existence of multiple vortices is<br />
also not a reliable indica<strong>to</strong>r of the possibility of high intensity. The occurrence of<br />
multiple vortices depends on the so-called swirl ratio, which is the ratio of the tangential<br />
velocity <strong>to</strong> the vertical velocity. Generally speaking, as the swirl ratio increases, the<br />
likelihood of multiple vortices increases – that is, the existence of multiple vortices is<br />
airflow that is increasingly dominated by the tangential winds over the vertical winds.<br />
Note that even dust devils can have multiple vortices, so a multivortex <strong>to</strong>rnado need not<br />
be particularly intense.<br />
With the widespread use of inexpensive consumer video cameras and the growth<br />
of s<strong>to</strong>rm chasing, it is now likely that a video record will exist for at least some portion of<br />
the life of many <strong>to</strong>rnadoes. Therefore, those doing a survey may have access <strong>to</strong> such<br />
video. Unfortunately, the appearance of a <strong>to</strong>rnado is not a reliable indica<strong>to</strong>r of its<br />
intensity. Even the apparent speed of rotation may not be reliable, unless a careful<br />
pho<strong>to</strong>grammetric analysis of the video is done. The apparent speed of rotation is strongly<br />
dependent on the distance of the vortex <strong>to</strong> the viewer, and the radius of maximum wind<br />
would only be coincidentally equal <strong>to</strong> the funnel or debris cloud boundary. Debris is not<br />
necessarily moving with the wind, so debris motion can also be deceptive. Generally<br />
speaking, while it is tempting <strong>to</strong> look <strong>to</strong> the appearance of a <strong>to</strong>rnado, including its size, as<br />
an indica<strong>to</strong>r of the windspeed, the relationship between appearance and intensity is just<br />
not reliable.<br />
g. Other vortices<br />
Although it seems rather obvious how <strong>to</strong> identify a <strong>to</strong>rnado, it sometimes is not so<br />
easy (see Doswell and Burgess 1993). The atmosphere produces a wide variety of<br />
vortices, and separating the <strong>to</strong>rnadoes from other types of vortices can be challenging on<br />
some occasions. There are at least three vortices, however, that should be considered<br />
<strong>to</strong>rnadoes. A <strong>to</strong>rnado, according <strong>to</strong> the newly-revised Glossary of Meteorology<br />
(Glickman 2000) is:<br />
A violently rotating column of air, in contact with the ground, either<br />
pendant from a cumuliform cloud or underneath a cumuliform cloud, and<br />
often (but not always) visible as a funnel cloud.<br />
The first potentially confusing phenomenon is the so-called landspout. This<br />
terminology is intended <strong>to</strong> convey the similarity between events on land <strong>to</strong> those that can<br />
occur over the ocean. Most waterspouts are not associated with supercell s<strong>to</strong>rms, and so<br />
<strong>to</strong>rnadoes that form in the absence of a mesocyclone have been given the colloquial name<br />
of “landspout” – technically, these should be referred <strong>to</strong> as nonmesocyclonic <strong>to</strong>rnadoes.<br />
For purposes of classification, however, all such events should be considered <strong>to</strong>rnadoes.<br />
26
Nonmesocyclonic <strong>to</strong>rnadoes can occur in clusters, with several of them ongoing<br />
simultaneously.<br />
The second troublesome event is the waterspout. Currently, waterspouts are not<br />
reported as <strong>to</strong>rnadoes unless they come on shore. They meet the criteria associated with<br />
the preceding definition and so whatever rationale might be offered <strong>to</strong> justify this policy,<br />
a waterspout is a <strong>to</strong>rnado. The Glossary states explicitly that this is the case.<br />
The final problematic convective vortex is the so-called cold-air funnel. This<br />
phenomenon has not received a great deal of research attention, but it is clear that a<br />
properly identified event (associated with convective s<strong>to</strong>rms developing near the core of a<br />
cold-core synoptic-scale cyclone aloft) that develops potentially damaging winds at the<br />
surface is a <strong>to</strong>rnado. Such <strong>to</strong>rnadoes are associated with regions having relatively weak<br />
ambient vertical windshear. Tornadoes that occur in the vicinity of a cold-core cyclone<br />
in regions of strong ambient vertical windshear are simply supercell-associated (perhaps<br />
with relatively low s<strong>to</strong>rm <strong>to</strong>ps) <strong>to</strong>rnadoes.<br />
A different sort of commonly-encountered event is the so-called gustnado. This<br />
type of vortex, which is not interpreted as being a true <strong>to</strong>rnado, occurs along gust fronts,<br />
as in Fig. 24.<br />
Figure 24. Example of a gustnado on 23 May 1982, made visible by dust from plowed fields. It was one<br />
of a large number observed in the vicinity. No rotation was evident at cloud base, despite it being a<br />
relatively low cloud base above the vortex (Pho<strong>to</strong>graph © courtesy of C. Doswell, used by permission).<br />
The primary distinguishing characteristic of a gustnado is that the intense vortex is<br />
shallow – on the order of 100 m. The intense vortex does not extend as far as cloud base,<br />
so no strong rotation will be observed in the clouds above such a vortex. Gustnadoes are<br />
generally weak and brief, and they can occur in swarms, with perhaps dozens of them<br />
occurring in a short time along a moving gust front. A troubling aspect of this sort of<br />
event is that true <strong>to</strong>rnadoes also can arise in association with gust fronts. What makes<br />
them <strong>to</strong>rnadoes is that the intense vortex is deep enough <strong>to</strong> be connected <strong>to</strong> strongly<br />
rotating cloud bases above the debris whirl at the surface. The observation of gustnadoes<br />
requires that some tracer be available <strong>to</strong> make the vortex airflow visible – gustnadoes<br />
might be relatively common along gust fronts, but without a tracer, they generally are not<br />
27
observed, and they would be <strong>to</strong>o shallow <strong>to</strong> be seen on any operational radar. In<br />
situations involving downbursts, gustnadoes might be occurring episodically along the<br />
leading edge of the outflow, and each might create a local concentrations of damage,<br />
although the chances of a gustnado reaching even F2 intensity are small. If gustnadoes<br />
are not true <strong>to</strong>rnadoes, in a post-s<strong>to</strong>rm survey it’s certainly going <strong>to</strong> be difficult <strong>to</strong> sort out<br />
the difference between a gustnado and a brief, weak true <strong>to</strong>rnado along a gust front.<br />
Without video documentation, it’s not obvious how <strong>to</strong> make this distinction. Any<br />
eyewitnesses might well be adamant in considering these <strong>to</strong> be <strong>to</strong>rnadoes.<br />
C. Problems on the high end of the scale<br />
The difficulty with providing ratings at the high end of the F-scale spectrum is<br />
associated with how much wind was required <strong>to</strong> produce the observed damage. The<br />
challenge has at least two primary components: (1) the actual resistance of the original<br />
structure or vegetation <strong>to</strong> the wind; and, (2) the role that fac<strong>to</strong>rs other than the strength of<br />
the wind might have played in producing the damage. When structures are completely<br />
destroyed, it is difficult <strong>to</strong> gauge how fast the wind might have been – what can be done<br />
in situations meeting the F4-F5 damage criteria in Table 1 is that a lower bound can be<br />
assigned <strong>to</strong> the wind; the minimum value <strong>to</strong> cause that level of damage <strong>to</strong> the structure.<br />
If the structure is weak, that lower bound will be at a lower windspeed than if the<br />
structure is strong. Of course, when structures are not completely destroyed, it is often<br />
possible <strong>to</strong> estimate an upper bound <strong>to</strong> the windspeeds on the basis of what is left behind.<br />
Since the Fujita scale has been closely associated with damage <strong>to</strong> frame homes,<br />
another important issue is the interpretation of damage <strong>to</strong> other structures or <strong>to</strong><br />
vegetation, the carrying of objects by the wind, and other specific effects. At the high<br />
end of the F-scale, the relationship between damage and windspeed is essentially<br />
uncalibrated by any careful engineering studies. Therefore, the relationship between the<br />
windspeed categories and the damage attributed <strong>to</strong> each category by Fujita must be<br />
considered speculative.<br />
1. F3 or F4?<br />
According <strong>to</strong> the Fujita scale criteria, the dividing line between F3 and F4 is<br />
determined by whether or not interior walls are left standing in the wreckage of a frame<br />
home. Strictly speaking, F4 damage requires that no interior walls be left standing. Of<br />
course, there are gray areas: for instance, if a remnant of the interior walls is left but it is<br />
heavily damaged (as in Fig. 25), this might be seen either as “high” F3 or “low” F4<br />
damage, depending on the structural integrity of what is left standing.<br />
When there are no interior walls left standing, the most important issue becomes<br />
the structural resistance of that home and the process by which that damage occurred. In<br />
Appendix 1, an assessment form developed by Mr. Tim Marshall has been provided. This<br />
form is discussed in Marshall et al. (2003). The intent of the form is <strong>to</strong> facilitate the<br />
systematic gathering of information directly related <strong>to</strong> the integrity of the structure prior<br />
<strong>to</strong> the <strong>to</strong>rnado. If there are major problems with the attachments along the load path, then<br />
much weaker winds could produce a given amount of damage. For instance, if the home<br />
28
Figure 25. Example of a severely damaged, but still standing interior wall (FEMA pho<strong>to</strong>graph by C.<br />
Doswell).<br />
is poorly attached <strong>to</strong> the foundation, then damage that nominally is associated with F4 (or<br />
F5) intensity winds could have been produced by much weaker windspeeds than those<br />
assigned <strong>to</strong> the F4 category in the Fujita scale (see Marshall 2003). A home with an<br />
inherently weak structure simply is inadequate <strong>to</strong> justify an F4 rating. Alternatives<br />
include: (1) rating the event F3 or even lower, in the absence of other examples of<br />
possible F4 damage, (2) basing an F4 rating on damage done <strong>to</strong> other homes that appear<br />
<strong>to</strong> have been truly well-constructed, or (3) basing an F4 rating on some other type of<br />
damage beside that done <strong>to</strong> that particular frame home.<br />
<strong>Damage</strong> assessment should not focus exclusively on what has been destroyed. It<br />
is equally important <strong>to</strong> consider what was not destroyed. For example, it can be seen in<br />
Fig. 26 that an engineered structure (a water <strong>to</strong>wer) survived relatively undamaged<br />
amidst what appears <strong>to</strong> be F4 damage <strong>to</strong> homes. An engineered structure has specified<br />
design criteria 7 that usually can be obtained by contacting the owner of the structure.<br />
When a structure survives the event without structural damage, this is a very clear<br />
indication of an upper bound for the windspeeds. If the structure was designed <strong>to</strong> be able<br />
<strong>to</strong> resist winds up <strong>to</strong> 150 mph, for example, then the fact that it successfully resisted the<br />
<strong>to</strong>rnado winds is strong evidence that the winds did not exceed 150 mph. If a structure is<br />
damaged, but not completely, the windspeed might be close <strong>to</strong> the design criterion,<br />
assuming that some other fac<strong>to</strong>r, such as projectiles in the wind, are not involved.<br />
Recall that an F-scale rating can be based on a single point of damage. Clearly, if there<br />
are many instances of a given high level of damage, that is generally safer than a rating<br />
based on a single observation. However, even when there are numerous clear examples<br />
of apparent F4 damage <strong>to</strong> homes, care needs <strong>to</strong> be exercised. All the homes in a<br />
particular area might be characterized by weak attachments of the homes <strong>to</strong> their<br />
foundations. This turned out <strong>to</strong> be the case in a <strong>to</strong>rnado that struck Omaha on 6 May<br />
1975, producing particular devastation of homes in a subdivision. Post-event review of<br />
7 Note that if a structure is designed <strong>to</strong> withstand a certain windspeed, the design likely<br />
includes a “safety fac<strong>to</strong>r” such that failure would actually be expected at a higher<br />
windspeed than the design criterion. When dealing with engineered structures, detailed<br />
information about the design has <strong>to</strong> be obtained <strong>to</strong> establish the likely failure threshold.<br />
29
their structural integrity showed that all of them were inadequately anchored <strong>to</strong> their<br />
foundations, such that winds of 80-100 mph would have been sufficient <strong>to</strong> slide them off<br />
Figure 26. A water <strong>to</strong>wer still standing near homes with no standing interior walls (Pho<strong>to</strong>graph courtesy of<br />
J.H. Golden, used by permission).<br />
those foundations. With the loss of structural integrity along the load path from sliding<br />
off their foundations, the homes were not sufficient <strong>to</strong> merit an F4 rating. That is, despite<br />
having left many homes in this area with no standing interior walls, the <strong>to</strong>rnado could not<br />
be rated F4 on the basis of such evidence.<br />
2. F4 or F5?<br />
Giving a <strong>to</strong>rnado an F5 rating is probably more contentious than it should be; in<br />
general, more scrutiny is given <strong>to</strong> an F5 rating than <strong>to</strong> an F4 rating. In fact, the reluctance<br />
<strong>to</strong> give <strong>to</strong>rnadoes an F5 rating might well cause some events <strong>to</strong> be rated F4 that might<br />
well have been deserving of the highest rating. In effect, proposing an F5 rating focuses<br />
so much attention on the issue that s<strong>to</strong>rm survey teams will be hesitant <strong>to</strong> rate an event at<br />
that level unless they find the strongest possible evidence. Most F5-rated <strong>to</strong>rnadoes have<br />
hit populated areas; a <strong>to</strong>rnado passing through open country is unlikely <strong>to</strong> be given the<br />
highest rating.<br />
In the event a <strong>to</strong>rnado hits a populated area, survey teams can be under some<br />
substantial pressure <strong>to</strong> make an assessment before they have had time <strong>to</strong> give the issue<br />
the careful consideration it deserves. Formally, by the Fujita scale criteria, F5 damage <strong>to</strong><br />
a frame home not only leaves no interior walls standing, but the debris from the home is<br />
swept away, leaving essentially a bare foundation. This sort of “incredible” destruction is<br />
as <strong>to</strong>tal as it is possible <strong>to</strong> be; it leaves essentially nothing of the home but a slab or an<br />
empty foundation. This criterion would seem <strong>to</strong> be relatively easy <strong>to</strong> evaluate but for a<br />
number of complicating fac<strong>to</strong>rs.<br />
As always, the structural integrity of the home prior <strong>to</strong> being hit is a critical<br />
element. When distinguishing F5 damage from lesser intensity s<strong>to</strong>rms, the attachments<br />
along the load path are potential weak points. As already noted, further complicating the<br />
30
issue is the question of the duration of the <strong>to</strong>rnadic winds. The 27 May 1997 <strong>to</strong>rnado that<br />
hit Jarrell, Texas, left a number of homes in a particular subdivision with nothing left but<br />
empty slabs (Fig. 27).<br />
Figure 27. Empty slab left in the Double Creek Estates subdivision following the <strong>to</strong>rnado of 27 May 1997<br />
in Jarrell, Texas (Pho<strong>to</strong>graph © courtesy of T. Marshall, used by permission).<br />
Even the debris was blown far away, making the F5 rating an apparently easy decision.<br />
However, a post-event survey by structural engineers revealed that there was some<br />
variability in the attachments. Some homes were rather strongly attached <strong>to</strong> their slab<br />
foundations, whereas others were not. Beyond that, however, an important question<br />
became the duration of the strong winds – this was a large, relatively slow-moving<br />
<strong>to</strong>rnado (the damage path was estimated <strong>to</strong> be roughly 3/4 mile wide, moving at 5-10<br />
mph). At the observed speed, homes would experience damaging winds for 5-10<br />
minutes. Not only would the damaging winds have more time <strong>to</strong> put structures under<br />
stress, but the long duration would be more likely <strong>to</strong> sweep away the debris than if the<br />
<strong>to</strong>rnadic windspeeds been of lesser duration.<br />
Moreover, this subdivision was relatively isolated, surrounded by mostly open<br />
country. In the case of the <strong>to</strong>rnado that hit the Oklahoma City, Oklahoma, metropolitan<br />
area on 3 May 1999, some of the F5-rated damage occurred in the suburb of Moore,<br />
Oklahoma. In this case, the <strong>to</strong>rnado moved in from other populated areas, and its debris<br />
load was already substantial as it entered Moore. The result (Fig. 28) was large piles of<br />
rubble remaining on empty slab foundations. The <strong>to</strong>rnado damage path was about 1/2<br />
mile wide at this point and the <strong>to</strong>rnado was moving around 35 mph. The damaging winds<br />
would last only about a minute in such a s<strong>to</strong>rm, and if debris from a particular home was<br />
swept away, other debris would fall in its place. In fact, that is just what was observed<br />
during a post-s<strong>to</strong>rm survey – the debris left in a particular location in the F5-rated<br />
damage area in Moore did not come from that location, but arrived from areas hit<br />
previously by the <strong>to</strong>rnado. Hence, the absence of slabs swept clean of debris could not be<br />
taken as evidence of intensity levels below that of F5.<br />
31
Figure 28. Debris piles left by the <strong>to</strong>rnado of 3 May 1999 in Moore, Oklahoma (FEMA pho<strong>to</strong>graph by C.<br />
Doswell).<br />
As with the F4, rating, it is important <strong>to</strong> consider carefully the role of other observations<br />
besides damage done <strong>to</strong> frame homes.<br />
3. Nearby damage<br />
Generally speaking, if an isolated piece of evidence suggests a certain range of<br />
windspeeds, it is important <strong>to</strong> consider nearby damage and other evidence suggesting the<br />
windspeed. 8 If there is a question about the validity of an F-scale estimate at any<br />
location, a look at the surrounding objects can confirm or deny the windspeed estimates.<br />
When the damage is associated with a structure of questionable strength, the surrounding<br />
trees and vegetation may suggest important clues, as in Fig. 29.<br />
4. Projectiles<br />
The generation of large projectiles is a commonly used fac<strong>to</strong>r in the decision <strong>to</strong> give a<br />
<strong>to</strong>rnado either an F4 or an F5 rating. One somewhat controversial issue is the question of<br />
whether or not mo<strong>to</strong>r vehicles become airborne during <strong>to</strong>rnadoes and, if so, at what<br />
windspeeds vehicles leave the ground. There is virtually no doubt that <strong>to</strong>rnadoes can<br />
cause cars <strong>to</strong> be rolled and bounced along the ground. Other evidence, notably video<br />
documentation, provides convincing proof that cars can become airborne – there is some<br />
debate about at what windspeed this occurs. The wording of the Fujita scale (Table 1)<br />
8 It is probably true that meteorologists tend <strong>to</strong> regard variations in damage as evidence of<br />
variations in windspeed, whereas engineers tend <strong>to</strong> see the same variations in damage as<br />
evidence of variations in the susceptibility <strong>to</strong> wind. Reality almost always will lie<br />
somewhere in between these two extremes. It is useful, therefore, in any survey <strong>to</strong> have<br />
both meteorologists and structural engineers involved in damage surveys. This is only<br />
rarely possible, unfortunately.<br />
32
Figure 29. <strong>Damage</strong> <strong>to</strong> a poorly constructed garage implies much stronger winds than the nearby tree,<br />
which has one broken tree branch but is otherwise not heavily damaged (FEMA pho<strong>to</strong>graph by C.<br />
Doswell).<br />
suggests that Fujita believed au<strong>to</strong>mobiles became airborne at F3 windspeeds. Some<br />
preliminary work on this issue has been done by Schmidlin et al. (2003). Their work<br />
suggests that F4 and F5 <strong>to</strong>rnadoes can, indeed, produce au<strong>to</strong>mobile-sized projectiles. It<br />
may be that F3 <strong>to</strong>rnadoes can cause vehicles <strong>to</strong> become airborne, and F2 <strong>to</strong>rnadoes might<br />
Figure 30. A power pole propelled through a window during the 3 May 1999 <strong>to</strong>rnado in Del City,<br />
Oklahoma. It clearly did not tip over and through the window, since the <strong>to</strong>p of the window frame remains<br />
intact (FEMA pho<strong>to</strong>graph by C. Doswell).<br />
be able occasionally <strong>to</strong> overturn vehicles. In any case, the impact of either a tumbling or<br />
airborne au<strong>to</strong>mobile on a structure would magnify considerably the effect of the wind<br />
alone. Although not specifically mentioned in the Fujita criteria, there is evidence that<br />
large power poles can become airborne, at least in violent <strong>to</strong>rnadoes (Fig. 30). Fujita<br />
(1992) has shown that massive I-beams can apparently become airborne (see his Figs.<br />
33
2.5-13-15). There is little doubt that heavy objects of all sorts have been moved without<br />
leaving evidence of being dragged or bounced along the ground.<br />
Unfortunately, the absence of studies revealing at precisely what windspeeds a<br />
given object becomes airborne is a handicap <strong>to</strong> offering such events as evidence for<br />
giving a <strong>to</strong>rnado a particular rating. Of course, when some objects do not become<br />
airborne, this also can be evidence for lesser windspeeds. The issue of windspeeds<br />
needed <strong>to</strong> loft some object is complicated by the fact that the object in question may have<br />
been attached <strong>to</strong> something else (with a large flat area <strong>to</strong> catch the wind) that facilitated<br />
its flight before detaching on impact or otherwise near the end of that time aloft.<br />
Structures and vegetation that remain (even if damaged) within areas exhibiting<br />
possible F4-F5 damage can provide important clues about the windspeeds, especially<br />
engineered structures with well-defined windspeed design thresholds. Although strong<br />
variation in damage from one location <strong>to</strong> another can be an indication of the wellrecognized<br />
strong gradients in windspeed (especially in multiple-vortex <strong>to</strong>rnadoes), they<br />
can also be the result of variable resistance <strong>to</strong> a relatively uniform windspeed. Making<br />
this distinction is not easy and in many cases might come down <strong>to</strong> subjective judgment,<br />
rather than clear and direct evidence.<br />
5. <strong>Damage</strong> <strong>to</strong> vegetation<br />
Given that <strong>to</strong>rnadoes are not always moving through populated areas with humanbuilt<br />
structures <strong>to</strong> hit, it would be useful if we could establish some standards about the<br />
resistance of vegetation <strong>to</strong> windspeeds. This work has not been done, unfortunately, and<br />
so the relationship between vegetation and windspeed remains questionable. Fujita’s<br />
verbal descriptions in Table 1 include some criteria associated with trees but, as everyone<br />
should be aware, the resistance of trees <strong>to</strong> damage from the wind varies considerably with<br />
the tree species, the size and health of the tree, antecedent precipitation (wet ground<br />
makes uprooting trees easier), whether or not the tree is isolated, orientation <strong>to</strong> the wind,<br />
the presence (or absence) of projectiles in the wind, and so on. Peterson (2003) has<br />
discussed a number of issues regarding tree falls in forests.<br />
After particularly damaging <strong>to</strong>rnadoes in populated areas, trees are usually<br />
observed <strong>to</strong> be stripped of most of their branches and even debarked (Fig. 31). Such<br />
damage is almost certainly due <strong>to</strong> the impacts of projectiles in the debris cloud of the<br />
<strong>to</strong>rnado. The issue of whether or not a tree is uprooted depends on the tree type (conifers<br />
typically have shallow root systems), the season (for deciduous trees – the presence of<br />
leaves increases the chances of uprooting by increasing the wind load on the tree), the<br />
soil wetness, and the presence of other trees (which can fall on their neighbors and<br />
enhance the chances of uprooting other trees), among other fac<strong>to</strong>rs.<br />
In an effort <strong>to</strong> increase the range of events that could be rated, Fujita even<br />
developed a series of pho<strong>to</strong>graphs showing damage <strong>to</strong> cornfields, purportedly relating the<br />
character of that damage <strong>to</strong> the F-scale. Again, there are many fac<strong>to</strong>rs that influence how<br />
corn responds <strong>to</strong> the wind, so it is difficult <strong>to</strong> see how any such attempt <strong>to</strong> determine the<br />
34
Figure 31. A debarked tree re mnant in Moore, Oklahoma after the <strong>to</strong>rnado of 3 May 1999 (FEMA<br />
pho<strong>to</strong>graph by C. Doswell).<br />
relationship between damage <strong>to</strong> vegetation and windspeed can be made reliably<br />
quantitative. As with damage <strong>to</strong> structures, the relationship between winds and<br />
vegetation is complex and nonlinear; therefore, assignment of F-scale solely on the basis<br />
of damage <strong>to</strong> vegetation would be inherently difficult. It is even hard <strong>to</strong> imagine how a<br />
“calibration” of the damage <strong>to</strong> the windspeed could be done, given all the complex<br />
fac<strong>to</strong>rs that can affect the way vegetation reacts <strong>to</strong> the wind. Guyer and Moritz (2003)<br />
have discussed some possible avenues for estimating windspeeds in rural areas, but<br />
clearly much research would need <strong>to</strong> be done <strong>to</strong> “calibrate” any proposed system.<br />
6. “Scouring” of pavement<br />
From time <strong>to</strong> time, there are reports of a <strong>to</strong>rnado passage being associated with<br />
removal of pavement. This “scouring” of pavement is certainly unlikely with weak<br />
<strong>to</strong>rnadoes, but it has been cited on occasion as evidence of “incredible” intensity. It is not<br />
known precisely how pavement scouring occurs – given a windspeed at ten meters above<br />
the surface, the wind at the height of pavement is surely much less, so the removal of<br />
pavement by wind action alone might seem <strong>to</strong> require very strong <strong>to</strong>rnadic winds. Phan<br />
and Simiu (1998) have attributed the scouring of pavement <strong>to</strong> the pressure difference<br />
between air trapped beneath the pavement and the <strong>to</strong>rnado. This does not seem plausible<br />
given the current consensus about the relative lack of importance of “suction” associated<br />
with <strong>to</strong>rnadoes, but since it is not known how pavement damage actually occurs in<br />
specific instances, their hypothesis cannot be dismissed. It is quite possible that<br />
projectile impacts might be a fac<strong>to</strong>r, as well as the type of pavement and its exposure <strong>to</strong><br />
the wind. Wind erosion of surrounding soil that undermines the pavement might be a<br />
major contribu<strong>to</strong>r in such examples. No instance of concrete pavement removal is known<br />
35
– all examples of scouring have been asphalt or similar pavement material. It seems<br />
unlikely that pavement removal would be associated with a weak <strong>to</strong>rnado (F0 – F1), but<br />
in the absence of a careful study of how much wind is needed <strong>to</strong> produce pavement<br />
failure, it is not known <strong>to</strong> what extent “scoured” pavement indicates the likelihood of F4<br />
– F5 intensity. The occurrence of pavement scouring by itself probably should not be<br />
taken <strong>to</strong> imply F4-F5 intensity, but might be sufficient for a rating of F2-F3.<br />
D. Problems on the low end of the scale<br />
The challenges on the low end of the Fujita scale are very different from those at<br />
the high end. Rather than having structures completely destroyed, at the low end of the<br />
scale there is considerable evidence left behind that implies upper bounds on the wind<br />
speed. However, the challenge at the low end of the scale is generally deciding whether<br />
or not the damage was indeed produced by a <strong>to</strong>rnado. The F-scale minimum threshold<br />
for an F0 <strong>to</strong>rnado (40 mph) is not even sufficient <strong>to</strong> meet the NWS threshold criterion for<br />
a damaging wind (50 kt or 58 mph). It is indeed plausible <strong>to</strong> believe that a vortex might<br />
be present even with winds below 40 mph – the laws of vortex dynamics say that a vortex<br />
must either close on itself or end at a solid surface, so a vortex aloft (funnel cloud) is<br />
likely <strong>to</strong> also be present at the surface, 9 even when the windspeeds there are so weak that<br />
they cannot produce damage.<br />
1. Tornado or downburst?<br />
a. Evidence of rotation?<br />
In doing a damage survey, it is common <strong>to</strong> look for evidence of rotation in the<br />
damage <strong>to</strong> decide whether or not a <strong>to</strong>rnado was involved, if there is no other convincing<br />
evidence that the damage was caused by a <strong>to</strong>rnado. It is important <strong>to</strong> keep in mind in<br />
searching for this evidence that the width of the damage path is a major fac<strong>to</strong>r in the<br />
reaction of structures and vegetation <strong>to</strong> the wind. If the vortex is much larger than a<br />
house or tree, then <strong>to</strong> the object being hit by the <strong>to</strong>rnado, there is only “straight’ wind. As<br />
has been said by structural engineers (e.g., Marshal 1993), “Wind is wind.” What they<br />
mean is that for the most part, the objects affected by a <strong>to</strong>rnado are not influenced by the<br />
rotation of the winds about the <strong>to</strong>rnado. Only if the vortex size is comparable <strong>to</strong> the<br />
object being struck will that object reveal evidence of the vortex rotation. This can<br />
happen, perhaps with subvortices embedded within a multiple vortex <strong>to</strong>rnado, but the<br />
absence of such twisting is not, by itself, direct evidence that the damage was not<br />
<strong>to</strong>rnadic. Conversely, evidence of twisting on small scales – for example, in trees or<br />
traffic signs – can arise from various sources (such as asymmetric wind loading or offcenter<br />
projectile impacts) and may not be direct evidence that the event was <strong>to</strong>rnadic.<br />
For a fast-moving <strong>to</strong>rnado, traveling relatively rapidly, all the damage can be from<br />
wind that is nearly unidirectional. For a cyclonic (in the Northern Hemisphere) <strong>to</strong>rnado,<br />
the counterclockwise rotation of the wind is enhanced by the <strong>to</strong>rnado’s motion <strong>to</strong> the<br />
9 Unless there is a strong stable layer between the vortex and the ground, which can act<br />
effectively as a “solid” surface.<br />
36
ight of its track and decreased by that motion on the left side of the track. A symmetric<br />
<strong>to</strong>rnado with an axisymmetric tangential windspeed of 70 mph (nominally F0, but the Fscale<br />
is defined according <strong>to</strong> the ground-relative windspeed) traveling at 50 mph would<br />
have winds of 20 mph on the left side of its track and 120 mph on the right side (Fig. 32).<br />
In such an event, it is not hard <strong>to</strong> imagine damage indicating a nearly unidirectional wind.<br />
This might even be true for strong, fast-moving <strong>to</strong>rnadoes (Reynolds 1957)<br />
Figure 32. Schematic showing the winds resulting from a <strong>to</strong>rnado with 70 mph peak tangential winds<br />
moving at 50 mph, such that most damage would be from winds from left <strong>to</strong> right on the figure.<br />
b. Debris fall direction<br />
The best evidence of rotation in damage is on the scale of the damage path. For<br />
<strong>to</strong>rnadoes that are relatively strong, or moving relatively slowly, the orientation of the<br />
debris usually reveals that the winds in different parts of the path were from different<br />
directions. However, more important than direct evidence of rotation is whether or not<br />
the winds are diverging or converging. In a <strong>to</strong>rnado, the airflow near the surface is<br />
predominantly inward, or convergent. The closer <strong>to</strong> the surface, the greater the<br />
predominance of this convergence over the rotational flow. When <strong>to</strong>rnadoes move over<br />
mostly open country with few relatively tall objects <strong>to</strong> <strong>to</strong>pple, the pattern of the winds can<br />
be mostly pure radial inflow. If this convergent flow is combined with the contribution<br />
from the movement of the <strong>to</strong>rnado, the resulting near-surface flow will resemble Fig. 33,<br />
at least for a <strong>to</strong>rnado without multiple vortices.<br />
37
Figure 33. Schematic illustration of the near-surface flow directions produced by a moving, relatively<br />
long-lived source of convergence, such as a single-vortex <strong>to</strong>rnado. When the <strong>to</strong>rnado is moving rapidly,<br />
the centerline might be shifted <strong>to</strong>ward the left of the track.<br />
Figure 34. Example of a very narrow <strong>to</strong>rnado track in a cornfield.<br />
A <strong>to</strong>rnado-associated damage track tends <strong>to</strong> be long and much narrower than it is long, as<br />
suggested by the damage in Fig. 34. This character of <strong>to</strong>rnado tracks can be the most<br />
important clue that the event was a <strong>to</strong>rnado, rather than a downburst.<br />
On the other hand, damage produced by downbursts tends <strong>to</strong> be strongly<br />
divergent. A moving downburst typically will produce a divergent swath of damage,<br />
resembling Fig. 35. An example of a microburst in action is shown in Fig. 36. The<br />
divergent character of the airflow is revealed by the dust picked up along the leading<br />
edge of the outflow. Moreover, the damaging winds in a microburst are relatively shortlived.<br />
The resulting damage swath is typically relatively short and broad, more fan-<br />
38
shaped than linear. Note that “twisting microbursts” can appear on the right side of a<br />
cyclonic <strong>to</strong>rnado path, probably associated with microbursts in the rear flank downdraft.<br />
Figure 35. Schematic illustrations of the near-surface flow directions produced by a mircroburst ( or a<br />
downburst). When the downburst is stationary, a circular pattern of symmetric outflow is observed; when<br />
the downburst is moving or is not coming down vertically, a fan-shaped outflow is observed, and some<br />
moving downbursts have vorticity, so that a “twisting” pattern of outflow is observed. What is common <strong>to</strong><br />
them all is a pattern of diverging winds, so if the orientation of damage is diverging, the likely cause is a<br />
downburst (From Fujita 1985).<br />
Figure 36. Pho<strong>to</strong>graph of a fan-shaped microburst in action, captured by T. Fujita during the Joint Airport<br />
Weather Study (JAWS) Project in Colorado, on 14 July 1982 (From Fujita 1985).<br />
c. S<strong>to</strong>rm sounds<br />
Another commonly-used criterion for determining whether or not an event was a<br />
<strong>to</strong>rnado was the “roaring” sound associated with the damage. In actuality, both <strong>to</strong>rnadoes<br />
and downbursts can produce very loud wind noise that could be characterized as a<br />
“roaring” sound. Thus, there does not appear <strong>to</strong> be any way for those involved in such an<br />
event <strong>to</strong> be able <strong>to</strong> distinguish <strong>to</strong>rnadoes from downbursts by the sound alone.<br />
39
d. Radar signatures<br />
When considering an event, a survey team should acquaint themselves with the<br />
radar data (as discussed below). However, radar alone is not sufficient information <strong>to</strong><br />
distinguish <strong>to</strong>rnadic from non<strong>to</strong>rnadic events. There certainly are characteristic radar<br />
signatures associated with pro<strong>to</strong>typical events. Not only does a supercell have dramatic<br />
Figure 37. Reflectivity (<strong>to</strong>p) and Doppler velocity (bot<strong>to</strong>m) associated with the supercell s<strong>to</strong>rm that<br />
produced the <strong>to</strong>rnado that struck the Oklahoma City, Oklahoma, metropolitan area on 3 May 1999.<br />
Tornado tracks from that day are superimposed (white). (Images courtesy of the National Severe S<strong>to</strong>rms<br />
Labora<strong>to</strong>ry).<br />
radar reflectivity features (e.g., the hook echo, as shown in Fig. 37), but there are clear<br />
indications of strong rotation in the Doppler velocity fields.<br />
40
The presence of a hook echo and Doppler velocity signature near and along the<br />
observed <strong>to</strong>rnado track indicates that tracking features in the radar data can be helpful in<br />
locating possible <strong>to</strong>rnadoes and establishing the timing of events along the s<strong>to</strong>rm path. 10<br />
Unfortunately, not every real <strong>to</strong>rnado can be associated unambiguously with such<br />
obvious radar signatures. This situation can result from several limitations that are<br />
inherent <strong>to</strong> all radars, or it can simply be that the event is not like the pro<strong>to</strong>typical<br />
mesocyclonic <strong>to</strong>rnado. We have already discussed the possibility of nonmesocyclonic<br />
<strong>to</strong>rnadoes, and these may or may not have any recognizable signature in radar<br />
observations, depending on several fac<strong>to</strong>rs – the distance from the radar, the size of the<br />
<strong>to</strong>rnado, and so on.<br />
The same can be said of downbursts and microbursts. The presence of strong<br />
airflow as seen in Doppler radar observations is no guarantee that those winds are<br />
reaching the surface. Conversely, the absence of strong airflow in Doppler radar<br />
Figure 38. Results of an aerial survey (after Fujita 1993) showing the location of various events along the<br />
path of the supercell s<strong>to</strong>rm.<br />
observations does not preclude the possibility of strong downburst winds at the surface.<br />
Nevertheless, the radar data may offer considerable value in locating possible events and<br />
10 The location of a <strong>to</strong>rnado at the surface is not necessarily consistently tied <strong>to</strong> some<br />
feature in the radar data. Radar data, even at the lowest elevation, are well above the<br />
surface, and <strong>to</strong>rnadoes can be tilted, such that their surface contact point can vary relative<br />
<strong>to</strong> the radar features being tracked. The displacement of the surface track from, say, a<br />
vortex signature in the radial velocity field can be as much as a km or so, and will not be<br />
a constant over the duration of the <strong>to</strong>rnado.<br />
41
helping <strong>to</strong> establish the time of damage occurrence. Under ideal circumstances, as<br />
discussed in Speheger et al. (2002), it is possible <strong>to</strong> use radar data <strong>to</strong> help resolve many of<br />
the conflicting pieces of information about the details associated with a damaging event.<br />
Figure 39. Pho<strong>to</strong>s showing the track of a “microvortex” (<strong>to</strong>p) and a “spin up” (bot<strong>to</strong>m) from Fujita’s aerial<br />
survey after the Plainfield, Illinois, <strong>to</strong>rnado of 28 August 1990.<br />
2. What is a <strong>to</strong>rnado?<br />
Some of the common issues with defining a <strong>to</strong>rnado have already been discussed:<br />
gustnadoes, landspouts, “cold-air” funnels, and waterspouts. This does not exhaust all of<br />
the potential difficulties. For example, in his survey of the Plainfield, Illinois, <strong>to</strong>rnado of<br />
28 August 1990, Fujita (1993) shows what he has called “microvortices” and “spin-ups”<br />
in his mapping of the event (Fig. 38) – examples of these are shown in Fig. 39. Are these<br />
<strong>to</strong>rnadoes or not? Since there were no eyewitness videos of these events and we only<br />
have evidence from the aerial pho<strong>to</strong>graphs that something happened that almost certainly<br />
involved a vortex-like flow at the surface, these probably are <strong>to</strong>rnadoes, but might<br />
42
possibly be gustnadoes, as well. These “microvortices” are quite narrow events (Fig. 39,<br />
<strong>to</strong>p) but seem quite persistent (relatively long tracks), whereas the “spin-ups” must be<br />
brief vortices (and/or slow-moving). The “spin-ups” (Fig. 39, bot<strong>to</strong>m) may be the first<br />
intermittent episodes of damage along the track of the developing Plainfield <strong>to</strong>rnado (see<br />
below for a discussion of gaps in the path), made visible by the damage they produced in<br />
cornfields.<br />
Eyewitnesses who claim <strong>to</strong> have seen a funnel cloud (or not) can be in error. This<br />
should not be taken <strong>to</strong> mean that eyewitnesses are necessarily unreliable, but they can<br />
easily be mistaken. Their range of experiences generally does not include an extensive<br />
sample of severe s<strong>to</strong>rms and <strong>to</strong>rnadoes. For the example shown in Fig. 40, numerous<br />
false <strong>to</strong>rnado reports were received. Although this certainly could easily be mistaken for<br />
a <strong>to</strong>rnado, it simply is scud beneath a shelf-type outflow cloud.<br />
Figure 40. Example of a <strong>to</strong>rnado look-alike that generated numerous erroneous <strong>to</strong>rnado reports on 27 May<br />
2001 in southwestern Kansas (Pho<strong>to</strong>graph © courtesy of J. Williams, used by permission).<br />
On the other hand, damage produced by a s<strong>to</strong>rm in which eyewitnesses did not see a<br />
funnel cloud might actually be <strong>to</strong>rnadoes. This can occur when the <strong>to</strong>rnado simply has no<br />
visible funnel cloud, or when the funnel cloud is obscured by dust or rain.<br />
In some cases, identifying the character of an event can be a major problem –<br />
generally speaking, the greater the amount of damage, the easier it is <strong>to</strong> identify the<br />
nature of the event that produced it. A few isolated items of minor damage are much<br />
more difficult <strong>to</strong> associate with a particular type of event than a swath of extensive<br />
damage. Although the majority of events are relatively easy <strong>to</strong> identify as <strong>to</strong>rnadoes or<br />
non-<strong>to</strong>rnadoes, in real surveys of damaging convective s<strong>to</strong>rms, it is not always so<br />
straightforward.<br />
3. Skipping and gaps in the path<br />
An especially troubling problem is the existence of gaps along an extended<br />
damage track. Do these mark separate <strong>to</strong>rnado occurrences or should they all be<br />
connected in<strong>to</strong> a single “skipping” <strong>to</strong>rnado? Unfortunately, this may not be an obvious<br />
decision, especially when all one has <strong>to</strong> work with is the damage. The best situation is<br />
when video evidence provides a visual record of a continuing vortex – in such a case, it<br />
might be satisfac<strong>to</strong>ry <strong>to</strong> ignore the gaps in the damage (which might arise either from a<br />
43
lack of objects <strong>to</strong> damage, or from transient fluctuations in the intensity of the vortex at<br />
the surface) and consider the event a single <strong>to</strong>rnado. In the absence of documentary<br />
evidence for a continuing vortex circulation, this is basically a question of judgment.<br />
a. Spatial and temporal variations in wind<br />
Although the detailed structure and evolution of the wind field throughout a<br />
<strong>to</strong>rnado’s life cycle has never been documented, there are numerous reasons <strong>to</strong> believe in<br />
the complexity of that wind field. The damage itself offers some hints of this complexity,<br />
(cf. Fig. 3). The limited quantitative measurements of that wind field using<br />
pho<strong>to</strong>grammetry and mobile Doppler radars suggest that <strong>to</strong>rnadic windfields are far from<br />
simple. One consequence of all this complexity is that the windspeeds near the surface<br />
could decrease below some threshold from time <strong>to</strong> time, at some locations along the<br />
track. This could result in temporary cessation of damage, even though the vortex was<br />
continuously in existence. A strict interpretation of a <strong>to</strong>rnado as requiring the presence of<br />
damaging winds at the surface would mean that each segment of a damage track with<br />
gaps would have <strong>to</strong> be attributed <strong>to</strong> a separate <strong>to</strong>rnado. This seems <strong>to</strong> fly in the face of<br />
what we have learned from years of <strong>to</strong>rnado films and video – the continuing vortex does<br />
not “skip” or “withdraw back in<strong>to</strong> the clouds” but rather has a more or less continuous<br />
debris whirl at the surface, despite the presence of gaps in the damage. As already noted,<br />
unraveling the events associated with a “gappy” damage track is difficult in the absence<br />
of other evidence, so this suggests that other evidence in addition <strong>to</strong> any survey of the<br />
damage track needs <strong>to</strong> be considered in making this judgment. In the best of situations,<br />
fluctuations in the damage can be connected <strong>to</strong> changes in the radar depiction of the<br />
s<strong>to</strong>rm – for example, weakening of gate-<strong>to</strong>-gate shear signatures in the Doppler data, or<br />
the formation of new mesocyclones aloft prior <strong>to</strong> the occurrence of a new track with a<br />
gap separating it from the track of a <strong>to</strong>rnado associated with a previous mesocyclone.<br />
Radar’s ability <strong>to</strong> observe <strong>to</strong>rnadoes can vary substantially with range, among other<br />
fac<strong>to</strong>rs, so a comprehensive consideration of all the information available is an important<br />
part of arriving at a decision concerning whether or not damage path gaps indicate the<br />
presence of distinctly separate <strong>to</strong>rnadoes.<br />
b. Surface boundary layer character<br />
A number of fac<strong>to</strong>rs associated with the surface boundary layer (within a few tens<br />
of meters above the ground) can influence the damage produced by a <strong>to</strong>rnado.<br />
Obviously, a major fac<strong>to</strong>r is the present of structures and vegetation that can be damaged.<br />
In some cases, a <strong>to</strong>rnado can strip even short grasses from the surface, leaving behind a<br />
visible scar even though nothing substantial was present <strong>to</strong> be “damaged”. As with the<br />
issue of pavement removal, such a track could be indicative of a <strong>to</strong>rnado of significant<br />
(F2 or greater) intensity, but such an assertion is more speculation than established fact.<br />
It just is not clear how <strong>to</strong> interpret such a track in terms of an F-scale assessment if<br />
nothing that can be evaluated is struck within the track.<br />
The presence of human structures and trees increases the “roughness” in the<br />
surface boundary layer and acts <strong>to</strong> reduce the near-surface winds within the area covered<br />
by such objects. If the <strong>to</strong>rnado is not of sufficient strength <strong>to</strong> destroy those objects in its<br />
44
path, it may seem that the <strong>to</strong>rnado is “at tree-<strong>to</strong>p level” and not doing damage at the<br />
ground. Such an interpretation is not consistent with vortex dynamics – it simply means<br />
that the <strong>to</strong>rnado is not strong enough <strong>to</strong> overcome increased friction near the surface.<br />
4. Complex <strong>to</strong>rnado tracks<br />
S<strong>to</strong>rm chasers and citizen videos have shown examples where the distinction<br />
between a continuing vortex and separate <strong>to</strong>rnadoes can be difficult <strong>to</strong> make even when<br />
excellent video documentation is available and the event is not wrapped in rain or dust.<br />
Surveying a damage path after the fact is made even more complex by the fact that<br />
successive <strong>to</strong>rnadoes in a <strong>to</strong>rnado family can track along paths that are very close (cf. Fig.<br />
20). In fact, distinctly different <strong>to</strong>rnadoes have run over virtually identical ground on the<br />
same day. Recognition of the presence of overlapping tracks can be difficult unless<br />
survivors make a note of having been hit more than once (or video documentation of the<br />
two events exists). In such cases, having radar available (so that the passage of separate<br />
s<strong>to</strong>rms can be documented) makes it easier <strong>to</strong> recognize the possible existence of<br />
overlapping tracks. Even if it is known (or suspected) that more than one <strong>to</strong>rnado has<br />
tracked along a very similar path, then partitioning the damage in<strong>to</strong> different <strong>to</strong>rnadoes<br />
can still be problematic (see the discussion of overlapping paths near Mulhall, OK, on 03<br />
May 1999 in Speheger et al. [2000], their Fig. 7). If distinct tracks converge in<strong>to</strong> (or<br />
Figure 41. An aerial pho<strong>to</strong>graph showing an abrupt change in the direction of movement of a <strong>to</strong>rnado<br />
(perhaps affected by a microburst) near Logan, Iowa, in May of 1999 (Pho<strong>to</strong>graph © courtesy of B. Smith,<br />
used by permission).<br />
diverge from) a common path, then the likelihood of overlapping separate <strong>to</strong>rnadoes is<br />
high. Making such distinctions can be quite challenging from the ground. An aerial<br />
survey is much more likely <strong>to</strong> uncover evidence of overlapping tracks than one done only<br />
45
on the surface. It is also much easier <strong>to</strong> document track complexities, such as abrupt path<br />
changes from an aerial view (Fig. 41)<br />
E. Issues that will arise<br />
1. Public reaction <strong>to</strong> damage<br />
When doing a damage survey, the team needs <strong>to</strong> keep in mind that for many<br />
people, the event being surveyed is the most extreme example of a weather event most of<br />
the victims have ever seen. In their limited sample, its significance can be much greater<br />
than the objective evidence reveals. Survivors of such an experience may have many<br />
misconceptions and misunderstandings that characterize their perception of the event. It<br />
is counterproductive <strong>to</strong> attempt <strong>to</strong> correct their notions of what happened when discussing<br />
the event with them, no matter how wrong they might be, especially shortly after the<br />
event.<br />
In particular, the public or local community leaders may be inclined <strong>to</strong> dispute the<br />
survey team’s assessment of the F-scale rating. For various reasons, the local officials<br />
can also be unhappy with the team’s evaluation of the data. If a careful analysis has been<br />
done, then there should be no need <strong>to</strong> alter the team consensus. In fact, it would be a<br />
mistake <strong>to</strong> modify a conclusion just <strong>to</strong> avoid negative pressure or publicity. Although<br />
some subjectivity is always going <strong>to</strong> be involved in reaching a final decision, when<br />
proper procedures (as described herein) are followed and evidence is available <strong>to</strong> support<br />
the team consensus, then the opinions of nonprofessionals (i.e., not meteorologists or<br />
engineers) should not be allowed <strong>to</strong> influence the survey team’s assessment.<br />
2. Media seeking an “instant analysis”<br />
Another common experience for a survey team is the tendency of the media <strong>to</strong><br />
want an “instant analysis” of a disastrous event. The National Transportation Safety<br />
Board is always careful <strong>to</strong> avoid drawing early conclusions about aircraft accidents – in<br />
the same way, a survey team should exercise comparable care <strong>to</strong> avoid being drawn in<strong>to</strong><br />
making premature statements about the intensity of an event. This does not mean a lack<br />
of cooperation with the media, of course. Indeed, many people want <strong>to</strong> know just what<br />
happened in a major event. Rather than succumbing <strong>to</strong> the pressure for a quick decision,<br />
the survey team should simply respond by saying that it is <strong>to</strong>o early <strong>to</strong> draw any<br />
conclusions until all the available information has been gathered and analyzed.<br />
II. Putting <strong>to</strong>gether a survey team<br />
A. Prior preparation and fast response<br />
The time <strong>to</strong> prepare for a survey is well before any event has hit. Possible team<br />
members need <strong>to</strong> be identified in advance of any event, and contact information about<br />
them should be available <strong>to</strong> team organizers. Generally speaking, clean-up begins within<br />
46
a few minutes after an event has happened. Removal and rearrangement of the debris<br />
makes a proper interpretation of the event increasingly difficult as time passes. Ideally, a<br />
survey should begin as early as possible on the morning after an event. In order <strong>to</strong> pull a<br />
team <strong>to</strong>gether and get them ready within less than 24 hr after a damaging s<strong>to</strong>rm, the<br />
arrangements simply cannot be done on the spur of the moment. The collection of survey<br />
materials, as well as getting team members prepared <strong>to</strong> leave, needs <strong>to</strong> be such that most<br />
of the preparation has been done well in advance, ready <strong>to</strong> be put <strong>to</strong> use at a moment’s<br />
notice.<br />
It is possible <strong>to</strong> begin a ground survey <strong>to</strong>o soon, however. Generally speaking,<br />
<strong>to</strong>rnadoes and damaging s<strong>to</strong>rms in general can block access <strong>to</strong> the damaged areas. First<br />
responders have <strong>to</strong> have time <strong>to</strong> remove victims and clear the roads <strong>to</strong> allow access<br />
before a team can be effective. That this also can destroy useful information is<br />
unfortunate.<br />
If possible, an aerial survey should be done as soon as possible, and if that option<br />
is <strong>to</strong> be available, those arrangements absolutely would need <strong>to</strong> be made in advance. See<br />
below for some suggestions about obtaining aerial surveys. Aerial surveys can do several<br />
important tasks:<br />
1. gaining access <strong>to</strong> locations that might otherwise be difficult <strong>to</strong> survey, either<br />
because of that access being blocked by s<strong>to</strong>rm damage, or by being located far<br />
from any easy access,<br />
2. providing an indication of where the critical areas that need a ground survey are<br />
located,<br />
3. determining track continuity or gaps in areas not readily accessible on the ground<br />
4. documenting the presence of multiple vortices,<br />
5. identifying convergence/divergence patterns <strong>to</strong> help distinguish between<br />
<strong>to</strong>rnadoes and downbursts, and<br />
6. mapping the variations in damage along the path.<br />
See Fujita and Smith (1993) for more discussion of aerial surveys. An aerial survey is<br />
primarily useful for providing an overview of the event. As wide as possible an area<br />
needs <strong>to</strong> be searched for possible <strong>to</strong>rnado damage, including areas that might be rather far<br />
from populated areas. It is only by air that such events are likely <strong>to</strong> be documented.<br />
Doing ground surveys is also critical. Once the most intense damage areas have<br />
been identified, ground surveys are the only way <strong>to</strong> document the all-important details<br />
necessary <strong>to</strong> estimate the windspeeds associated with a particular piece of damage.<br />
Aerial and ground surveys complement each other, and neither is likely <strong>to</strong> be adequate by<br />
itself.<br />
Ideally, it would be optimal <strong>to</strong> do several ground and aerial surveys (as described<br />
in Speheger et al. 2002). As a survey continues, questions inevitably arise whereby it<br />
would be best <strong>to</strong> go back and reexamine some locations, or go <strong>to</strong> some locations that had<br />
been overlooked or missed for some reason.. This may not be possible in a given<br />
situation, but the option <strong>to</strong> backtrack should be considered during the preparation phase,<br />
so that it would be possible <strong>to</strong> resolve questions that can arise.<br />
47
B. Team capabilities<br />
A major component of doing a proper survey is having the necessary capabilities<br />
on the team. In most instances, the majority of such a team would be meteorologists.<br />
Hopefully, the meteorologist team members would be well-versed on the structure and<br />
behavior of severe s<strong>to</strong>rms and <strong>to</strong>rnadoes. Ideally, the members should have prior<br />
experience at surveying s<strong>to</strong>rm damage, and be able <strong>to</strong> focus on what are the relevant<br />
observations for coming <strong>to</strong> a plausible interpretation. For these purposes, having<br />
qualified structural engineers on the team can provide a critical component that is often<br />
missing from surveys conducted only by meteorologists. Limited survey training can not<br />
compensate for the insight provided by a professional structural engineer. Obviously,<br />
this may not be possible in every case. If some members have experience gained from<br />
prior surveys done with engineers, this might compensate somewhat for not having one<br />
or more engineers on the team.<br />
Again speaking ideally, the team is likely <strong>to</strong> benefit from the participation of<br />
some local officials, perhaps law enforcement or someone identified with emergency<br />
management. This can be helpful in obtaining access <strong>to</strong> areas that may be closed, but it<br />
also provides those local officials with some first-hand experience about how the<br />
assessment process works. Having such a participant is potentially important in<br />
establishing local credibility for the conclusions of the team.<br />
Another desirable team capability (but probably both difficult <strong>to</strong> achieve) would<br />
be someone with a professional sociology or psychology background who could conduct<br />
studies of the human side of a disastrous event. This would be helpful in learning about<br />
the interface between the weather community and the users of their information. Also, a<br />
medical doc<strong>to</strong>r interested in the pathology of trauma caused by disasters would be<br />
helpful. Getting access <strong>to</strong> medical information about casualties can be a challenge as<br />
medical data are generally viewed as confidential. A medical doc<strong>to</strong>r can provide an<br />
important interface between the team and the medical community.<br />
Clearly, any team needs a local coordina<strong>to</strong>r, who is likely <strong>to</strong> be available in most<br />
any circumstances. This is likely <strong>to</strong> be someone at the local NWS forecast office. A<br />
team coordina<strong>to</strong>r has <strong>to</strong> be committed <strong>to</strong> providing a service that may never be requested.<br />
After all, most communities are not likely <strong>to</strong> be struck by a disastrous <strong>to</strong>rnado event in a<br />
human lifetime. But if a team is <strong>to</strong> be ready <strong>to</strong> spring in<strong>to</strong> action on short notice, there<br />
must be local commitment <strong>to</strong> being prepared <strong>to</strong> do so.<br />
The reality of getting a team <strong>to</strong>gether rapidly enough <strong>to</strong> be able <strong>to</strong> start work on<br />
the morning after an disaster means that a pool of possible participants needs <strong>to</strong> be<br />
identified well in advance, ready and willing <strong>to</strong> go in<strong>to</strong> action on short notice. The NWS<br />
has a Quick Response Team (QRT) that can be deployed within 18 <strong>to</strong> 24 hours of an<br />
event, <strong>to</strong> determine the final F-<strong>Scale</strong> rating for all <strong>to</strong>rnadoes that are suspected of<br />
producing greater than F3 wind damage. At the local level, alternate team members for<br />
each of the capabilities envisioned have <strong>to</strong> be identified in order <strong>to</strong> be able <strong>to</strong> put a<br />
complete team <strong>to</strong>gether. Volunteers have <strong>to</strong> be sought and personal contact information<br />
available <strong>to</strong> the local team coordina<strong>to</strong>r. Outside “experts” may or may not be available <strong>to</strong><br />
survey a particular event, depending on the resources allocated <strong>to</strong> doing post-s<strong>to</strong>rm event<br />
damage surveys.<br />
48
C. Tools<br />
Although it may seem obvious that certain things are necessary for doing a<br />
survey, it is useful <strong>to</strong> list them. In the flurry of excitement after a severe weather event<br />
that produces significant damage, some items might be forgotten.<br />
1. Equipment<br />
a. Recording media<br />
Cameras are essential documentation <strong>to</strong>ols for a survey. Ideally, the cameras<br />
would be provided for the team by the agencies doing the survey. In practice, the<br />
cameras will often be those owned by the team members. Hopefully, the media (film,<br />
videotape, etc.) will be provided by the agencies, but again, this might or might not be so.<br />
Both still and video cameras are helpful, in different ways. Still cameras provide clear,<br />
high-resolution images that provide documentary evidence in support of an assessment.<br />
Video cameras can provide audio tracks, with verbal testimony from survivors and<br />
commentary from the survey team members as they go about documenting what they are<br />
observing. Video and still images from aerial surveys are also desirable.<br />
Generally speaking, 35 mm still cameras of good quality are sufficient for the<br />
purposes of a survey. They should be capable of having exposure times of around 1/500<br />
s, especially if they are <strong>to</strong> be used from the air (<strong>to</strong> reduce blurring from aircraft<br />
movement). Expensive professional equipment is not necessary. Ideally, each camera<br />
should have a wide angle, normal, and telepho<strong>to</strong> focal length lens. In many instances,<br />
zoom lenses can cover this range of focal lengths and reduce the number of lenses that<br />
need <strong>to</strong> be carried. Many zoom telepho<strong>to</strong> lenses have a “macro” setting that permits clear<br />
close-up pho<strong>to</strong>graphs of structural details. A heavy “gadget bag” full of complicated<br />
camera gear is not generally necessary or even desirable – heavy gear can be a serious<br />
hindrance in scrambling through and over debris. Film for a 35 mm still camera should<br />
be moderately “fast” film (e.g., ISO 200) <strong>to</strong> permit clear, sharp images in light levels that<br />
might range from unlighted interior rooms <strong>to</strong> bright sunlight. It is useful <strong>to</strong> identify the<br />
sequence of film rolls in some way, <strong>to</strong> avoid potential confusion from arising after<br />
processing.<br />
Another option is digital cameras – those capable of meeting resolution standards<br />
approaching that of 35 mm film images are preferred (on the order of 5-10 megapixels),<br />
but acceptable images can be obtained from digital cameras with resolutions of 1-2<br />
megapixels. If digital cameras are used, then either the images need <strong>to</strong> be downloadable<br />
in the field (e.g., <strong>to</strong> a lap<strong>to</strong>p computer), or there should be enough memory modules of<br />
sufficient size available <strong>to</strong> contain up <strong>to</strong> hundreds of full-resolution images. As with<br />
film, there should be some effort <strong>to</strong> identify the sequence of digital pho<strong>to</strong>graphs. Those<br />
doing aerial surveys need <strong>to</strong> be sure <strong>to</strong> use a digital camera with exposure speed<br />
adjustable <strong>to</strong> 1/500 s, as with film cameras.<br />
There should be a flash unit for each camera, <strong>to</strong> pho<strong>to</strong>graph structural details<br />
inside areas <strong>to</strong>o dark for natural light exposures. If the lenses used have an au<strong>to</strong>focus<br />
capability, this can be a help in obtaining clear pho<strong>to</strong>graphs but the user should be aware<br />
of the limitations of au<strong>to</strong>focus lenses (which can be “fooled” when looking through<br />
49
intervening materials like glass or screening). Au<strong>to</strong>matic exposure still cameras can also<br />
have trouble with high-contrast scenes – when doing a survey in bright sunlight, the<br />
highlights may be overexposed and the shadows underexposed. When it doubt about the<br />
exposure, it is best <strong>to</strong> “bracket” the exposures <strong>to</strong> provide both highlight and shadow<br />
detail. Obviously, the more experienced each team member is with pho<strong>to</strong>graphy using<br />
the camera he/she has available, the more likely it is that useful documentary pho<strong>to</strong>graphs<br />
will be obtained.<br />
As with still cameras, it is not necessary <strong>to</strong> have professional grade video<br />
equipment. For most purposes, the au<strong>to</strong>exposure and au<strong>to</strong>focus capability of most<br />
consumer grade video cameras is acceptable. If using a video camera, the opera<strong>to</strong>r<br />
should provide audio documentation of such things as time and location. Some digital<br />
video cameras have a “time stamp” feature that indicates when the video was taken. If<br />
available, this feature should be enabled. When trying <strong>to</strong> capture audio tracks that<br />
contain eyewitness reports or commentary, wind can be an issue. It is best <strong>to</strong> have a wind<br />
“muffler” on the microphone, if possible. Digital video cameras have the advantage that<br />
the tapes can be downloaded in<strong>to</strong> computers for incorporation in presentations, but there<br />
is no compelling need for digital versus analog video equipment. Most consumer video<br />
cameras have zoom lenses that cover a wide range of focal lengths, so it is normally only<br />
necessary <strong>to</strong> carry extra batteries and videotapes with the camera. The battery charger is<br />
also an important item <strong>to</strong> remember, especially if the survey extends over several days.<br />
b. Proper footwear<br />
Tornado debris contains many hazards: exposed nails and screws, broken glass,<br />
shattered framing lumber, and other potential sources of injury. A survey team arriving<br />
within the first 24 h after a major event will almost certainly be required <strong>to</strong> climb over<br />
debris piles <strong>to</strong> carry out their duties. Ideally, “safety” shoes with metal inserts <strong>to</strong> prevent<br />
puncture wounds <strong>to</strong> the feet ought <strong>to</strong> be available. Lacking that, tennis shoes don’t offer<br />
a safe alternative – leather boots with deep tread are a possible alternative <strong>to</strong> true safety<br />
shoes.<br />
c. Headgear<br />
Proper hard hats should be considered manda<strong>to</strong>ry. Entering damaged buildings<br />
puts the team at risk from falling debris. If the hard hats have an official logo <strong>to</strong> help <strong>to</strong><br />
identify the team members, so much the better.<br />
d. Local maps<br />
The teams should obtain detailed street maps from local sources. If possible,<br />
individual structures should be identified on those maps, such as shown in Fig. 42. This<br />
facilities an accurate, detailed mapping of the level of damage along the s<strong>to</strong>rm track.<br />
Every effort should be made <strong>to</strong> identify sources of such maps well before the need <strong>to</strong> put<br />
<strong>to</strong>gether a survey team arises. There are maps available on the World-Wide Web in<br />
various locations that can provide detailed street-level maps (without identifying home<br />
sites). Local officials are likely <strong>to</strong> have detailed maps that might include home and<br />
50
structure locations. Getting teams in<strong>to</strong> the field as early as possible after an event is<br />
important, as already noted; therefore, obtaining detailed maps needs <strong>to</strong> have been done<br />
as far in advance as possible.<br />
Figure 42. Example of detailed street map, showing home locations and F-scale estimates (Image courtesy<br />
of the National Severe S<strong>to</strong>rms Labora<strong>to</strong>ry).<br />
e. Other gear<br />
Everyone on the team should be carrying a flashlight, with extra batteries. This<br />
light is useful for identifying important clues in devastated structures, where it is virtually<br />
certain that there will be no power for building lights. A note pad and a clipboard, with<br />
pencils (with an eraser) and pens allows for documentation of observations. A supply of<br />
large capacity plastic bags with “zip” closure can be used <strong>to</strong> protect maps and notepads<br />
from precipitation. Drinking water and snack food, may or may not be available during a<br />
site survey – team members probably should carry a small amount of water and food.<br />
Rain gear is also an important consideration, as some of the survey may have <strong>to</strong> be done<br />
while it is raining. On the other hand, in case the survey is done in bright sunshine,<br />
sunglasses and sunscreen are helpful. A good pair of work gloves can be helpful if it<br />
becomes necessary <strong>to</strong> handle debris. A daypack <strong>to</strong> carry cameras, film, tapes, and the<br />
other gear is recommended <strong>to</strong> keep hands free during the process of scrambling over and<br />
through debris. The team should have one reasonably extensive first aid kit, with<br />
bandages, antiseptic creams, over-the-counter pain relievers, sunburn ointments, etc.<br />
When documenting structural details (e.g., see Appendix 1), it is important <strong>to</strong><br />
have a tape measure – the team as a whole should have at least one large tape measure<br />
capable of measurements up <strong>to</strong> about 100 ft, but 6-10 foot tape measures for individual<br />
team members will suffice. It is often useful <strong>to</strong> have the tape measure included in the<br />
documentation pho<strong>to</strong>graphs, <strong>to</strong> provide an accurate scale.<br />
51
f. Communication<br />
It is common for the team <strong>to</strong> split up the tasks during a survey if a comprehensive<br />
review of the damage is <strong>to</strong> be done as quickly as possible. This means that some form of<br />
communication will be needed <strong>to</strong> coordinate the separated team members. Cell phones<br />
are a possibility, but experience after major disasters suggests that cell phone service<br />
might be erratic or non-existent. Ideally, short range, battery-powered radios are an ideal<br />
way for the team <strong>to</strong> stay in contact during times when they have split up. The usual range<br />
for these is no more than a mile or two, but the team should probably not get much more<br />
separated than their radios permit, anyway. These radios are relatively inexpensive and<br />
provide the team with added security in case someone has an accident. Typically, the<br />
batteries for these radios will need recharging at least once per day.<br />
2. Credentials<br />
As a way <strong>to</strong> prevent looting after disasters, the effected area is usually closed<br />
down and cordoned off for several days after a major event. Gaining access <strong>to</strong> the area<br />
for purposes of a damage survey requires that everyone on the team carry credentials that<br />
identify them as someone authorized <strong>to</strong> be present within areas of restricted access. The<br />
need for credentials as soon as possible after the event means that obtaining them is<br />
another task that cannot be done at the last minute. Although individual team members<br />
may not be known until a team can be organized after the event has occurred, the<br />
coordination needed <strong>to</strong> get credentials for everyone should be worked out in advance.<br />
Learning just whom it is that the team leader needs <strong>to</strong> contact in order <strong>to</strong> obtain<br />
credentials should not be put off until after the event occurs. Every NWS office should<br />
know how this is done and who the responsible authority is for all the communities<br />
within their County <strong>Warning</strong> Area (CWA). Depending on the circumstances, state,<br />
county, and city officials may need <strong>to</strong> be consulted. Ideally, NWS personnel will meet<br />
with those individuals for all the primary metropolitan areas within their CWA in<br />
advance, so everyone is prepared <strong>to</strong> obtain the team’s credentials expeditiously after (or<br />
even before) a disastrous event.<br />
3. Potential aerial survey opportunities<br />
Given that aerial surveying is expensive, it might seem that many surveys would<br />
have <strong>to</strong> be done without the benefit of access <strong>to</strong> aircraft for the survey team. However,<br />
there are several options that can be considered <strong>to</strong> help secure this valuable resource at<br />
little or no cost. It already has been suggested that having an aerial survey can be a<br />
critical part of a thorough assessment of the situation, so these opportunities need <strong>to</strong> be<br />
pursued in advance. Again, trying <strong>to</strong> arrange for an aerial survey on the morning after a<br />
major disaster is going <strong>to</strong> introduce delays in<strong>to</strong> the process, at the very least. In fact, if<br />
this has not been done in advance, it is likely <strong>to</strong> be very difficult <strong>to</strong> put something<br />
<strong>to</strong>gether at the last minute.<br />
One option is <strong>to</strong> inquire about the possibility of securing a seat on an aircraft<br />
(fixed-wing or helicopter) operated by a local television (TV) station, if the community is<br />
52
large enough <strong>to</strong> support news aircraft. It is possible that TV stations will be willing <strong>to</strong><br />
cooperate on such a survey in exchange for the favorable publicity. Although the team<br />
cannot be asked <strong>to</strong> provide an endorsement for that TV station, it can be argued that<br />
being cooperative with the survey team is good public relations. Be sure <strong>to</strong> make them<br />
aware that the needs of a damage survey are likely <strong>to</strong> be different from those of the<br />
station. A TV station may not be willing or able <strong>to</strong> help with a lengthy survey flight, but<br />
any aerial survey is better than none.<br />
A related possibility is finding a seat on law enforcement aircraft. Again, this is<br />
only possible in communities large enough that the local law enforcement can afford <strong>to</strong><br />
use aircraft. If the local community cannot afford it, the state might be able <strong>to</strong> offer a<br />
seat on state-operated law enforcement aircraft for purposes of a disaster-related damage<br />
survey.<br />
In many communities, the Civil Air Patrol (CAP) can be contacted about securing<br />
an aircraft for purposes of a damage survey. They are committed <strong>to</strong> helping the NWS<br />
with this task, when asked – the NWS and CAP already have a Memorandum of<br />
Understanding (MOU) in place for this purpose.<br />
If there is a military installation with aircraft nearby (Air Force, Army, National<br />
Guard, etc.), they also might be willing <strong>to</strong> provide aircraft after a local disaster. The<br />
“trick” <strong>to</strong> these options, of course, is <strong>to</strong> let them know in advance about the possible need<br />
for such a contribution. If the responsible authority is amenable <strong>to</strong> the idea, then the<br />
details for how that might happen should be worked out well before a s<strong>to</strong>rm-related<br />
disaster occurs, of course.<br />
Finally, some citizen in the area might be willing <strong>to</strong> provide and pilot an aircraft.<br />
The number of people with private pilot’s licenses is growing all the time and even<br />
someone on the local NWS staff may be able <strong>to</strong> obtain and fly an aircraft in support of a<br />
damage survey. Weather offices often have considerable interaction with the civil<br />
aviation community, so they might have contacts that would be ready <strong>to</strong> help out in case<br />
of an emergency.<br />
Note that in requesting aircraft for use in an aerial survey, the best aircraft are<br />
helicopters and those with high wing attachments. Aircraft with low wing attachments<br />
will not provide adequate views downward.<br />
D. Planning the survey<br />
1. Multiple team coordination<br />
In major weather-related disaster surveys, it is not uncommon for several survey<br />
teams <strong>to</strong> be sent in. In some communities, private sec<strong>to</strong>r aerial mapping teams are sent<br />
out under contract <strong>to</strong> provide local officials with information about the extent of the<br />
damage. Structural engineers (from federal agencies, universities, and/or private sec<strong>to</strong>r<br />
companies) may send in a survey team. The NWS may deploy a Service <strong>Assessment</strong><br />
team following major weather-related disasters. The NWS also has a Quick Response<br />
Team (QRT) that can be deployed within 18 <strong>to</strong> 24 hours of an event, <strong>to</strong> determine the<br />
final F-<strong>Scale</strong> rating for all <strong>to</strong>rnadoes that are suspected of producing greater than F3 wind<br />
damage. For major weather disasters, the Office of the Federal Coordina<strong>to</strong>r for<br />
Meteorological Services and Supporting Research (OFCM) will coordinate with all the<br />
53
federal agencies participating in the National Post S<strong>to</strong>rm Data Acquisition Plan<br />
(NPSDAP). The OFCM will notify the appropriate NPSDAP members, if other agencies<br />
deploy a field survey team. Unfortunately at times, disparate survey teams may not even<br />
know of the very existence of the other teams, so communication and coordination<br />
among multiple survey teams can be minimal or even non-existent.<br />
Hopefully, it is clear that this is a much less than optimal strategy in the face of<br />
the numerous challenges of doing a meaningful survey of a s<strong>to</strong>rm event. Without<br />
coordination, for instance, the same information may have been secured multiple times,<br />
and the different teams may arrive at different conclusions simply because they had not<br />
seen what another team used <strong>to</strong> draw its conclusions. The information may have been<br />
paid for several times, as well, which certainly is not a good use of limited survey<br />
resources. Moreover, even when the teams set about collecting different kinds of<br />
information, having access <strong>to</strong> data taken from different perspectives can be crucial in<br />
trying <strong>to</strong> understand the event. Therefore, the local team coordina<strong>to</strong>r needs <strong>to</strong> make it a<br />
goal <strong>to</strong> find out as much as possible about who might be interested in information about a<br />
weather-related disaster, and seek out any and all local, county, state, and federal<br />
agencies, individuals, and private sec<strong>to</strong>r companies who might be involved in (or at least<br />
interested in the results from) a post-s<strong>to</strong>rm survey and therefore might be sending out a<br />
survey team.<br />
2. Priorities<br />
Not every survey team is charged with the same priorities. The team leader has <strong>to</strong><br />
ensure that the mission objectives will be met in the time allotted for the survey.<br />
Typically, teams are made up of volunteers, which the team leader will need <strong>to</strong> keep in<br />
mind. In fieldwork, it is quite likely that a number of unanticipated issues will arise,<br />
some of which might be in conflict with the initial survey objectives. The team leader<br />
should be responsible <strong>to</strong> inform the team about the objectives and for decisions about<br />
changing priorities, after seeking input from all the team members and coordinating the<br />
process with the sponsoring agencies, if necessary.<br />
For their part, team members need <strong>to</strong> be mindful of staying focused on achieving<br />
the goals for which they were brought in <strong>to</strong> accomplish during the survey. Each team<br />
member might well be providing expertise unique <strong>to</strong> that team, and that expertise will be<br />
necessary for achieving the survey objectives. Any other tasks done by individual team<br />
members should not compromise the mission objectives, but team members nevertheless<br />
should be encouraged <strong>to</strong> be creative during the survey. Various science and engineering<br />
“targets of opportunity” might present themselves that would significantly enhance the<br />
value of the survey, and team members should feel free <strong>to</strong> share these ideas with the<br />
team. The team leader must have the authority ultimately <strong>to</strong> decide how the team has <strong>to</strong><br />
operate <strong>to</strong> finish their mission. For their part, team members will need <strong>to</strong> subordinate any<br />
special interests <strong>to</strong> the goals of the survey.<br />
3. Comprehensive coverage<br />
An important part of the team’s priorities is <strong>to</strong> determine in advance just how<br />
comprehensive their survey can be in the time allotted. If the event is a major <strong>to</strong>rnado<br />
54
outbreak comprising dozens of <strong>to</strong>rnadoes, it might not be possible <strong>to</strong> survey every<br />
<strong>to</strong>rnado with identical rigor. It is common <strong>to</strong> focus on those <strong>to</strong>rnadoes that inflicted the<br />
greatest damage and casualties. In the event of a large outbreak, then, a decision will<br />
need <strong>to</strong> be made before the team even begins its fieldwork about which <strong>to</strong>rnadoes will be<br />
given priority. For <strong>to</strong>rnadoes that produce a large damage area (e.g., 10 km 2 or larger), it<br />
may be necessary <strong>to</strong> prioritize the work within a single <strong>to</strong>rnado track, be it an isolated<br />
event or a member of an outbreak. If there are multiple teams in the field, it should be<br />
possible <strong>to</strong> coordinate the effort and minimize the redundancy of the surveys. This<br />
option depends on the individual team missions – if team missions are very different,<br />
then it might be necessary <strong>to</strong> have more than one team cover the same areas. This means<br />
that the team leaders should coordinate their missions with all other teams, in advance<br />
insofar as that is possible.<br />
Clearly, the goal in damage assessment is <strong>to</strong> be comprehensive, and <strong>to</strong> avoid<br />
situations where a serious assessment error is made simply because the team failed <strong>to</strong><br />
review the entire track. The time allotment for the survey and the size of the survey team<br />
should be matched <strong>to</strong> the event, ideally.<br />
4. Coordination<br />
a. Other survey teams<br />
This issue has been mentioned several times, simply because it is a critically<br />
important component of a successful survey. Survey resources are typically limited, as is<br />
the time available. Coordination with other teams sent out by other agencies can be<br />
difficult. At times, the very existence of those other efforts may not be known during the<br />
survey. Therefore, it behooves the team leader <strong>to</strong> be aware of other possible groups who<br />
would do a survey. Coordination among Federal agencies has not always been well done<br />
in the chaos following a disastrous weather event, <strong>to</strong> say nothing of private sec<strong>to</strong>r groups,<br />
state and local authorities, and the local military. However, for major weather disasters<br />
in the future, the Office of the Federal Coordina<strong>to</strong>r for Meteorological Services and<br />
Supporting Research (OFCM) will coordinate with all the federal agencies participating<br />
in the National Post S<strong>to</strong>rm Data Acquisition Plan (NPSDAP). The OFCM will notify the<br />
appropriate NPSDAP members, if other agencies deploy a field survey team.<br />
In the absence of such coordination, it turned out after the 3 May 1999 <strong>to</strong>rnado<br />
outbreak that a team of foreign national military officers was training in central<br />
Oklahoma and did an overflight of the main <strong>to</strong>rnado track. This resulted in a highresolution<br />
aerial mapping of that track, but no one knew that this flight was being done or<br />
that the aerial mapping images were available at the time some of the surveys were<br />
underway. The overflight was just something that happened, rather than being part of a<br />
coordinated plan. Hopefully, such valuable contributions after disastrous weather-related<br />
events in the future will be coordinated properly. The team leaders will need <strong>to</strong> make<br />
contacts well before an event, and when (and if) the event occurs, they will need <strong>to</strong><br />
contact the responsible authorities <strong>to</strong> see if any survey-relevant activities will be<br />
undertaken. Just knowing whom <strong>to</strong> contact is the critical step.<br />
55
. Law enforcement<br />
If the team is <strong>to</strong> do their job properly, coordination of the survey with law<br />
enforcement is a critical necessity. Do not assume that simply belonging <strong>to</strong> a responsible<br />
agency is enough <strong>to</strong> gain access <strong>to</strong> areas cordoned off. Those subordinate authorities<br />
who staff the barricades and decide who does and does not pass need <strong>to</strong> be aware that this<br />
specific team might at some time seek access <strong>to</strong> their area of responsibility. Subordinate<br />
authorities are generally only empowered <strong>to</strong> refuse requests for access – seeking approval<br />
of requests that have not been arranged beforehand is usually only possible if someone<br />
farther up the “chain of command” is consulted, and who is empowered <strong>to</strong> make the<br />
decision <strong>to</strong> grant access. Seeking this person is time-consuming and could be frustrating.<br />
If the team encounters some subordinate authority figure who is not willing <strong>to</strong> allow them<br />
access <strong>to</strong> an area, and it is not possible expeditiously <strong>to</strong> obtain the necessary approval, the<br />
team is advised <strong>to</strong> avoid additional confrontation with anyone barring access. Simply<br />
move on, and if the authority <strong>to</strong> pass can be conveyed <strong>to</strong> the local responsible authorities,<br />
the site can be reviewed later.<br />
c. Emergency responders<br />
If the team can begin their survey the morning after a major event, it is likely that<br />
access <strong>to</strong> some areas will still be blocked by debris. Those responsible for responding <strong>to</strong><br />
such emergencies will be very busy dealing with the event, and may not be able <strong>to</strong> divert<br />
resources <strong>to</strong> assist the survey team. In such cases, it is likely that the team will simply<br />
have <strong>to</strong> make the best of the situation. An important part of coordination with emergency<br />
responders is <strong>to</strong> have up-<strong>to</strong>-the-minute information about the progress of the clean-up.<br />
Emergency responders put a high priority on clearing roads <strong>to</strong> allow access by emergency<br />
vehicles, so knowing the status of the roads is an important part of coordinating the<br />
survey. Areas may have <strong>to</strong> be surveyed in the order by which they become accessible.<br />
Team leaders should be aware of who are the local authorities responsible for emergency<br />
response. An awareness of the survey team’s needs is helpful <strong>to</strong> emergency responders,<br />
who can incorporate those needs in<strong>to</strong> their planning, but like many other aspects of a<br />
s<strong>to</strong>rm survey, the contact by the survey team leader needs <strong>to</strong> be made well before an<br />
event happens. Otherwise, emergency responders will have no input from the survey<br />
team and will establish their priorities without incorporating the survey team’s needs.<br />
E. Safety<br />
1. On the ground<br />
Safety on the ground during a survey must always be a major fac<strong>to</strong>r in deploying<br />
the survey team. Many hazards can be present in the immediate aftermath of a <strong>to</strong>rnado<br />
(or other winds<strong>to</strong>rms). These include, but are not limited <strong>to</strong>, such things as live power<br />
lines on the ground, gas leaks, hazardous material spills, aggressive or venomous animals<br />
in the debris, unstable piles of debris, sharp objects in the debris (glass, nails, broken<br />
timbers, etc.), and so on. Moving about through debris is a necessary part of doing a<br />
damage survey, but the team needs <strong>to</strong> be reminded constantly of the hazards they will<br />
56
encounter. Ideally, everyone should have a current tetanus booster shot, as puncture<br />
wounds are a very real possibility during a survey. Be aware of the possibility that a<br />
debris pile masks a hidden hazard, such as a swimming pool or a hole in<strong>to</strong> which a team<br />
member could fall. Only a moment of carelessness can result in a serious accident.<br />
Team members should not just wander about on their own; at no time should any<br />
team member ever be alone and out of contact with the team. In the event of an accident<br />
involving a team member, procedures need <strong>to</strong> have been planned in advance and<br />
arrangements for emergency treatment made. It’s ideal <strong>to</strong> have all team members trained<br />
in first aid, but in the absence of this, the team should include at least one or more who<br />
are so trained. The team leader should be aware of the presence of emergency responders<br />
in the vicinity of the team’s survey operation, since they will often have the capability <strong>to</strong><br />
provide emergency treatment after an accident. This document cannot dwell on the<br />
details of first aid, but one rule that everyone on the team should know is that when<br />
people have been impaled by large objects (larger than nails or splinters), those objects<br />
should not be pulled out during first aid. Rather, the objects should be stabilized in place<br />
and the victims passed on <strong>to</strong> medical professionals as soon as possible.<br />
Sanitation is also an important part of safety during a ground survey. Tornado<br />
damage swaths may be seriously contaminated with various hazardous materials and<br />
sources of infection. Wearing work gloves can reduce the possibility of contamination or<br />
infection when working in debris piles.<br />
2. In the air<br />
If one or more aircraft have been obtained for aerial survey purposes, the pilot<br />
should already be aware of the general requirements for safe aircraft operation. This will<br />
naturally include coordination with other aircraft operating in the vicinity. The team<br />
member(s) who will be riding on the aircraft need <strong>to</strong> work out (in some detail) with the<br />
pilot what the team’s aerial needs are and the capability of the aircraft <strong>to</strong> meet those<br />
needs (see Appendix 4) before take-off. At no time should the survey operation<br />
compromise the safe operation of the aircraft.<br />
Whatever the situation regarding aerial survey opportunities, it is useful <strong>to</strong> inquire<br />
about the pilot’s background. Experience and Instrument Flight Rules (IFR) qualification<br />
are important <strong>to</strong> safety. If there is any doubt about the pilot’s ability <strong>to</strong> accomplish the<br />
survey safely, seek another aerial survey choice. Note that during the aftermath of a<br />
damaging <strong>to</strong>rnado, the airspace over the path can be crowded, so having an experienced<br />
pilot is a necessity, not a luxury.<br />
Not all survey team members are equally good candidates for participation in an<br />
aerial survey. If the individual is prone <strong>to</strong> being airsick or has difficulty in aerial<br />
“navigation” this can lead <strong>to</strong> problems that could compromise the mission. Most people<br />
<strong>to</strong>day have some flying experience, but often only in commercial aircraft. If someone on<br />
the team has experience in small private aircraft, such a person is more likely <strong>to</strong> be<br />
successful in the aerial part of a damage survey.<br />
57
F. Courtesy<br />
1. Interacting with victims<br />
At all times, the survey team should be mindful of the impact that <strong>to</strong>rnadoes can<br />
have on the victims. Their homes and possessions have been damaged or even swept<br />
away, they and their loved ones may have experienced serious physical trauma, and they<br />
will inevitably have suffered psychological trauma. In spite of all the devastation they<br />
may have experienced, many victims are surprisingly willing <strong>to</strong> provide information <strong>to</strong><br />
the survey team. The victims should be made aware that information provided by them<br />
<strong>to</strong> the survey team will be of value in learning from the disaster – their assistance can<br />
help many others. Victims of natural disasters are often seeking <strong>to</strong> find meaning in what<br />
has happened <strong>to</strong> them, and that may explain why they are willing <strong>to</strong> cooperate with the<br />
survey team.<br />
a. Sensitivity <strong>to</strong> their situation<br />
It’s possible that victims may say and do things that are known <strong>to</strong> be incorrect.<br />
They might believe erroneously that they have experienced the worst part of the event, or<br />
they thought they saw things that are physically impossible, for instance. You should<br />
avoid any arguments with victims about what they may have seen or experienced. If you<br />
disagree with them or don’t believe their accounts, keep that <strong>to</strong> yourself. Listen <strong>to</strong> what<br />
they have <strong>to</strong> say about their experiences with the respect that you would hope <strong>to</strong> receive<br />
if your situations were reversed. For most victims, their first experience with a <strong>to</strong>rnado<br />
or damaging winds<strong>to</strong>rm will be the worst they’ve ever seen and have no basis for<br />
comparisons. The trauma of financial loss, in addition <strong>to</strong> physical harm <strong>to</strong> them and the<br />
people they know will be beyond your comprehension if you’ve not also experienced<br />
similar losses. Being a good listener is not only helpful <strong>to</strong> your team goals, but is also<br />
helpful <strong>to</strong> the victims.<br />
b. Rendering aid<br />
If the survey team is successful in commencing the survey on the morning after<br />
the event, it is possible that victims will be found who need medical attention. Team<br />
safety considerations suggest that at least one team member should have first aid training;<br />
this also is valuable in rendering medical aid <strong>to</strong> victims. Obviously, any such medical aid<br />
should be the minimum required <strong>to</strong> allow the victims <strong>to</strong> be passed on <strong>to</strong> medical<br />
professionals as soon as possible. In addition <strong>to</strong> medical treatment, victims may need<br />
other types of assistance. Generally speaking, the survey team is not in a position <strong>to</strong><br />
provide much direct assistance. Instead, the survey team leader is responsible for<br />
providing the team members with information about where victims should be directed for<br />
various types of assistance. This will need <strong>to</strong> be coordinated with the emergency<br />
responders who are working the event.<br />
58
2. Interacting with law enforcement<br />
Law enforcement after a weather-related disaster is primarily concerned with<br />
keeping most people out of affected areas. At the level of the people staffing the<br />
“barricades,” their default authority is <strong>to</strong> deny access. As already discussed, access for<br />
the survey team throughout the affected area should have been coordinated with all the<br />
relevant law enforcement authorities before the team begins its survey. At no time<br />
should any resistance that might be encountered <strong>to</strong> survey team access become<br />
confrontational – simply move on and attempt <strong>to</strong> find a higher authority empowered <strong>to</strong><br />
grant access. In general, the team’s survey operations are always subordinate <strong>to</strong> the<br />
needs of law enforcement authorities.<br />
3. Interacting with the media<br />
Various media representatives may be encountered during the survey. Generally<br />
speaking, the team leader should be the primary point of contact with all media<br />
representatives. Cooperation with the media is encouraged, wherever it does not conflict<br />
with the accomplishment of the survey mission. This may include granting recorded<br />
interviews at the discretion of the team leader and the individual team members, time<br />
permitting. The team should not be drawn in<strong>to</strong> speculation about the event before all the<br />
information has been collected and evaluated. Discussion of any aspect of the situation<br />
that is not directly pertinent <strong>to</strong> the survey is strongly discouraged – the team is<br />
responsible only for their survey duties and should not engage in any discussion (positive<br />
or negative) about other issues associated with the event.<br />
III. Evaluating the situation<br />
Once the fieldwork phase of the survey is completed, a meeting of the team <strong>to</strong><br />
discuss their findings will be necessary. Generally speaking, the assessment of the<br />
situation is not limited <strong>to</strong> determining an F-scale rating for the <strong>to</strong>rnado(es). Although the<br />
F-scale rating is probably going <strong>to</strong> receive the greatest public scrutiny and attention, there<br />
are many facets <strong>to</strong> the survey, including both scientific and engineering contributions.<br />
The nature and extent of these issues (i.e., beyond establishing the F-scale) is determined<br />
when the objectives of the survey team are defined, naturally<br />
A. Arriving at an F-scale<br />
There are some general notions that can be used <strong>to</strong> provide a proper F-scale<br />
estimate, based on what has already been discussed herein (and within the references).<br />
As a starting point, the F-scale criteria (cf. Table 1) can be taken literally, at least with<br />
regard <strong>to</strong> the damage seen for frame homes. This initial evaluation then must be<br />
continuously re-evaluated on the basis of the detailed information about structural<br />
integrity obtained during the survey.<br />
Any level of damage must be considered in the light of structural integrity, not just<br />
the extreme manifestations of damage where structures are leveled by the s<strong>to</strong>rm winds. If<br />
59
homes close <strong>to</strong> the extreme damage have similar construction but did not have<br />
comparable damage, it is logically possible that the most intense part of the <strong>to</strong>rnado<br />
missed those nearby structures. However, there may be other explanations. For example,<br />
if a home has been unroofed, that is nominally at least F2 damage, but if it turns out that<br />
only one point of such damage can be found and that particular home has a notable<br />
weakness in the attachment of the roof, whereas nearby homes have lesser damage, then<br />
an F2 rating may not be appropriate. Another possibility is that the orientation of the<br />
home relative <strong>to</strong> the path of the <strong>to</strong>rnado is different than those nearby homes, especially if<br />
it appears the damage was initiated by the failure of a weak point, such as a garage door.<br />
It’s important <strong>to</strong> consider the construction details of nearby homes that did not experience<br />
the highest damage levels. If they’re similar, that suggests the differences in damage are<br />
more likely <strong>to</strong> be associated with variation in the windspeed rather than variations in<br />
structural integrity, but this does not imply certainty in this regard, unfortunately. Even<br />
in cases with similar construction, minor detail variations in structural integrity might<br />
still be involved. Tornadic winds seek out the weakest link in a structure <strong>to</strong> initiate<br />
failure.<br />
When attempting <strong>to</strong> determine F-scales from damage <strong>to</strong> something other than<br />
frame homes, it can become complicated. As already noted, engineered structures may<br />
have known failure thresholds – when they have been damaged but <strong>to</strong>tal failure did not<br />
occur, then those thresholds can be considered as estimates of the windspeed. When <strong>to</strong>tal<br />
failure occurs, the engineering thresholds can be considered as lower bounds <strong>to</strong> the<br />
windspeed. If failure does not occur, those thresholds are upper bounds <strong>to</strong> the<br />
windspeed. Note that some effort may be required <strong>to</strong> find the detailed information about<br />
engineered structures and their failure thresholds. This information will almost certainly<br />
only be found through some research.<br />
When considering damage <strong>to</strong> something other than frame homes and engineered<br />
structures, F-scale estimation becomes much more problematic. If large, heavy objects<br />
have been moved, that movement can be a clue <strong>to</strong> intensity. If heavy objects have been<br />
dragged or have tumbled along the ground, this implies a lesser windspeed than if they<br />
become truly airborne for some distance. The lack of movement of some heavy object in<br />
the path is also a critical clue <strong>to</strong> the windspeed.<br />
It’s important <strong>to</strong> determine, when possible, if an object that has clearly become<br />
airborne was intact when it became airborne, or it was broken in<strong>to</strong> smaller pieces prior <strong>to</strong><br />
being lofted. It can difficult <strong>to</strong> sort out just what the sequence of damage was, as objects<br />
can disintegrate when striking the ground and the fragments scattered after impact, or the<br />
disintegration began while the object was airborne, or the object may even have begun <strong>to</strong><br />
disintegrate prior <strong>to</strong> the pieces becoming airborne. Evidence from the survey should seek<br />
<strong>to</strong> make such distinctions, if possible, as they can have a direct bearing on the assessment<br />
of windspeed. It takes a stronger wind <strong>to</strong> make a large intact object become airborne than<br />
<strong>to</strong> loft the pieces of a disintegrating structure. Ground marks along the track from where<br />
an object was located before being moved (or the absence of any such ground marks) are<br />
the means by which the process of movement of an object can be unders<strong>to</strong>od. If an<br />
object were dragged, it would leave a more or less continuous scar along the track. If that<br />
object were tumbling, it would leave a series of impact marks along the track. Only if it<br />
was airborne would there not be a ground track showing the path of the object from<br />
60
where it was originally <strong>to</strong> where it was found. Often, objects are dragged or tumbled for<br />
a time before becoming airborne.<br />
Pavement scouring, as discussed previously, seems <strong>to</strong> be associated with<br />
relatively high intensity s<strong>to</strong>rms, but that relationship is not clear. That alone would not<br />
be considered sufficient for an F4-F5 rating, but might justify an F2-F3 rating. Stripping<br />
of vegetation <strong>to</strong> the ground might imply similar things about a <strong>to</strong>rnado’s F-scale –<br />
insufficient <strong>to</strong> justify F4-F5, but perhaps supporting an F2 rating in the absence of any<br />
other information. It is not possible in this document <strong>to</strong> provide guidance for all such<br />
possibilities. The survey team will need <strong>to</strong> consider all the information available <strong>to</strong> make<br />
reasonable assessments.<br />
Total destruction seems <strong>to</strong> establish a lower bound <strong>to</strong> the windspeed, but the<br />
structural integrity puts an upper bound on what a reasonable windspeed might be. For<br />
example, it is widely accepted that <strong>to</strong>tal destruction of a mobile home occurs at<br />
windspeeds comparable <strong>to</strong> F2 damage. In the absence of damage <strong>to</strong> objects other than a<br />
mobile home, <strong>to</strong>tal destruction of a mobile home usually cannot be used <strong>to</strong> rate the<br />
windspeeds higher than F2. In a similar way, roof removal seems <strong>to</strong> establish F2<br />
61
Figure 43. (Previous page) A frame home with little or no damage on its front, the side of the home facing<br />
the <strong>to</strong>rnado. Note the damage <strong>to</strong> the home behind that in front, farther from the <strong>to</strong>rnado (which has lost<br />
much of its roof), and the debris filling the space between homes in front. (Above) <strong>Damage</strong> <strong>to</strong> the rear of<br />
the home seen in the <strong>to</strong>p pho<strong>to</strong>graph, caused by elements of the roof from the home across the street,<br />
behind it (FEMA pho<strong>to</strong>graphs by C. Doswell).<br />
windspeeds, but if the attachment is poor, that same damage cannot justify an F2 rating.<br />
Depending on the particular details, roof removal might occur at F1 or even F0<br />
windspeeds. Consider the example shown in Fig. 43: This home’s front side (facing the<br />
<strong>to</strong>rnado) suffered only minor damage (supporting an F0 rating) as a direct result of the<br />
<strong>to</strong>rnado, but was heavily damaged on its rear side by projectiles flying across the street<br />
from a house even farther from the <strong>to</strong>rnado track that had a poorly-attached roof dormer.<br />
The roof damage <strong>to</strong> the home across the street, apart from the loss of the dormer, would<br />
not support an F2 rating, even marginally.<br />
Using the information from a detailed documentation (Appendix 1 and 2) of<br />
structural details associated with frame homes permits some generalizations. If an<br />
attachment is weak, then the F-scale rating based on a superficial application of Table 1<br />
needs <strong>to</strong> be reduced by one F-number (or possibly even two or three). On the other hand,<br />
if the structural integrity has been enhanced with such things as metal strapping, the Fscale<br />
number might have <strong>to</strong> be increased by one F-number in some cases. Such<br />
complexities virtually preclude an accurate F-scale rating from a superficial review of the<br />
damage – there are many things <strong>to</strong> consider and it does everyone a disservice <strong>to</strong> draw<br />
hasty conclusions before all the information has been reviewed and considered in the<br />
context of the full range of observations.<br />
B. Mapping the damage<br />
Any survey should produce a damage map for all the <strong>to</strong>rnadoes surveyed,<br />
including an estimate of the F-scale along the track wherever possible. As discussed by<br />
62
Speheger et al. (2002), the resources available <strong>to</strong> the survey team will determine the<br />
extent <strong>to</strong> which a detailed mapping of the event is possible. In some cases, only one or<br />
two of the <strong>to</strong>rnadoes in an outbreak will be subjected <strong>to</strong> a detailed survey. If a<br />
comprehensive aerial survey is done, at least the damage tracks can be documented and<br />
mapped. In addition, an aerial mapping should document the orientation of the debris as<br />
extensively as possible. This can be helpful in distinguishing converging from diverging<br />
debris, which is helpful in distinguishing <strong>to</strong>rnado tracks from downbursts (Fig. 44)<br />
Figure 44. Illustration of the difference between <strong>to</strong>rnado (left) and downburst (debris) damage from the<br />
air.<br />
If only portions of the event can be surveyed from the air, other damage tracks may have<br />
<strong>to</strong> be estimated from whatever information about them is available. The team should be<br />
clear in its assessment about the extent <strong>to</strong> which each part of its evaluation has been<br />
carefully documented. If other survey teams were in the field, the survey team doing the<br />
assessment should make every effort possible <strong>to</strong> combine the results of other surveys<br />
with its own and <strong>to</strong> give appropriate acknowledgment for all its information sources.<br />
Some discussion has already been offered about the possibility of overlapping<br />
tracks in a <strong>to</strong>rnado outbreak. The team might need <strong>to</strong> be aware of recent other events.<br />
For example, the <strong>to</strong>rnadoes of 3 May 1999 in Moore, Oklahoma, passed over some areas<br />
affected by a <strong>to</strong>rnado from the previous fall – care should be taken during an aerial<br />
survey <strong>to</strong> learn of any recent damage tracks from earlier s<strong>to</strong>rms, <strong>to</strong> avoid confusing those<br />
earlier damage tracks with those from the event being surveyed.<br />
Note that the damage path and the visible funnel are not likely <strong>to</strong> be exactly<br />
coincident, so video information does not necessarily have <strong>to</strong> be directly reconciled with<br />
the damage track. There is no scientific evidence <strong>to</strong> suggest that the edges of a<br />
condensation funnel or debris cloud coincide precisely with the radius of maximum<br />
winds or the boundaries of the damage. In fact, for fast-moving <strong>to</strong>rnadoes, the funnel<br />
cloud axis most likely does not coincide with the center of the damage path, because the<br />
motion produces asymmetry in the ground-relative windspeeds of a moving <strong>to</strong>rnado.<br />
Radar reflectivity can be enhanced by debris when the radar is close enough <strong>to</strong> the<br />
<strong>to</strong>rnado, so operational radar data might offer some clues about the onset of damage, but<br />
operational radar data usually cannot offer much detailed information about the width and<br />
intensity of the damaging winds.<br />
S<strong>to</strong>rm chasers can provide considerable useful information <strong>to</strong> the survey team, but<br />
some effort <strong>to</strong> seek out and obtain their video and chase logs will be needed. The<br />
widespread availability of inexpensive consumer video cameras means that many<br />
63
<strong>to</strong>rnadoes have been captured on video during some or most of their tracks through<br />
populated areas. As with s<strong>to</strong>rm chasers, some effort will be needed <strong>to</strong> obtain such<br />
documentation. In some areas, television stations operate chase teams and/or s<strong>to</strong>rm<br />
spotters. Their information should be sought <strong>to</strong> provide as complete a coverage of the<br />
event as possible. This can help document such things as multiple-vortex phases of the<br />
event and satellite <strong>to</strong>rnadoes, which can be very helpful in sorting out the findings from a<br />
ground survey. It may even be possible <strong>to</strong> identify nearby downbursts from video and<br />
still images taken by chasers, citizens, or spotters.<br />
The damage path is likely <strong>to</strong> be complicated by a number of fac<strong>to</strong>rs already<br />
mentioned: asymmetries in the wind field, complex time and space structure <strong>to</strong> the<br />
windspeeds, structural characteristics of objects within the track of the <strong>to</strong>rnado, “cones of<br />
damage” produced by weak structures on the margins of the damage path, subvortices,<br />
satellite <strong>to</strong>rnadoes, downbursts occurring nearby the <strong>to</strong>rnado, bands of damaging inflow<br />
<strong>to</strong> the base of the <strong>to</strong>rnado, and so on.<br />
C. Establishing the temporal sequence of events<br />
It is not uncommon for severe s<strong>to</strong>rm reports <strong>to</strong> include erroneous information<br />
about the location and timing of <strong>to</strong>rnadoes (see Speheger et al. 2002). This can cause<br />
various problems for the survey team: events can be missed; overlapping tracks can be<br />
confused; and, so on. The s<strong>to</strong>pping of clocks does not necessarily determine the time of a<br />
damaging event; power might have been lost before the damage occurred, for instance.<br />
It’s apparent that clocks in homes and in cameras will not be synchronized <strong>to</strong> a common<br />
time, so it’s common for conflicting timing of events <strong>to</strong> be characteristic of the<br />
information going in<strong>to</strong> a survey. It requires some considerable effort <strong>to</strong> come <strong>to</strong> a timing<br />
of events that is the most likely reconciliation of all the available information.<br />
Radar data can be quite helpful in the task of producing a best estimate of the<br />
timing of events. Nevertheless, the team should be aware that even the radar data is not<br />
necessarily the ultimate standard. The timing and location of events relative <strong>to</strong> the radar<br />
echoes (and Doppler data, if available) is not a constant for all events or even from<br />
moment <strong>to</strong> moment during the same event. It will generally take several iterations, using<br />
all the available information, <strong>to</strong> develop what is a consensus solution <strong>to</strong> the timing of<br />
events. The team should seek <strong>to</strong> incorporate such information as the timing of power line<br />
breaks, but be aware that power line breaks may not pinpoint the location of the <strong>to</strong>rnado<br />
in time and space – the lines may go down before the <strong>to</strong>rnado actually reaches them, and<br />
falling lines can cause lines <strong>to</strong> break for some distance away from the <strong>to</strong>rnado. Power<br />
line breaks are just another piece of the puzzle.<br />
In some instances, good timing information can be obtained from the call logs <strong>to</strong><br />
“911” or other emergency centers. In pursuing such a source, it’s important <strong>to</strong> be able <strong>to</strong><br />
distinguish the difference between the time of the call and the time of the event.<br />
64
IV. The importance of accurate assessment<br />
Obtaining an accurate assessment of the F-scale rating is important from a number<br />
of different perspectives. The F-scale represents an explicit recognition that not all<br />
<strong>to</strong>rnadoes are the same; that is, not all <strong>to</strong>rnadoes are equally capable of damage. In the<br />
absence of direct windspeed measurements, the F-scale is derived primarily from damage<br />
assessments. There have been some limited opportunities <strong>to</strong> compare windspeeds<br />
measured using mobile Doppler radars (e.g., Wurman 2002, Burgess et al. 2002), and it<br />
appears that those observations can be roughly consistent with the damage assessments<br />
leading <strong>to</strong> the F-scale rating. Forecast and warning accuracy and skill are dependent on<br />
feedback from verification. In turn, verification necessarily depends on having accurate<br />
and comprehensive information about actual events. Therefore, s<strong>to</strong>rm damage<br />
assessments are important contribu<strong>to</strong>rs <strong>to</strong> forecast and warning improvement, by<br />
providing information about the s<strong>to</strong>rm events. If forecasts and warnings are <strong>to</strong> improve,<br />
then obtaining accurate s<strong>to</strong>rm damage assessments is a critical part of that improvement<br />
process.<br />
Society also has a need for the information provided. If there is <strong>to</strong> be a positive<br />
result from s<strong>to</strong>rm damage, it is derived from the knowledge we gain from a careful and<br />
comprehensive assessment. This includes more than just a single number (the F-scale<br />
rating), of course. Thorough mapping of the damage, establishment of the temporal<br />
sequence of events, distinguishing between <strong>to</strong>rnado and downburst damage, and so on –<br />
all these help <strong>to</strong> determine the meteorology of the event. The value of meteorology <strong>to</strong><br />
society is considerably increased when it can be combined with the engineering, in an<br />
effort <strong>to</strong> develop strategies for minimizing casualties and property damage. For example,<br />
<strong>to</strong>rnado safety rules have evolved over the years as we have learned more about<br />
<strong>to</strong>rnadoes and their effects on structures. It is likely that the learning process will<br />
continue and, therefore, the safety rules may change as a result. As we learn more about<br />
the interaction between wind and structures, improved construction practices can lead <strong>to</strong><br />
fewer casualties as well as reduced damage (Doswell and Brooks 2002, Marshall 2003).<br />
Careful damage assessment also benefits the clima<strong>to</strong>logical record of events. This<br />
record is the basis for many scientific and engineering studies, whatever its shortcomings<br />
might be. It is recognized that the existing record of events is not perfect (e.g., Doswell<br />
and Burgess 1988, Kelly et al. 1978), but it is important for many users other than<br />
meteorologists.<br />
The resources available for use in damage surveys are such that only a handful of<br />
events that represent the most devastating s<strong>to</strong>rms will be given a comprehensive<br />
assessment. However, the very infrequency of detailed surveys makes each one of them<br />
correspondingly more important. They are the benchmarks that provide the best<br />
information about significant events. Moreover, the cases chosen for comprehensive<br />
study set the standard by which routine, less detailed assessments are done. This has an<br />
impact on the whole record, not just the few cases per year that warrant a major effort.<br />
Generally speaking, it’s a challenge <strong>to</strong> go back <strong>to</strong> the existing record and have the<br />
capability <strong>to</strong> improve the accuracy of the existing data set. This makes getting it right<br />
when doing surveys in the present even more important. If we can’t fix the past very<br />
effectively, at the very least we need <strong>to</strong> set new standards for thoroughness and accuracy,<br />
65
so that the clima<strong>to</strong>logical record, as seen by our successors in the distant future, is a<br />
significant improvement over what we now have.<br />
The challenge is clear: those doing surveys need <strong>to</strong> take it upon themselves <strong>to</strong><br />
attempt <strong>to</strong> maintain high standards for their work. There may never be sufficient<br />
resources <strong>to</strong> do major surveys for more than a few cases in any given year, but each such<br />
survey team has an obligation <strong>to</strong> make their work as comprehensive and accurate as their<br />
resources permit. They need <strong>to</strong> be creative in seeking ways <strong>to</strong> magnify the resources at<br />
their disposal, and this necessitates substantial planning long before the event occurs.<br />
Everyone that is potentially involved in such a survey should consider what needs <strong>to</strong> be<br />
done <strong>to</strong> make that survey as successful as possible, even though the odds that they will<br />
actually be involved are relatively low. Surveys done on the spur of the moment, without<br />
prior “groundwork” <strong>to</strong> increase their capabilities and <strong>to</strong> get the team in<strong>to</strong> the field<br />
expeditiously, will not be able <strong>to</strong> achieve much. The keys <strong>to</strong> a well-done survey are:<br />
planning, taking advantage of personnel with needed experience, and creative use of<br />
available resources.<br />
66
Appendix A. Wind <strong>Damage</strong> <strong>to</strong> Residences <strong>Assessment</strong> Form<br />
GENERAL INFORMATION ABOUT THE HOUSE<br />
1) Name of homeowner<br />
________________________________________________________________________<br />
2) What is the house address?<br />
____________________________________________________________________<br />
3) What year was the building constructed? _____________ Building Code (if known)<br />
______________________<br />
4) What is the surrounding terrain? Urban (Exp. A), Suburban (Exp. B), Open (Exp. C),<br />
On lake/ocean (Exp. D)<br />
5) Where is the house located? In a forest, In middle of the block, At a street corner, On<br />
a hill, In a valley.<br />
6) What is the number of s<strong>to</strong>ries? 1, 1-1/2, 2, 3, split level. Describe<br />
_____________________________________<br />
7) What direction does the front of the house face? N NE E SE S SW W NW<br />
8) What is the shape of the house plan? Rectangular, L-shape, U-shape, H-shape, Other<br />
_____________________<br />
9) What type of cladding is on the house? Brick, S<strong>to</strong>ne, Wood, Vinyl, Metal,<br />
Stucco/EIFS, Other_____________<br />
10) Does the house have an attached garage? YES NO If so, is it 1, 1-1/2, 2, 3.<br />
11) What are the sizes of the garage doors? 1 car wide 2 car wide ___________feet<br />
12) Where is the attached garage located on the house? N NE E SE S SW W NW<br />
13) Which direction does the garage face? N NE E SE S SW W NW.<br />
14) What appurtenances are on the house? Awnings, Gutters, Shutters, Patio Cover,<br />
Antenna Other _________________<br />
15) What is the number and location of windows? ________________ Sliding glass<br />
doors? ___________________<br />
16) Is there a chimney? If so, what is the type and location on house?<br />
____________________________________<br />
17) What appurtenances are around the house? S<strong>to</strong>rage Shed, Fence, Air conditioner,<br />
Other Type ___________________<br />
18) What is the number and location of windows?<br />
____________________________________________________<br />
19) Location from <strong>to</strong>rnado center N NE E SE S SW W NW Estimated distance from<br />
<strong>to</strong>rnado center _____ feet.<br />
FOUNDATION COMPONENTS<br />
20) What is foundation type? Slab, Pier & Beam, Concrete, CMU, Stacked brick/block,<br />
Timber piles, Masonry, Other __________________________________<br />
21) How is the bot<strong>to</strong>m plate or sill attached <strong>to</strong> the foundation? Bolted, Shot Pin,<br />
Strapped, Clipped, Nailed, None<br />
22) Describe the number, type, interval, and length of fasteners in foundation<br />
______________________________<br />
23) Are fasteners installed correctly? YES NO If no, explain<br />
___________________________________________.<br />
67
24) Did house fail at the foundation? YES NO If yes, explain where it<br />
failed.______________________________<br />
WALL COMPONENTS<br />
25) How is the wall cladding fastened <strong>to</strong> the framing? Nailed, Stapled, Brick, Ties ,<br />
Other _________________________<br />
26) Did cladding fail? YES NO If yes, explain where it failed<br />
__________________________________________<br />
27) Are the walls standard 2 x 4's at 16 inches on centers? YES NO If no,<br />
explain___________________________<br />
28) How is the bot<strong>to</strong>m plate fastened <strong>to</strong> the stud? Straight-nailed, Toe-nailed, Strapped,<br />
or Clipped<br />
29) Describe number, type, interval, and length of fasteners at base of wall________<br />
_________________________<br />
30) Are nuts and washers secured properly on the bolts? YES NO If not,<br />
describe___________________________<br />
31) Did walls fail? YES NO. If yes, explain where it<br />
failed_____________________________________________<br />
ROOF COMPONENTS<br />
32) What is the shape of the roof? Gable, Hip, Gambrel, Shed, Flat, Mansard, Other<br />
explain__________________<br />
33) What is the type of roof covering? Asphalt shingles, wood shingle/shake, tile,<br />
metal, other ______________<br />
34) How is the roof covering fastened? Nailed, Stapled, Clipped, Loose hung on battens,<br />
Mortared_____________<br />
35) What is the age of the roof covering? ____ years<br />
36) What is the type of roof deck? Plywood, Oriented strand board (OSB), Wood plank,<br />
Other________________<br />
37) How is the roof deck attached and at what intervals? Nailed ___ inches apart<br />
Stapled at ___ inches apart<br />
38) Did roof deck fasteners penetrate in<strong>to</strong> rafters? YES NO. If no,<br />
explain________________________________<br />
39) How is the roof framed? Rafters and joists or Pre-manufactured trusses Other<br />
__________________________<br />
40) How are the rafters or trusses fastened <strong>to</strong> the <strong>to</strong>p of the walls? Toenailed, metal<br />
straps, Other _______________<br />
41) Describe number, type, interval, and length of rafter/<strong>to</strong>p plate<br />
fasteners_________________________________<br />
42) Did roof fail? YES NO. If yes, explain where it failed<br />
_____________________________________________<br />
43) Did roof covering fail? YES NO. If yes, explain where it failed<br />
_____________________________________________<br />
68
Appendix B. Illustrations for Frame Home <strong>Damage</strong> <strong>Assessment</strong><br />
Checklist<br />
Figure A2.1. Illustration of roof terminology<br />
Figure A2.2. Attachment of bot<strong>to</strong>m plate by shotpins. [Pho<strong>to</strong>graph © T. Marshall, used by permission]<br />
69
Figure A2.3. Attachment of wall studs by <strong>to</strong>enail connection. [Pho<strong>to</strong>graph © T. Marshall, used by<br />
permission]<br />
Figure A2.4. Cut nail, often powder-driven, used <strong>to</strong> attach bot<strong>to</strong>m plate <strong>to</strong> foundation slab after the<br />
concrete has hardened. Note the relatively shallow penetration of the cut nail. Often, the impact of the nail<br />
shatters the concrete, leaving the nail essentially unattached <strong>to</strong> the concrete beneath the bot<strong>to</strong>m plate.<br />
[Pho<strong>to</strong>graph © T. Marshall, used by permission]<br />
70
Figure A2.5. Bot<strong>to</strong>m plate attached with strapping <strong>to</strong> the foundation, showing straightnail connection of<br />
wall studs <strong>to</strong> the bot<strong>to</strong>m plate. The wall studs simply pulled out under lift forces, leaving the plate still<br />
attached <strong>to</strong> the foundation. [Pho<strong>to</strong>graph © T. Marshall, used by permission]<br />
Figure A2.6. Example of a metal clip reinforcing the attachment of wall studs <strong>to</strong> the bot<strong>to</strong>m plate. Note<br />
the bot<strong>to</strong>m plate is bolted <strong>to</strong> the foundation with a nut and washer. [Pho<strong>to</strong>graph © T. Marshall, used by<br />
permission]<br />
71
Figure A2.7. Example of metal clip reinforcing the attachment of the wall studs <strong>to</strong> the <strong>to</strong>p plate.<br />
[Pho<strong>to</strong>graph © T. Marshall, used by permission]<br />
Figure A2.8. Example of a metal clip reinforcing the attachment of the roof trusses <strong>to</strong> the <strong>to</strong>p plates.<br />
[Pho<strong>to</strong>graph © T. Marshall, used by permission]<br />
72
Appendix C. Procedure for Assessing Wind <strong>Damage</strong> <strong>to</strong> Wood<br />
Framed Residences<br />
Timothy P. Marshall* and James D. Weirthorn (Haag Engineering Co.), and William F.<br />
Bunting, NWS Dallas/Fort Worth, TX.<br />
Presented at THE SYMPOSIUM ON THE FUJITA SCALE AND SEVERE WEATHER<br />
DAMAGE ASSESSMENT, 83rd Annual Meeting, American Meteorological Society,<br />
Long Beach, CA., February 10, 2003.<br />
1. INTRODUCTION<br />
The authors have developed a procedure for assessing wind damage <strong>to</strong> wood-framed<br />
residences. This procedure has been utilized by the authors for the past twenty years<br />
when determining the extent of damage <strong>to</strong> buildings from <strong>to</strong>rnadoes, hurricanes, and<br />
straight-lined winds. In order <strong>to</strong> develop the procedure, the authors have compiled<br />
information on various building construction techniques as well as analyzed how wind<br />
forces interact with buildings and their environments. There are a number of helpful<br />
references on the subject including papers by Minor et al. (1977) and Bunting and Smith<br />
(1990). Many myths associated with wind effects on buildings have been discussed by<br />
Minor (1976, 1982) and Marshall (1992).<br />
This paper presents an overview of how wood-framed residences are constructed as<br />
well as how they fail. We will discuss how <strong>to</strong> recognize flaws or "weak links" in<br />
buildings that cause them <strong>to</strong> fail at relatively low wind speeds. It is hoped that this<br />
procedure will help inspec<strong>to</strong>rs better determine F-scale ratings (see Fujita, 1971).<br />
Although this paper is limited <strong>to</strong> wood-framed residences, the general principles can be<br />
applied <strong>to</strong> other types of buildings.<br />
2. LOGISTICS<br />
It is important <strong>to</strong> begin assessing the damage as soon as possible after the s<strong>to</strong>rm as<br />
cleanup operations begin immediately. Important weather information can be gathered<br />
and interviews with local National Weather Service Officials are helpful. Local officials<br />
can be contacted <strong>to</strong> obtain permission <strong>to</strong> enter the disaster area just after the event.<br />
Business cards and magnetic signs provide identification. Sometimes hard hats are<br />
required when entering damaged buildings. With major disasters, other s<strong>to</strong>rm damage<br />
teams from the Federal Emergency Management Agency (FEMA), National Association<br />
of Home Builders (NAHB), National Weather Service (NWS), National Roofing<br />
Contrac<strong>to</strong>rs Association (NRCA), as well as various university-sponsored teams might<br />
be in the area. These teams eventually will publish s<strong>to</strong>rm damage summaries that may be<br />
helpful. An aerial survey can help provide an overall extent of the damage path quickly<br />
and interesting areas can be identified for later study on the ground.<br />
___________<br />
*Corresponding author address: Timothy P. Marshall, Haag Engineering Co., 2455 S. McIver Dr.,<br />
Carroll<strong>to</strong>n, TX 75381. Email: timpmarshall@cs.com<br />
73
It is important <strong>to</strong> have proper equipment for inspecting damaged buildings. Detailed<br />
road maps are essential. Still and video cameras can be utilized <strong>to</strong> document the damage.<br />
A wide-angle lens helps capture the overall damage scene whereas a zoom lens captures<br />
specific details. A second camera is a good idea <strong>to</strong> serve as a backup in case the first<br />
camera malfunctions. Faster film speeds help freeze images when moving. Wearing dark<br />
clothes also limits camera reflections. A notepad with writing pens and a tape recorder<br />
are beneficial <strong>to</strong> record pho<strong>to</strong>graph locations and observations. A tape measure is helpful<br />
<strong>to</strong> determine the distances between objects and fasteners as well as obtain dimensions of<br />
building components and projectiles. A hand-held GPS (global positioning system)<br />
receiver can help pinpoint ground locations especially if road signs are destroyed.<br />
3. GENERAL INFORMATION<br />
There are many characteristics about a home and its surroundings that should be<br />
documented. An easy-<strong>to</strong>-use "questionnaire" summarizing essential information is<br />
included in Appendix A. The name and address of the homeowner are important <strong>to</strong><br />
locate the house on a map. Also, the year the house was built can determine what<br />
building code(s) were in effect. First, walk around the house <strong>to</strong> determine how<br />
susceptible it was <strong>to</strong> the wind. Homes in urban, suburban, and forested areas may be<br />
shielded somewhat from the wind. In contrast, homes situated in open, unobstructed<br />
terrain, on hills, besides lakes or oceans, on street corners or at the end of city blocks may<br />
be more exposed <strong>to</strong> the wind. Document any debris (i.e. trees or other building<br />
components) that impacted the home.<br />
Items susceptible <strong>to</strong> wind around the house include air conditioners, s<strong>to</strong>rage sheds,<br />
fences, trees, and backyard items like lawn furniture, portable spas, and trampolines.<br />
Items susceptible <strong>to</strong> wind on the house include awnings, gutters, shutters, patio covers,<br />
television antennas, chimneys, siding, windows, fascia and soffit trim.<br />
Certain building configurations are more likely <strong>to</strong> sustain wind damage. In general, the<br />
higher the building, the more it is exposed <strong>to</strong> the wind and greater its potential for<br />
damage. Also, homes not anchored properly can slide off their foundations at relatively<br />
low wind speeds. Homes with attached garages sustain greater wind damage when the<br />
garage doors fail inward allowing wind pressure <strong>to</strong> lift the garage roof or push the garage<br />
walls outward. High profile gable roofs are more prone <strong>to</strong> wind damage than low profile<br />
hip roofs.<br />
Wind interacting with a house is deflected over and around it. Inward pressure is<br />
applied <strong>to</strong> the windward walls and outward pressure is applied <strong>to</strong> side and leeward walls.<br />
Uplift pressure is applied <strong>to</strong> the roof especially along windward eaves, roof corners, and<br />
leeward ridges. The roof is particularly susceptible <strong>to</strong> wind damage since it is the highest<br />
building component above the ground. If the building is breached, wind enters creating<br />
internal pressures that can lift off the roof. Thus, damage <strong>to</strong> a home from wind typically<br />
begins at roof level and progresses downward and inward. The last place wind damage<br />
occurs is <strong>to</strong> the interior of the home. Catastrophic damage <strong>to</strong> a home usually occurs with<br />
failure of wall/foundation connections or roof/wall connections. Therefore it is important<br />
<strong>to</strong> examine these critical areas on a building.<br />
4. FOUNDATION EXAMINATION<br />
There are six common types of house foundations: 1) concrete slab, 2) pier and beam,<br />
3) poured concrete wall, 4) concrete masonry wall, 5) stacked brick or block, and 6)<br />
timber piles or masonry and concrete columns. The inspec<strong>to</strong>r may encounter one or more<br />
74
of these foundation types in their damage survey. In general, homes on concrete slab<br />
foundations are usually found in the south and southwest U.S. Homes with basements or<br />
crawl spaces usually have poured concrete or masonry walls and are found in the upper<br />
Midwest and southeast. Houses on stacked brick or blocks typically are found in rural<br />
areas, especially in the southern United States. Timber piles and masonry or concrete<br />
columns are utilized <strong>to</strong> support homes in coastal and flood-prone areas.<br />
4.1 CONCRETE SLAB FOUNDATIONS<br />
Homes on concrete slab foundations usually are bolted or strapped <strong>to</strong> their foundations.<br />
However, some municipalities have adopted variances in the building codes that allow<br />
shot pins or cut nails. Figure 1 shows common types of foundation anchors.<br />
Figure 1. Common types of foundation fasteners.<br />
Anchor bolts are at least 1.3 cm (1/2 inch) in diameter and 30 cm (12 inches) long and<br />
have a J-shaped profile that provides significant pull-out resistance. The anchor bolt is<br />
inserted in<strong>to</strong> the concrete slab while it is poured with a depth of at least seven inches and<br />
must have sufficient height above the slab <strong>to</strong> pass through the plate and accept a steel nut<br />
and washer. Anchor bolts are spaced 1 <strong>to</strong> 2 meters (3 <strong>to</strong> 6 feet) apart and located within<br />
30 cm (12 inches) of the end of the plate and wall corners (Figure 2).<br />
Figure 2. Properly bolted bot<strong>to</strong>m plate. However, note the weak straight-nailed connection between the<br />
wall studs and bot<strong>to</strong>m plates.<br />
Anchor bolts must be inserted properly in<strong>to</strong> the concrete slab foundation. We have<br />
found anchor bolts placed <strong>to</strong>o deep in the concrete <strong>to</strong> engage the nuts. We also have<br />
found bolts placed outside or inside of the wooden sills or bot<strong>to</strong>m plates. Thus, these<br />
75
homes were not anchored <strong>to</strong> their foundations. Also, nuts and washers must be fitted on<br />
the anchor bolts and tightened snug <strong>to</strong> secure the plates. This might seem obvious,<br />
however, we have found numerous bolted plates and sills without nuts or washers. A<br />
properly anchored sill or bot<strong>to</strong>m plate is a strong connection and rarely fails. Instead,<br />
failure of the home is more likely where the wall stud is nailed <strong>to</strong> the bot<strong>to</strong>m plate<br />
(Figure 3). Therefore, homes that are bolted down <strong>to</strong> their foundations are not<br />
necessarily well-built or wind resistant.<br />
Figure 3. Failure of this home occurred where the wall stud was nailed <strong>to</strong> the bot<strong>to</strong>m plate.<br />
The bot<strong>to</strong>m plate is either straight-nailed in<strong>to</strong> the wall stud and/or the wall stud is<br />
<strong>to</strong>enailed in<strong>to</strong> the bot<strong>to</strong>m plate (Figure 4). A pair of 16d (8.9 cm or 3.5 in) common nails<br />
often are used for this connection. Although such a connection will meet the minimum<br />
requirements in most building codes, it is inherently weak when uplifted (Figure 4).<br />
Figure 4. Typical wall cross section on concrete slab foundation showing a bot<strong>to</strong>m plate bolted <strong>to</strong> the<br />
foundation and straight-nailed in<strong>to</strong> the wall stud. Connections and failure points ("F") are in red.<br />
Marshall (1983) conducted pull tests on pairs of 16d nails that connected plates <strong>to</strong><br />
studs. For straight-nailed connections, the average pull-out strength was 984 N (220 lbs.)<br />
with a standard deviation of 375 N (84 lbs). For <strong>to</strong>enailed connections, the average pullout<br />
strength was 1313 N (295 lbs) with a standard deviation of 304 N (68 lbs). Canfield<br />
et al. (1991) conducted similar pull tests with similar results. However, they could<br />
increase the average pull-out strength <strong>to</strong> 1842 N (414 lbs) if the wood did not split when<br />
nailed. By comparison, Canfield et al. (1991) also conducted pull tests on metal<br />
“hurricane” clips and found an average strength of 5341 N (1200 lbs) depending on the<br />
76
type of clip used. Thus, a metal clip can be about three times stronger than a 16d (8.9 cm<br />
or 3.5 in) <strong>to</strong>enailed connection (Figure 5).<br />
Figure 5. A metal clip connecting the wall stud <strong>to</strong> the bot<strong>to</strong>m plate provides considerably more uplift<br />
resistance than conventional straight- or <strong>to</strong>e- nailing.<br />
Besides anchor bolts, bot<strong>to</strong>m plates are attached <strong>to</strong> the concrete slab with metal straps,<br />
shot pins, or cut nails. Metal straps can be just as effective as bolts in anchoring the<br />
bot<strong>to</strong>m plate <strong>to</strong> the foundation if they have proper thickness and are installed correctly<br />
(Figure 6). The straps are typically made from 18 gauge metal (1.2 mm or .0478 inches)<br />
and are perforated for the fasteners. Steel shot pins look like thick nails and literally are<br />
shot in<strong>to</strong> the foundation with a powder actuated hammer. Shot pins are typically 7.6 cm<br />
(3 inches) long and have an accompanying washer (Figure 7). Unfortunately, cut nails<br />
sometimes are used <strong>to</strong> secure the bot<strong>to</strong>m plates <strong>to</strong> the foundations. Cut nails are easily<br />
pulled through the bot<strong>to</strong>m plate when the plate is uplifted or rotated. Building codes do<br />
not allow the use of cut nails, however, some building officials have allowed cut nails <strong>to</strong><br />
secure interior (not perimeter) walls. Unfortunately, we have found many homes where<br />
cut nails were installed around the perimeter of the foundation (Figure 8).<br />
Figure 6. Metal straps held the bot<strong>to</strong>m plate in place, however, failure occurred where the wall stud was<br />
straight-nailed through the bot<strong>to</strong>m plate.<br />
77
Figure 7. Shot pin with attached washer in the bot<strong>to</strong>m plate. Inset pho<strong>to</strong> shows aftermath of <strong>to</strong>rnado<br />
where bot<strong>to</strong>m plate broke around the fasteners.<br />
Figure 8. Cut nail in the perimeter bot<strong>to</strong>m plate was a violation of the local building code. Inset<br />
pho<strong>to</strong>graph A shows scrape mark in the slab after wall slid off foundation. Inset pho<strong>to</strong>graph B is a cut nail<br />
left in the foundation after home was blown away.<br />
4.2 PIER AND BEAM FOUNDATIONS<br />
Pier and beam foundations usually are made of different materials. Piers can be wood,<br />
loose block, masonry, or concrete. Perimeter grade beams are usually poured-in-place<br />
concrete or masonry. The same types of anchors are used <strong>to</strong> secure the house <strong>to</strong> the<br />
beams as with concrete slab foundations. However, floors are supported by the piers and<br />
Figure 9. Typical pier and beam foundation showing connections and failure points (in red). However,<br />
piers are rarely attached <strong>to</strong> the flooring (circled).<br />
78
arely anchored (Figure 9). Note the floor platform separates the walls from the<br />
foundation, resulting in more nailed connections. In general, the more nailed connections<br />
in a foundation, the greater the chances for a poor connection. The authors have<br />
identified failures at each of the nailed location points in this type of foundation.<br />
Usually, the anchor bolted sill plate remains. Homes on pier and beam foundations tend<br />
<strong>to</strong> shift off their foundations and sustain more catastrophic damage (Figure 10).<br />
Figure 10. This home shifted and disintegrated from its wooden pier and concrete beam foundation. Floor<br />
joists were not attached <strong>to</strong> the piers.<br />
4.3 POURED CONCRETE WALL FOUNDATIONS<br />
Poured concrete wall foundations are found in homes that have basements or crawl<br />
spaces. A concrete footing supports the foundation wall. The wooden sill plate is either<br />
bolted or strapped around the perimeter of the foundation. Floor joists typically are<br />
<strong>to</strong>enailed <strong>to</strong> the sill plate. A center beam extends across the middle of the basement or<br />
crawl space and is supported by columns and slotted in<strong>to</strong> the perimeter wall. The center<br />
beam and columns are either wood or steel (Figure 11).<br />
Figure 11. Typical cross section of a poured concrete wall foundation showing nailed and bolted<br />
connections with failure points (in red) and strapped connections (in blue). Center beam is wood or steel.<br />
A common failure point is where the bot<strong>to</strong>m plate is secured <strong>to</strong> the floor. The bot<strong>to</strong>m<br />
plate is straight nailed <strong>to</strong> the floor at certain intervals and the nails usually miss the<br />
underlying floor joists. Thus, this connection has little resistance <strong>to</strong> lateral wind loads and<br />
the connection simply pulls apart as the wall is rotated (Figure 12). In many instances, the<br />
79
authors have found nails driven in<strong>to</strong> the open joint between the rim joist and the floor<br />
joist leaving the wall virtually unattached. The floor platform usually remains if properly<br />
anchored <strong>to</strong> the foundation.<br />
Figure 12. Straight-nailed bot<strong>to</strong>m plate pulled out of the floor as the wall rotated. This was an inherently<br />
weak connection (circled).<br />
A more catastrophic failure occurs when the connection between the floor joists and sill<br />
plate fails. This results in the entire home sliding off its foundation. The authors also<br />
have found no attachment of the center beam <strong>to</strong> the floor joists especially if the center<br />
beam was steel. Also, doors and windows in the foundation wall can weaken its lateral<br />
resistance leading <strong>to</strong> overturning of the foundation wall (Figure 13).<br />
Figure 13. Exit door weakened the concrete wall foundation (circled). The foundation wall rotated and<br />
broke apart at the opposite corner. Steel rebar was used only at the wall corners. The house was pushed<br />
in<strong>to</strong> the ravine in the background.<br />
4.4 MASONRY FOUNDATION WALLS<br />
Masonry wall foundations are constructed with concrete masonry units (CMU). These<br />
units have open cells that are stacked in a common pattern with mortared joints. The<br />
connection of the house <strong>to</strong> the foundation is similar <strong>to</strong> that of concrete foundation walls.<br />
However, the <strong>to</strong>p cell is usually filled with mortar or concrete where the anchor bolts or<br />
straps are placed (Figure 14).<br />
80
Figure 14. Typical cross section of a masonry wall foundation showing nailed and bolted connections (in<br />
red) and strapped connections (in blue). Center beam is wood or steel. Failure of this foundation type<br />
frequently occurs at areas denoted by the letter "F".<br />
Unreinforced concrete masonry foundations are inherently weak in resisting lateral and<br />
uplift forces and frequently fail causing the house <strong>to</strong> slide along with the <strong>to</strong>p row of<br />
concrete masonry (Refer <strong>to</strong> Figure 15). Interestingly, building codes in high wind areas<br />
require steel reinforcement <strong>to</strong> extend through the cells all the way down in<strong>to</strong> the footing.<br />
Figure 15. This home shifted off its foundation when the masonry foundation failed. Inset pho<strong>to</strong>graph A<br />
shows that the <strong>to</strong>p row of masonry was attached with J-bolts as shown in inset pho<strong>to</strong>graph B. Note how<br />
little damage there was <strong>to</strong> the roof.<br />
4.5 LOOSE BRICK OR BLOCK FOUNDATIONS<br />
Homes constructed on loosely stacked brick or block foundations are not anchored and<br />
can be easily shifted from their foundations (Figure 16). Such homes can be "swept<br />
clean" from their foundations resulting in F-5 damage on the Fujita scale with wind<br />
speeds less than 45 m/s (100 mph).<br />
81
Figure 16. Unanchored home on stacked CMU foundation slid 90m (295 ft) off its foundation.<br />
4.6 PILE OR COLUMN FOUNDATIONS<br />
Homes elevated on timber pilings, or concrete or masonry columns usually have<br />
substantial anchoring of the floor system. Weak points in this type of construction are<br />
where the bot<strong>to</strong>m plates are nailed <strong>to</strong> the floors or where the wall studs are nailed <strong>to</strong> the<br />
bot<strong>to</strong>m plates. Use of hurricane clips or straps can provide a much stronger connection<br />
provided they are installed properly and are protected from corrosion due <strong>to</strong> salt<br />
Figure 17. Typical cross section of home elevated on timber piles, concrete or masonry columns. Floors<br />
are usually bolted or strapped <strong>to</strong> the columns (in red). Common failure points are the nailed connections<br />
where the wall is attached <strong>to</strong> the floor.<br />
Figure 18. Wind damage <strong>to</strong> a home elevated on timber piles. Failure commonly occurs where the walls are<br />
attached <strong>to</strong> the floor.<br />
82
exposure. Wind damage <strong>to</strong> these homes usually involves loss of the walls leaving the<br />
floor intact (Figures 17 and 18).<br />
Although rare, the pilings or columns can fail when they are not adequately braced or<br />
extend sufficiently below grade.<br />
5. WALL EXAMINATION<br />
Wood-framed walls need <strong>to</strong> be braced properly <strong>to</strong> stiffen the frame and resist racking<br />
from lateral loads. At a minimum, diagonal bracing or "let-ins" are required at all wall<br />
corners. Typically, wall studs are notched <strong>to</strong> receive a wooden board that extends<br />
diagonally from the <strong>to</strong>p plate at the wall corner <strong>to</strong> the bot<strong>to</strong>m plate and is nailed <strong>to</strong> the<br />
studs. Plywood or oriented strand board (OSB) is some times utilized at the wall corners,<br />
especially when diagonal bracing cannot be installed due <strong>to</strong> an intervening window or<br />
door (Figure 19).<br />
Loss of brick veneer is a common problem due <strong>to</strong> improper attachment of the masonry<br />
<strong>to</strong> the wood- framed wall. Corrugated brick ties or wires must be imbedded at least two<br />
inches in<strong>to</strong> the mortar joints and attached properly <strong>to</strong> the wall. Walls that are not<br />
attached properly are free-standing and can be moved even by applying hand pressure.<br />
Such walls can <strong>to</strong>pple easily in relatively low winds (Figure 20).<br />
Figure 19. Installation of solid sheathing at wall corners helps stiffen the frame. Top plate clips as shown<br />
in inset pho<strong>to</strong>graph A and diagonal bracing as shown in inset pho<strong>to</strong>graph B also stiffen the frame.<br />
Figure 20. Brick ties (circled) were installed on this home but not engaged in<strong>to</strong> the mortar joints. As a<br />
result, wind easily <strong>to</strong>ppled this unanchored wall.<br />
83
Weak links in wall systems are large windows or doors that interrupt the continuity of<br />
the framing. In addition, failure of windows and doors allows wind <strong>to</strong> enter the building<br />
increasing internal pressures that can help lift the roof and push out perimeter walls.<br />
Garage doors are inherently weak and often fail in wind speeds as low as 36 m/s (80<br />
mph). The doors buckle or pop off the door tracks allowing the wind <strong>to</strong> enter the garage<br />
(Figure 21).<br />
Figure 21. Inward failure of garage door led <strong>to</strong> outward failure of sidewall and collapse of the garage.<br />
Note little damage <strong>to</strong> remainder of home.<br />
6. ROOF EXAMINATION<br />
Roof systems typically are held in place by gravity. Thus, minimal attention is given<br />
<strong>to</strong> wind uplift effects. Typically, the rafters or trusses are <strong>to</strong>enailed <strong>to</strong> the wall <strong>to</strong>p plates<br />
and this type of connection will meet most building codes (Figure 22). However, this<br />
connection is inherently weak when uplifted. Rafters or trusses will break away from the<br />
<strong>to</strong>p plates. It is less common for the <strong>to</strong>p plates <strong>to</strong> separate. Metal straps or clips can<br />
secure all of these members <strong>to</strong>gether.<br />
Figure 22. Typical cross section of roof/wall <strong>to</strong>p plate showing nailed connections and common failure<br />
points (in red).<br />
The authors have found numerous examples where rafters and trusses were not fastened<br />
adequately <strong>to</strong> the wall <strong>to</strong>p plates. Nails had split the wood or were driven through knots<br />
or other defects in the wood (Figure 23). As a result, the entire roof was susceptible <strong>to</strong><br />
being removed in relatively low wind speeds. Properly installed hurricane clips or metal<br />
straps can strengthen this connection greatly. A house that is missing its roof usually had<br />
poor attachments at the <strong>to</strong>ps of the walls.<br />
84
Figure 23. Nails driven through rafters and ceiling joists protruded through the <strong>to</strong>p plate and split the<br />
wood. A better connection would have been <strong>to</strong> install metal clips as shown in the inset pho<strong>to</strong>graph that<br />
places the nails in shear (strong) instead of tension (weak).<br />
Rafters and trusses require proper cross bracing <strong>to</strong> resist lateral wind forces.<br />
Installation of ridge blocking and metal brackets can prevent the trusses from falling<br />
down like dominoes. Although gable ends are non-structural components, they are<br />
susceptible <strong>to</strong> being blown inward or outward depending on the wind direction (Figure<br />
24).<br />
Figure 24. Toppled roof trusses due <strong>to</strong> a lack of lateral bracing. A metal bracket (inset pho<strong>to</strong>graph) along<br />
with proper wooden blocking between the trusses would have prevented rotation of the trusses.<br />
The shape of the roof also will determine its wind resistance. In general, gable and flat<br />
roofs are not as strong structurally as hip roofs. Hip roofs are more streamlined and are<br />
structurally stronger as each slope is supported by intersecting planes of the roof. This is<br />
one reason why many homes in hurricane prone areas have low-pitched, hip style roofs.<br />
Roof decking is typically plywood, oriented strand board (OSB), or wooden boards.<br />
The decking is fastened at six-inch intervals and fasteners must penetrate in<strong>to</strong> the<br />
underlying rafters or trusses. Commonly, pneumatic guns are used <strong>to</strong> drive fasteners in<strong>to</strong><br />
the decking and in some instances, the fasteners miss the underlying framing. As a result,<br />
the roof deck is not attached and is quite susceptible <strong>to</strong> being removed in the wind. The<br />
authors have found entire sheets of plywood fully clad with roof shingles in the debris<br />
around the home. Exposure of the rafters and trusses usually indicates inadequate deck<br />
attachment (Figure 25).<br />
85
Figure 25 House that lost all of its roof decking on the leeward slope. Close inspection revealed that<br />
staples missed the underlying rafters (inset pho<strong>to</strong>graph).<br />
There are many different types of roofing materials on residences including asphalt<br />
shingles, tile, metal, wood shingles, shakes, etc. Each industry has guidelines available<br />
for proper installation of the roofing product. Installation instructions usually are printed<br />
on labels accompanying the roofing product indicating the proper size, number and<br />
spacing of fasteners. Roof coverings also must meet the minimum wind uplift<br />
requirements as stated in the building codes. However, the authors have found numerous<br />
deficiencies with installations of roof coverings that have led <strong>to</strong> their removal in<br />
relatively low wind speeds (Figure 26). Common roof installation errors include placing<br />
fasteners <strong>to</strong>o high on the product, overdriving, under-driving, or orienting the fasteners<br />
incorrectly. Tile roofs secured with mortar tend <strong>to</strong> unbond leading <strong>to</strong> tile removal.<br />
Figure 26. Poor installation of the roof covering on this home led <strong>to</strong> its complete removal. Staples were<br />
installed crooked and under-driven (inset pho<strong>to</strong>graph).<br />
7. DETERMINING THE F-SCALE RATING<br />
Fujita (1971) developed the F-scale <strong>to</strong> rate the severity of wind damage <strong>to</strong> buildings.<br />
He rated homes from 0 <strong>to</strong> 5 based on the increasing severity of damage <strong>to</strong> “wellconstructed”<br />
or “strong” wood-framed houses. The terms "well-constructed" and<br />
"strong" are subjective and debatable. Most homes have nailed connections, and these<br />
connections are inherently weak especially when wood members are fastened <strong>to</strong>gether in<br />
tension. Also, homes are not homogeneously constructed, so rating them without regard<br />
<strong>to</strong> knowing how they are constructed (or failed) will introduce large errors. Fujita (1992)<br />
realized this and introduced corrections <strong>to</strong> the F-scale <strong>to</strong> account for variations in<br />
86
uilding strength but did not provide an explanation of how <strong>to</strong> employ such corrections.<br />
Therefore, the authors provide the following descrip<strong>to</strong>rs <strong>to</strong> aid the inspec<strong>to</strong>r in assigning<br />
F-scale damage ratings.<br />
Homes rated F0 lost a few roof shingles, windows, some siding, a chimney, a garage<br />
door or carport. Homes rated F1 lost a small portion of the roof structure and/or suffered<br />
collapse of the garage. Homes with F2 damage lost most of their roof but the exterior<br />
walls remained. However, if the roof was not fastened properly <strong>to</strong> the walls, the F-scale<br />
rating is reduced one. F3 homes lost their roof and exterior walls. However, if the roof<br />
or walls were not fastened properly, the F-scale rating is reduced one. An F4 rating<br />
means the house was reduced <strong>to</strong> a pile of debris on the foundation. However, if the roof<br />
or walls were not fastened properly, the house damage rating is reduced by two F-scale<br />
numbers or <strong>to</strong> the damage rating of the adjacent house(s). An F5 rating still means a<br />
house was swept away from its foundation. However, if the roof and walls were not<br />
fastened properly, the house damage rating is reduced by three F-scale numbers or <strong>to</strong> the<br />
damage rating of the adjacent house(s).<br />
Fujita (1971) also assigned wind speed ranges that would cause F-scale damage. The<br />
wind speed ranges were derived empirically and have been determined by Minor et<br />
al.(1977) and others <strong>to</strong> be <strong>to</strong>o high, especially at the higher F-scale numbers. Marshall<br />
(2002) showed that most wood-framed buildings suffered significant damage with wind<br />
velocities of only 45 m/s (100 m.p.h.), and most wood-framed houses are leveled by<br />
winds exceeding 62 m/s (140 m.p.h.). Interestingly, the design wind speed for most of<br />
the U.S. is a three-second gust of 41 m/s (90 m.p.h.) at 10 m (33 feet) above the ground in<br />
open, unobstructed terrain (Exposure C).<br />
8. SUMMARY<br />
Inspecting a house for wind damage involves careful examination of the building<br />
components from the ground, up. This paper presented a procedure for inspecting woodframed<br />
buildings for wind damage. Common weak links associated with nailed<br />
connections were discussed and many examples were presented. A questionnaire was<br />
developed by the authors <strong>to</strong> aid inspec<strong>to</strong>rs in assessing a house for wind damage and<br />
assigning an F-scale rating.<br />
9. ACKNOWLEDGEMENTS<br />
Thanks <strong>to</strong> S<strong>to</strong>ney Kirkpatrick for reviewing this paper.<br />
10. REFERENCES<br />
Bunting, W. F., and B. E. Smith, 1990: A guide for conducting damage surveys. NOAA<br />
Tech. Memo. NWS SR-146, 44 pp. [NTIS Accession No. PB93-148427INZ]<br />
Canfield, L. R., S. Niu, and H. Liu, 1991: Uplift resistance of various rafter-wall<br />
connections. Forest Prod. J., 41, 27-34.<br />
87
Fujita, T. T., 1971: Proposed characterization of <strong>to</strong>rnadoes and hurricanes by area and<br />
intensity. SMRP Research Rep. 91, University of Chicago, Chicago, IL, 15 pp.<br />
_____, 1992: Mystery of Severe S<strong>to</strong>rms. The University of Chicago Press, 298 pp.<br />
Marshall, T. P., 1983: Utilization of load and resistance statistics in a wind speed<br />
assessment. M.S. thesis, Department of Atmospheric Sciences, Texas Tech University, 91<br />
pp.<br />
_____, 1992: Lessons learned from analyzing <strong>to</strong>rnado damage. The Tornado: Its<br />
Structure, Dynamics, Prediction, and Hazards, C. Church, D. Burgess, C. Doswell, and<br />
R. Davies-Jones, Eds., Amer. Geophys. Union, 495-499.<br />
_____, 2002: Tornado damage survey at Moore, Oklahoma, Weather and Forecasting,<br />
17, 582-598.<br />
Minor, J. E., 1976: Applications of <strong>to</strong>rnado technology in professional practice, in<br />
Proceedings of the Symposium on Tornadoes, Texas Tech University, Lubbock, pp. 375-<br />
392.<br />
Minor, J. E., J. R. McDonald, and K. C. Mehta, 1977: The <strong>to</strong>rnado: An engineeredoriented<br />
perspective. NOAA Tech. Memo. ERL-NSSL-82, 196 pp. [NTIS Accession<br />
No. PB93-148435INZ]<br />
Minor, J. E., 1982: Advancements in the perceptions of <strong>to</strong>rnado effects (1960-1980), in<br />
Preprints of the Twelfth Conference on Severe Local S<strong>to</strong>rms, American Meteorological<br />
Society, Bos<strong>to</strong>n, Mass. pp. 280-288.<br />
88
Appendix D. Equipment Checklists<br />
Team Equipment:<br />
Short-range radios ___<br />
Cameras<br />
Still cameras for each member ___<br />
Film for still cameras ___<br />
Video cameras ___<br />
Videotapes ___<br />
Credentials ___<br />
Detailed local maps ___<br />
Tape measure (100 ft) ___<br />
First aid kit ___<br />
Equipment for individuals:<br />
Credentials ___<br />
Hard Hat ___<br />
Safety shoes or leather boots ___<br />
Sunglasses ___<br />
Flashlight ___<br />
Note pad ___<br />
Pencils and/or pens ___<br />
Sunscreen ___<br />
Rain gear ___<br />
Water ___<br />
Snacks ___<br />
Day pack ___<br />
Work gloves ___<br />
Camera(s) ___<br />
Camera supplies (film, tapes, batteries, etc.) ___<br />
Flash for camera ___<br />
Tape measure (10-12 ft) ___<br />
89
Appendix E. Aerial Survey Operation Strategy<br />
The most important reason for an aerial survey is <strong>to</strong> provide a comprehensive<br />
overview of the damage (an excellent discussion of aerial surveys can be found in Fujita<br />
and Smith [1993]). If possible, the aerial survey should begin as soon after the event as<br />
is possible. During an aerial survey, it is important <strong>to</strong> identify key locations that should<br />
also be surveyed from the ground; notably, areas of the most intense damage.<br />
An important component of an aerial survey is <strong>to</strong> obtain a mapping of the location<br />
and orientation of debris; for example, the alignment of fallen trees, and the direction of<br />
debris deposition. This is important information for trying <strong>to</strong> distinguish between<br />
<strong>to</strong>rnado and downburst damage.<br />
Assuming that at least one aircraft is available, then certain strategies should be<br />
followed, if possible.<br />
1. If a fixed-wing aircraft is used, it should be a single-engine, high-wing aircraft. A<br />
low-wing aircraft or one with multiple engines can obstruct downward viewing angles.<br />
2. Wear a dark shirt <strong>to</strong> minimize the effect of reflections of your apparel in the windows.<br />
3. Bring some means for cleaning the windows of the aircraft before takeoff, and be<br />
prepared <strong>to</strong> remove condensation from them during the flight.<br />
4. Be certain that any still camera’s shutter speed control is set <strong>to</strong> 1/500 s, in order <strong>to</strong><br />
reduce the effect of movement on the sharpness of the images.<br />
5. Go over the survey plan in detail with the pilot before take-off, and be certain that the<br />
pilot is willing and able <strong>to</strong> fly the survey as desired. Note that the sun angle can be a<br />
fac<strong>to</strong>r in the effectiveness of the aerial pho<strong>to</strong>graphs. Since this changes during the day,<br />
sun angle might be important in planning.<br />
6. If possible, an attempt should be made <strong>to</strong> overview as much area as possible, <strong>to</strong><br />
attempt <strong>to</strong> find all the damage paths within the survey area and <strong>to</strong> determine which are<br />
likely <strong>to</strong> be associated with <strong>to</strong>rnadoes. This will involve some sort of relatively highlevel<br />
search pattern over the area <strong>to</strong> be surveyed.<br />
7. Once <strong>to</strong>rnado tracks are located, the plane should fly along the entire track at a height<br />
that makes it possible <strong>to</strong> see the entire path width. For narrow tracks, this generally will<br />
be lower than for wide tracks. During this overflight of the track, the damage path should<br />
be mapped as accurately as possible using detailed maps.<br />
8. After mapping the track, fly along the entire track again <strong>to</strong> take high-level, obliqueangle<br />
pho<strong>to</strong>graphs along the track, for reference when analyzing the damage. Again, be<br />
alert <strong>to</strong> the effect of the sun angle in revealing features along the track, especially ground<br />
markings and vegetation damage. This might require some circling <strong>to</strong> explore the best<br />
viewing angle at the time for making the subject stand out.<br />
90
9. After obtaining the oblique reference pho<strong>to</strong>graphs, yet another relatively high-level<br />
flight along the path should be done, this time with the aircraft banked so that<br />
pho<strong>to</strong>graphs from a nearly vertical angle along the track can be obtained. The level of<br />
the flight should be as constant as possible, at a height such that the entire width of the<br />
track at its widest point fits entirely within the viewfinder, and successive pho<strong>to</strong>graphs<br />
should overlap by about 20% or so. This permits a reconstruction of the entire track.<br />
10. Finally, a low-level flight along the track should be done <strong>to</strong> obtain detailed<br />
pho<strong>to</strong>graphs of various points of interest along the track: cycloidal multiple-vortex<br />
marks, severely damaged structures, severe tree damage, debris tracks where large<br />
objects have left ground marks from being dragged or tumbled along the surface, unusual<br />
damage, and so on., Be alert for areas of damage not directly in the main track, that<br />
might indicate satellite vortices, nearby downbursts, “cones of damage” leading in<strong>to</strong> the<br />
main track, isolated vortex “spin-ups” , etc.<br />
91
References<br />
Adlerman, E.J., and K.K. Droegemeier, 2002: The sensitivity of numerically simulated<br />
cyclic mesocyclogenesis <strong>to</strong> variations in model physical and computational<br />
parameters. Mon. Wea. Rev., 130, 2671-2691.<br />
BPAT, 1999: Midwest Tornadoes of May 3, 1999: Observations, Recommendations, and<br />
Technical Guidance. FEMA 342, Federal Emergency Management Agency,<br />
Mitigation Direc<strong>to</strong>rate, Washing<strong>to</strong>n, D.C., 195 pp.<br />
Bunting, W. F., and B. E. Smith, 1993: A guide for conducting convective winds<strong>to</strong>rm<br />
surveys. NOAA Tech. Memo NWS SR146, Scientific Services Division,<br />
Southern Region, Fort Worth, Texas, 44 pp.<br />
Burgess, D.W., V.T. Wood, and R.A. Brown, 1982: Mesocyclone evolution statistics.<br />
Preprints, !2th Conf. Severe Local S<strong>to</strong>rms, San An<strong>to</strong>nio, TX, Amer. Meteor. Soc.,<br />
422-424.<br />
Burgess, D.W., M.A. Magsig, J. Wurman, D.C. Dowell, and Y. Richardson, 2002: Radar<br />
observations of the 3 May 1999 Oklahoma City <strong>to</strong>rnado. Wea. Forecasting, 16,<br />
456-471.<br />
Davies, J. M., C. A. Doswell III, D. W. Burgess, and J. F. Weaver, 1994: Some<br />
noteworthy aspects of the Hess<strong>to</strong>n, Kansas, <strong>to</strong>rnado family of 13 March 1990.<br />
Bull. Amer. Meteor. Soc., 75, 1007-1017.<br />
Davies-Jones, R.P., 1986: Tornado dynamics. Thunders<strong>to</strong>rm Morphology and<br />
Dynamics, 2 nd Ed., (E. Kessler, Ed.), University of Oklahoma Press, 197-236.<br />
Davies-Jones, R. P., D. W. Burgess, L. R. Lemon and D. Purcell, 1978: Interpretation of<br />
surface marks and debris patterns from the 24 May 1973 Union City, Oklahoma<br />
<strong>to</strong>rnado. Mon. Wea. Rev., 106, 12-21.<br />
Davies-Jones, R., R.J. Trapp, and H. B. Bluestein: Tornadoes and <strong>to</strong>rnadic s<strong>to</strong>rms.<br />
Severe Convective S<strong>to</strong>rms (C.A. Doswell III, Ed.), Meteor. Monogr., 28, No. 50,<br />
Amer. Meteor. Soc., 167-221<br />
Doswell, C.A. III, and F. P. Ostby, 1982. A Kansas City area guide <strong>to</strong> severe<br />
thunders<strong>to</strong>rms and <strong>to</strong>rnadoes. National Severe S<strong>to</strong>rms Forecast Center, Kansas<br />
City, MO, 29 pp. [out of print]<br />
Doswell, C.A. III, and D.W. Burgess, 1988: On some issues of United States <strong>to</strong>rnado<br />
clima<strong>to</strong>logy. Mon. Wea. Rev., 116, 495-501.<br />
Doswell, C.A. III, and D.W. Burgess, 1993: Tornadoes and <strong>to</strong>rnadic s<strong>to</strong>rms: A review of<br />
conceptual models. The Tornado: Its Structure, Dynamics, Prediction, and<br />
Hazards (C. Church, D. Burgess, C. Doswell, and R. Davies-Jones, Eds.).<br />
Geophys. Monogr. 79, Amer. Geophys. Union, 161-172.<br />
Doswell, C.A. III, and H. E. Brooks, 2002: Lessons learned from the damage produced<br />
by the <strong>to</strong>rnadoes of 3 May 1999. Wea. Forecasting, 17, 611-618.<br />
Dowell, D.C., and H.B. Bluestein, 2002: The 8 June 1995 McLean, Texas, S<strong>to</strong>rm. Part I:<br />
Observations of cyclic <strong>to</strong>rnadogenesis. Mon. Wea. Rev., 130, 2626-2648.<br />
Fielder, B.H., 1993: Numerical simulation of axisymmetric <strong>to</strong>rnadogenesis in forced<br />
convection. The Tornado: Its Structure, Dynamics, Prediction, and Hazards (C.<br />
Church, D. Burgess, C. Doswell, and R. Davies-Jones, Eds.). Geophys. Monogr.<br />
79, Amer. Geophys. Union, 41-48.<br />
92
Fujita, T., 1960: A detailed analysis of the Fargo <strong>to</strong>rnadoes of June 20, 1957. Wea. Bur.<br />
Res. Paper No. 42, U.S. Dept of Commerce, 67 pp. [out of print]<br />
Fujita, T. T., 1970: The Lubbock <strong>to</strong>rnadoes: A study of suction spots. Weatherwise, 23,<br />
160-173.<br />
Fujita, T., D. L. Bradbury , and C. Van Thullenar, 1970: Palm Sunday <strong>to</strong>rnadoes of April<br />
11, 1965. Mon. Wea. Rev., 98, 29-69.<br />
Fujita, T.T., 1971: Proposed characterization of <strong>to</strong>rnadoes and hurricanes by area and<br />
intensity. Satellite and Mesometeorology Research Project Report 91, Univ. of<br />
Chicago, 42 pp.<br />
Fujita, T.T., 1978a: Manual for downburst identification during Project NIMROD.<br />
Satellite and Mesometeorology Research Project Report 156, University of<br />
Chicago, 104 pp.<br />
Fujita, T.T., 1978b: Workbook of <strong>to</strong>rnadoes and high winds for engineering applications,<br />
Satellite and Mesometeorology Research Project Report 165, University of<br />
Chicago, 142 pp.<br />
Fujita, T.T. 1985: The Downburst: Microburst and Macroburst. Univ. of Chicago,<br />
SMRP Res. Paper 210, 122 pp.<br />
Fujita, T.T. 1987: U.S. Tornadoes, Part 1: 70-year Statistics. Satellite and<br />
Mesometeorology Research Project Report 218, Univ. of Chicago, 122 pp.<br />
Fujita, T.T., 1992: Memoirs of an Effort <strong>to</strong> Unlock Mystery of Severe S<strong>to</strong>rms; During<br />
the 50 years 1942-1992. Univ. of Chicago, NTIS Accession No. PB92-182021,<br />
298 pp.<br />
Fujita, T.T., 1993: Plainfield <strong>to</strong>rnado of August 28, 1990. The Tornado: Its Structure,<br />
Dynamics, Prediction, and Hazards (C. Church, D. Burgess, C. Doswell, and R.<br />
Davies-Jones, Eds.). Geophys. Monogr. 79, Amer. Geophys. Union, 1-17.<br />
Fujita, T.T., and B. E. Smith, 1993: Aerial survey and pho<strong>to</strong>graphy of <strong>to</strong>rnado and<br />
microburst damage. The Tornado: Its Structure, Dynamics, Prediction, and<br />
Hazards (C. Church, D. Burgess, C. Doswell, and R. Davies-Jones, Eds.).<br />
Geophys. Monogr. 79, Amer. Geophys. Union, 479-493..<br />
Gall, R. L., 1985: Linear dynamics of the multiple-vortex phenomenon in <strong>to</strong>rnadoes. J.<br />
Atmos. Sci., 42, 761–772.<br />
Guyer, J.L., and M.L. Moritz, 2003: On issues of <strong>to</strong>rnado damage assessment and f-scale<br />
assessment in agricultural areas. Preprints, Fujita Symp. on the Fujita <strong>Scale</strong> and<br />
Severe Weather <strong>Damage</strong> <strong>Assessment</strong>, Long Beach, CA, Amer. Meteor. Soc., no<br />
page numbers available.<br />
Kelly, D.R., J.T. Schaefer, R.P. McNulty, C.A. Doswell III and R.F. Abbey, Jr.,1978: An<br />
augmented <strong>to</strong>rnado clima<strong>to</strong>logy. Mon. Wea. Rev., 106, 1172-1183.<br />
Lemon, L. R., and C. A. Doswell III, 1979: Severe thunders<strong>to</strong>rm evolution and<br />
mesocyclone structure as related <strong>to</strong> <strong>to</strong>rnadogenesis. Mon. Wea. Rev., 107, 1184-<br />
1197.<br />
Lewellen, W.S., 1993: Tornado vortex theory. The Tornado: Its Structure, Dynamics,<br />
Prediction, and Hazards (C. Church, D. Burgess, C. Doswell, and R. Davies-<br />
Jones, Eds.). Geophys. Monogr. 79, Amer. Geophys. Union, 19-39.<br />
Marshall, T.P. 1993: Lessons learned from analyzing <strong>to</strong>rnado damage. The Tornado: Its<br />
Structure, Dynamics, Prediction, and Hazards (C. Church, D. Burgess, C.<br />
93
Doswell, and R. Davies-Jones, Eds.). Geophys. Monogr. 79, Amer. Geophys.<br />
Union, 495-499.<br />
Marshall, T. P., 2002: Tornado damage survey at Moore, Oklahoma. Wea. Forecasting,<br />
17, 582-598.<br />
Marshall, T. P., 2003: The La Plata, MD <strong>to</strong>rnado: Issues regarding the F-scale.<br />
Preprints, Fujita Symp. on the Fujita <strong>Scale</strong> and Severe Weather <strong>Damage</strong><br />
<strong>Assessment</strong>, Long Beach, CA, Amer. Meteor. Soc., no page numbers available.<br />
Marshall, T. P., W.F. Bunting, and J.D. Weithorn, 2003: Procedure for assessing wind<br />
damage <strong>to</strong> wood-framed residences. Preprints, Fujita Symp. on the Fujita <strong>Scale</strong><br />
and Severe Weather <strong>Damage</strong> <strong>Assessment</strong>, Long Beach, CA, Amer. Meteor. Soc.,<br />
no page numbers available.<br />
Minor, J. E., J. R. McDonald, and K.C. Mehta, 1977: The <strong>to</strong>rnado: An engineeringoriented<br />
perspective. NOAA Tech. Memo. ERL NSSL-82, NTIS Accesssion No.<br />
PB-281 860/AS, 196 .pp.<br />
Nolan, D, S., and B. F. Farrell, 1999: The structure and dynamics of <strong>to</strong>rnado-like<br />
vortices. J. Atmos. Sci., 56, 2908–2936.<br />
Peterson, C.J., 2003: Fac<strong>to</strong>rs influencing treefall risk in <strong>to</strong>nradoes in natural forests.<br />
Preprints, Fujita Symp. on the Fujita <strong>Scale</strong> and Severe Weather <strong>Damage</strong><br />
<strong>Assessment</strong>, Long Beach, CA, Amer. Meteor. Soc., no page numbers available.<br />
Phan, L. T., and E. Simiu, 1998: Fujita <strong>to</strong>rnado intensity <strong>Scale</strong>: A critique based on<br />
observations of the Jarrell <strong>to</strong>rnado of May 27, 1997. NIST TN 1426, NTIS<br />
Accession No. PB98-175136, 23 pp.<br />
Phan, L. T., and E. Simiu, 2002: The Fujita scale: A resassessment from a structural<br />
engineering perspective. Proceedings, U.S./Japan Natural Resources<br />
Development Program, Joint meeting 31 st Tech. Memo. of PWRI 3653, Tsukuba,<br />
Japan, 469-474.<br />
Reynolds, G., 1957: A common wind damage pattern in relation <strong>to</strong> the classical <strong>to</strong>rnado.<br />
Bull. Amer. Meteor. Soc., 37, 1-5.<br />
Schmidlin, T.W., B.O. Hammer, P.S. King, and L.S. Miller, 2003: Wind speeds required<br />
<strong>to</strong> upset vehicles. Preprints, Fujita Symp. on the Fujita <strong>Scale</strong> and Severe Weather<br />
<strong>Damage</strong> <strong>Assessment</strong>, Long Beach, CA, Amer. Meteor. Soc., no page numbers<br />
available.<br />
Snow, J. T., 1978: On inertial instability as related <strong>to</strong> the multiple-vortex phenomenon.<br />
J. Atmos. Sci., 35, 1660–1677.<br />
Speheger, D.A., C.A. Doswell III and G.S. Stumpf, 2001: The <strong>to</strong>rnadoes of 3 May 1999:<br />
Event verification in central Oklahoma and related issues. Wea. Forecasting, 16,<br />
362-381.<br />
van Tassell, E.L., 1955: The North Platte valley <strong>to</strong>rnado outbreak of June 27, 1955.<br />
Mon. Wea. Rev., 83, 255-264.<br />
Ward, N.B., 1972: The exploration of certain features of <strong>to</strong>rnado dynamics using a<br />
labora<strong>to</strong>ry model. J. Atmos. Sci., 29, 1194-1204.<br />
Wurman, J, 2002: The multiple-vortex structure of a <strong>to</strong>rnado. Wea. Forecasting, 17,<br />
473-505.<br />
94