2007 Sustainability Report - Baxter Sustainability Report
2007 Sustainability Report - Baxter Sustainability Report
2007 Sustainability Report - Baxter Sustainability Report

Create successful ePaper yourself
Turn your PDF publications into a flip-book with our unique Google optimized e-Paper software.
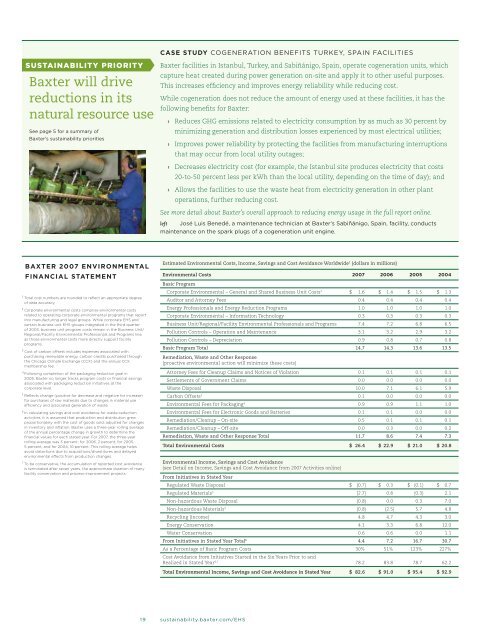
<strong>Sustainability</strong> Priority<strong>Baxter</strong> will drivereductions in itsnatural resource useSee page 5 for a summary of<strong>Baxter</strong>'s sustainability prioritiesCase study COGENERATION BENEFITS TURKEY, SPAIN FACILITIES<strong>Baxter</strong> facilities in Istanbul, Turkey, and Sabiñánigo, Spain, operate cogeneration units, whichcapture heat created during power generation on-site and apply it to other useful purposes.This increases efficiency and improves energy reliability while reducing cost.While cogeneration does not reduce the amount of energy used at these facilities, it has thefollowing benefits for <strong>Baxter</strong>:› Reduces GHG emissions related to electricity consumption by as much as 30 percent byminimizing generation and distribution losses experienced by most electrical utilities;› Improves power reliability by protecting the facilities from manufacturing interruptionsthat may occur from local utility outages;› Decreases electricity cost (for example, the Istanbul site produces electricity that costs20-to-50 percent less per kWh than the local utility, depending on the time of day); and› Allows the facilities to use the waste heat from electricity generation in other plantoperations, further reducing cost.See more detail about <strong>Baxter</strong>’s overall approach to reducing energy usage in the full report online.left José Luis Benedé, a maintenance technician at <strong>Baxter</strong>'s Sabiñánigo, Spain, facility, conductsmaintenance on the spark plugs of a cogeneration unit engine.<strong>Baxter</strong> <strong>2007</strong> EnvironmentalFinancial Statement1Total cost numbers are rounded to reflect an appropriate degreeof data accuracy.2 Corporate environmental costs comprise environmental costsrelated to operating corporate environmental programs that reportinto manufacturing and legal groups. While corporate EHS andcertain business unit EHS groups integrated in the third quarterof 2003, business unit program costs remain in the Business Unit/Regional/Facility Environmental Professionals and Programs line,as those environmental costs more directly support facilityprograms.3 Cost of carbon offsets includes expenses associated withpurchasing renewable energy, carbon credits purchased throughthe Chicago Climate Exchange (CCX) and the annual CCXmembership fee.4Following completion of the packaging reduction goal in2005, <strong>Baxter</strong> no longer tracks program costs or financial savingsassociated with packaging reduction initiatives at thecorporate level.5Reflects change (positive for decrease and negative for increase)for purchases of raw materials due to changes in material useefficiency and associated generation of waste.6In calculating savings and cost avoidance for waste-reductionactivities, it is assumed that production and distribution grewproportionately with the cost of goods sold, adjusted for changesin inventory and inflation. <strong>Baxter</strong> uses a three-year rolling averageof the annual percentage change in growth to determine thefinancial values for each stated year. For <strong>2007</strong>, the three-yearrolling average was 3 percent; for 2006, 2 percent; for 2005,5 percent; and for 2004, 10 percent. This rolling average helpsavoid distortions due to acquisitions/divestitures and delayedenvironmental effects from production changes.7 To be conservative, the accumulation of reported cost avoidanceis terminated after seven years, the approximate duration of manyfacility conservation and process-improvement projects.Estimated Environmental Costs, Income, Savings and Cost Avoidance Worldwide 1 (dollars in millions)Environmental Costs <strong>2007</strong> 2006 2005 2004Basic ProgramCorporate Environmental – General and Shared Business Unit Costs 2 $ 1.6 $ 1.4 $ 1.5 $ 1.3Auditor and Attorney Fees 0.4 0.4 0.4 0.4Energy Professionals and Energy Reduction Programs 1.0 1.0 1.0 1.0Corporate Environmental – Information Technology 0.3 0.3 0.3 0.3Business Unit/Regional/Facility Environmental Professionals and Programs 7.4 7.2 6.8 6.5Pollution Controls – Operation and Maintenance 3.1 3.2 2.9 3.2Pollution Controls – Depreciation 0.9 0.8 0.7 0.8Basic Program Total 14.7 14.3 13.6 13.5Remediation, Waste and Other Response(proactive environmental action will minimize these costs)Attorney Fees for Cleanup Claims and Notices of Violation 0.1 0.1 0.1 0.1Settlements of Government Claims 0.0 0.0 0.0 0.0Waste Disposal 10.0 7.1 6.1 5.9Carbon Offsets 3 0.1 0.0 0.0 0.0Environmental Fees for Packaging 4 0.9 0.9 1.1 1.0Environmental Fees for Electronic Goods and Batteries 0.1 0.1 0.0 0.0Remediation/Cleanup – On-site 0.5 0.1 0.1 0.1Remediation/Cleanup – Off-site 0.0 0.3 0.0 0.2Remediation, Waste and Other Response Total 11.7 8.6 7.4 7.3Total Environmental Costs $ 26.4 $ 22.9 $ 21.0 $ 20.8Environmental Income, Savings and Cost Avoidance(see Detail on Income, Savings and Cost Avoidance from <strong>2007</strong> Activities online)From Initiatives in Stated YearRegulated Waste Disposal $ (0.7) $ 0.3 $ (0.1) $ 0.7Regulated Materials 5 (2.7) 0.8 (0.3) 2.1Non-hazardous Waste Disposal (0.8) 0.0 0.3 7.0Non-hazardous Materials 5 (0.8) (2.5) 5.7 4.8Recycling (income) 4.8 4.7 4.3 3.0Energy Conservation 4.1 3.3 6.8 12.0Water Conservation 0.6 0.6 0.0 1.1From Initiatives in Stated Year Total 6 4.4 7.2 16.7 30.7As a Percentage of Basic Program Costs 30% 51% 123% 227%Cost Avoidance from Initiatives Started in the Six Years Prior to andRealized in Stated Year 6,7 78.2 83.8 78.7 62.2Total Environmental Income, Savings and Cost Avoidance in Stated Year $ 82.6 $ 91.0 $ 95.4 $ 92.919 sustainability.baxter.com/EHS