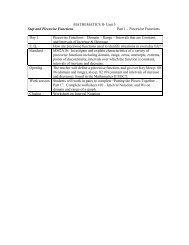
Linear and Quadratic Regression - Ciclt.net
Linear and Quadratic Regression - Ciclt.net
Linear and Quadratic Regression - Ciclt.net

You also want an ePaper? Increase the reach of your titles
YUMPU automatically turns print PDFs into web optimized ePapers that Google loves.
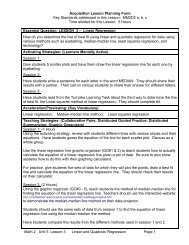
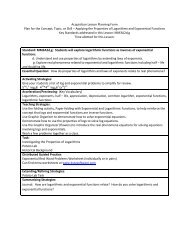
working with real data that they have collected through measurement, they further explore howreal data that is well-modeled by a linear or quadratic function differs from an exact linear orquadratic model.The overall theme of the unit is finding linear, quadratic, or absolute value functions to modelsets of data. A major emphasis is placed on analyzing models for goodness of fit <strong>and</strong>underst<strong>and</strong>ing issues in using the models to predict other data points for the same context.Throughout this unit it is assumed that students have access to a graphing utility that cangraph scatter plots <strong>and</strong> graphs of functions given by formula on the same coordinate axes <strong>and</strong>to technology for calculating median-median lines, least squares regression lines, correlationcoefficients, <strong>and</strong> quadratic regression.Throughout the unit, there needs to be careful attention to use of correct terminology inreference to data sets, statistical computations, <strong>and</strong> functions which model sets of data. Theunit also involves analysis of many statistical issues that require discussion <strong>and</strong> explanation.Therefore, throughout this unit, students should regularly communicate their reasoning aboutthe mathematics <strong>and</strong> the statistical issues in writing as well as orally in class discussions.Vocabulary <strong>and</strong> Formulas:Correlation coefficient – The correlation coefficient, r, measures the direction <strong>and</strong> strength of a1 ⎛ x ⎛ ⎞i− x ⎞ y −linear relationship between two variables. Formula:⎜iyr = ∑⎟⎜⎟ .n −1⎝ sx ⎠⎝sy ⎠Extrapolation – the use of a regression curve to make predictions for a value of theindependent variable less than the smallest, or greater than the largest, value of theindependent variable occurring with the data set that the regression curve models.Interpolation – the use of a regression curve to make predictions for a value of the independentvariable that is between two values of the independent variable occurring with the data set thatthe regression curve models.<strong>Linear</strong> regression line – A straight line that approximates the relationship between twovariables represented by a set of data points.Least squares regression line (LSRL) – the line that minimizes the sum of the squares of thevertical distances between the data points <strong>and</strong> any possible regression line.Median-median line – a linear regression line found by a method based on the calculation ofmedians. This method of linear regression requires that the data points are ordered fromsmallest to largest first coordinate <strong>and</strong> then separates the data into three equal, or nearlyequal, groups with at least 1/3 of the data points in each of the first <strong>and</strong> last groups. Themedian x-values <strong>and</strong> y-values of each group are calculated. These medians, from smallest x-values to largest, are named ( x1, y1),( x2,y2),( x3,y3). Then a line through the first <strong>and</strong> thirdmedians is found. Finally, a line parallel to this line, 1/3 of the distance between the line <strong>and</strong>the remaining median is formed. The resulting line is of the followingy3 − y1y1 + y2+ y3− a( x1+ x2+ x3)form y = ax + b, a = , b =. This method of regression is morex3− x13resistant to outliers than the least squares regression line.Math 2 Unit 6 <strong>Linear</strong> <strong>and</strong> <strong>Quadratic</strong> <strong>Regression</strong> Intro <strong>and</strong> St<strong>and</strong>ards Page 6