Department of Mathematics & Statistics STAT 2593 Midterm ...
Department of Mathematics & Statistics STAT 2593 Midterm ...
Department of Mathematics & Statistics STAT 2593 Midterm ...

Create successful ePaper yourself
Turn your PDF publications into a flip-book with our unique Google optimized e-Paper software.
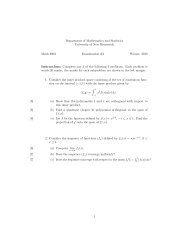
A set <strong>of</strong> exam scores was analyzed in Minitab, with the following results:MTB > desc ’Scores’Variable N Mean Median TrMean StDev SE MeanScores 40 78.28 ***** 78.19 9.53 1.51Variable Minimum Maximum Q1 Q3Scores 60.00 98.00 70.00 85.00MTB > stem ’Scores’Stem-and-leaf <strong>of</strong> Scores N = 40Leaf Unit = 1.03 6 0349 6 66789917 7 0012224417 7(12) 8 00111112234411 8 55578994 9 032 9 584. What is the median <strong>of</strong> this set <strong>of</strong> scores?8.15. Taking the 1st and 3rd quartiles to be the same thing as the “hinges” or “forths” <strong>of</strong>a boxplot, what is the lowest value that the tip <strong>of</strong> the left hand whisker for such aboxplot could have? I.e. what is the value <strong>of</strong> the “lower fence”?47.56. What is the actual value <strong>of</strong> the tip <strong>of</strong> the left hand whisker?60Suppose that 70% <strong>of</strong> light aircraft lost in flight over a certain region are subsequently found.Of the aircraft that are found, 60% have an emergency locator; <strong>of</strong> the aircraft that are notfound, only 10% have an emergency locator.7. What is the probability that an aircraft lost over this region is subsequently foundand has an emergency locator?0.422
![1]] CHAPTER 2 LIMITS AND DERIVATIVES](https://img.yumpu.com/40053548/1/190x245/1-chapter-2-limits-and-derivatives.jpg?quality=85)