Department of Mathematics & Statistics STAT 2593 Midterm ...
Department of Mathematics & Statistics STAT 2593 Midterm ...
Department of Mathematics & Statistics STAT 2593 Midterm ...

Create successful ePaper yourself
Turn your PDF publications into a flip-book with our unique Google optimized e-Paper software.
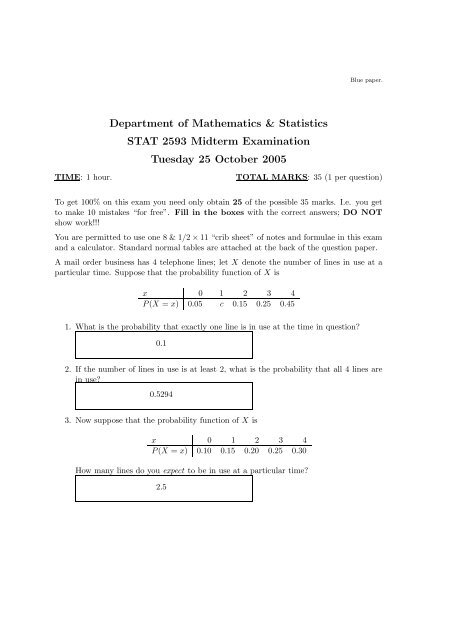
Blue paper.<strong>Department</strong> <strong>of</strong> <strong>Mathematics</strong> & <strong>Statistics</strong><strong>STAT</strong> <strong>2593</strong> <strong>Midterm</strong> ExaminationTuesday 25 October 2005TIME: 1 hour.TOTAL MARKS: 35 (1 per question)To get 100% on this exam you need only obtain 25 <strong>of</strong> the possible 35 marks. I.e. you getto make 10 mistakes “for free”. Fill in the boxes with the correct answers; DO NOTshow work!!!You are permitted to use one 8 & 1/2 × 11 “crib sheet” <strong>of</strong> notes and formulae in this examand a calculator. Standard normal tables are attached at the back <strong>of</strong> the question paper.A mail order business has 4 telephone lines; let X denote the number <strong>of</strong> lines in use at aparticular time. Suppose that the probability function <strong>of</strong> X isx 0 1 2 3 4P (X = x) 0.05 c 0.15 0.25 0.451. What is the probability that exactly one line is in use at the time in question?0.12. If the number <strong>of</strong> lines in use is at least 2, what is the probability that all 4 lines arein use?0.52943. Now suppose that the probability function <strong>of</strong> X isx 0 1 2 3 4P (X = x) 0.10 0.15 0.20 0.25 0.30How many lines do you expect to be in use at a particular time?2.5
A set <strong>of</strong> exam scores was analyzed in Minitab, with the following results:MTB > desc ’Scores’Variable N Mean Median TrMean StDev SE MeanScores 40 78.28 ***** 78.19 9.53 1.51Variable Minimum Maximum Q1 Q3Scores 60.00 98.00 70.00 85.00MTB > stem ’Scores’Stem-and-leaf <strong>of</strong> Scores N = 40Leaf Unit = 1.03 6 0349 6 66789917 7 0012224417 7(12) 8 00111112234411 8 55578994 9 032 9 584. What is the median <strong>of</strong> this set <strong>of</strong> scores?8.15. Taking the 1st and 3rd quartiles to be the same thing as the “hinges” or “forths” <strong>of</strong>a boxplot, what is the lowest value that the tip <strong>of</strong> the left hand whisker for such aboxplot could have? I.e. what is the value <strong>of</strong> the “lower fence”?47.56. What is the actual value <strong>of</strong> the tip <strong>of</strong> the left hand whisker?60Suppose that 70% <strong>of</strong> light aircraft lost in flight over a certain region are subsequently found.Of the aircraft that are found, 60% have an emergency locator; <strong>of</strong> the aircraft that are notfound, only 10% have an emergency locator.7. What is the probability that an aircraft lost over this region is subsequently foundand has an emergency locator?0.422
8. What is the probability that an aircraft lost over this region is not subsequently foundand does not have an emergency locator?0.27In another region, 35% <strong>of</strong> the aircraft that are lost have emergency locators. Of those thathave emergency locators, 90% are subsequently found; <strong>of</strong> those with no emergency locator,45% are subsequently found. A tree diagram illustrating this scenario is as follows:Found0.315Has E. loc.0.350.90.1Not found0.0350.65Found0.2925No E. loc.0.450.55Not found0.35759. What is the probability that an aircraft which is lost over this second region is notsubsequently found?0.392510. If an aircraft which disappears in this second region is subsequently found, what isthe probability that it has an emergency locator?0.51853
Suppose that ’flu outbreaks occur, in a city called Neyman, independently <strong>of</strong> each other,and that the average interval between outbreaks is 8 months (2/3 <strong>of</strong> a year).11. What is the probability <strong>of</strong> there being exactly 4 ’flu outbreaks in Neyman in a 4 yearperiod?0.1339Suppose that the force acting on a column that helps to support a building is normallydistributed with mean 15.0 kips, and standard deviation 1.25 kips.12. What is the probability that the force is at least 16.8 kips?0.0749A set <strong>of</strong> data on allowable mechanical properties for structural design <strong>of</strong> metallic aerospacevehicles contained data on the tensile ultimate strength in ksi. <strong>of</strong> a number <strong>of</strong> specimens.Shown below are a boxplot and a stem-and-leaf plot <strong>of</strong> these data.Mechanical Properties Allowable for Metals125 130 135 140 145tensile ultimate strength (ksi)13. From this boxplot, what (approximately) is the median <strong>of</strong> these data?13514. From this boxplot, what (approximately) is the interquartile range <strong>of</strong> these data?54
A stem-and-leaf plot <strong>of</strong> these data (on tensile ultimate strength) is as follows:MTB > stem ’strength’Stem-and-leaf <strong>of</strong> strength N = 153Leaf Unit = 1.01 12 33 12 4510 12 666777716 12 88999928 13 00001111111153 13 2222222222333333333333333(38) 13 4444444444444444445555555555555555555562 13 666666666666777777777740 13 88888888888899999922 14 000000111112 14 23333335 14 44451 14 715. Referring to this stem-and-leaf plot, and the preceding boxplot, list the values <strong>of</strong> all outliersin the tensile ultimate strength data.123, 124, 125, 14716. Let X be the ultimate tensile strength <strong>of</strong> an item drawn at random from the population fromwhich the sample <strong>of</strong> tensile ultimate strengths was drawn. The foregoing stem-and-leaf plotrepresents the distribution <strong>of</strong> this sample. This may be considered to be an estimate <strong>of</strong> thedistribution <strong>of</strong> X. Use this idea to estimate P (125 ≤ X ≤ 130).0.11765
Suppose that 30% <strong>of</strong> all desktop computers in use today are made by the Dingle Brand ComputerCompany. Suppose that the probability that a desktop computer has at least one crash during anygiven month is 0.15. Let D be the event that a randomly chosen desktop computer is a Dingle Brandmachine, and let C be the event that that computer has at least one crash this month. What is thevalue <strong>of</strong> P (D ∩ C):17. If D and C are independent?0.04518. If D and C are mutually exclusive?019. If P (D ∪ C) = 0.35?0.120. If P (C|D) = 0.2?0.0621. If P (D|C) = 0.2?0.0322. If D ′ and C are mutually exclusive?0.1523. If D ′ and C are independent?0.045Of the eggs sold as “cracked” in New Brunswick, only 20% actually have discernible cracks.24. Suppose that you buy a “half-carton” <strong>of</strong> these so-called cracked eggs (i.e. 6 such eggs). Assumethat the six eggs in the carton constitute a random sample from the population <strong>of</strong> all eggswhich are sold as “cracked”. What is the probability that precisely two <strong>of</strong> the eggs in yourhalf-carton have discernible cracks?0.24586
25. Under the given assumptions the probability that a half-carton <strong>of</strong> eggs contains no eggs withdiscernible cracks is 0.2621 (to 4 decimal places). How many half-cartons would you expect tobuy before getting one entirely free <strong>of</strong> eggs with discernible cracks? (NOTE: “before” meansthat you don’t count that first “good” carton amongst the ones you buy.)2.815326. What is the probability that you buy at least seven half-cartons before you get one which isentirely free <strong>of</strong> eggs with discernible cracks?0.1191Cubical crystals <strong>of</strong> a certain substance have an edge length in mm with probability density functionequal t<strong>of</strong>(x) = 11.375 × 1 x 2 for 0.5 ≤ x ≤ 1.6(f(x) ≡ 0 elsewhere).27. What is the expected volume <strong>of</strong> such a crystal?0.84Let X denote the amount <strong>of</strong> time for which a book on 2 hour reserve is checked out <strong>of</strong> the Engineeringlibrary by a randomly selected student. Suppose that X has cumulative distribution function⎧⎨ 0 x ≤ 0F (x) =2x⎩ 3 − x290 ≤ x ≤ 31 x ≥ 328. What is the probability that the student has to pay a fine? (I.e. what is the probability thatthe student brings the book back after more than 2 hours?)1/9 = 0.111129. What is the probability density function <strong>of</strong> X? (Be sure to specify the value <strong>of</strong> this p.d.f. forall values <strong>of</strong> x.)2/3 − 2x/9 0 ≤ x ≤ 3, 0 elsewhereSuppose that the time that a randomly selected Engineering pr<strong>of</strong>essor keeps a book (on “regularloan”) from the Engineering library is Gamma distributed with mean 49 days, and standard deviation14 days.30. What is the value <strong>of</strong> β (i.e. “shape parameter” or in Minitab terminology “second shapeparameter”) for this distribution?47
A machine has a component which is subject to deterioration over time. A backup component issupplied, along with the machine, at the time that the machine is purchased. Suppose that theoriginal component has a lifetime (in years) which is Gamma distributed with parameters α = 30and β = 0.2; the backup component has a a lifetime (in years) which is Gamma distributed withparameters α = 10 and β = 0.5.31. How long do you expect the machine to last, all told? (I.e. what is the expected total lifetime<strong>of</strong> the two components, original and backup)?11 years32. Assume that the lifetime <strong>of</strong> the backup component is independent <strong>of</strong> the lifetime <strong>of</strong> the originalcomponent. What is the variance <strong>of</strong> the time that the machine lasts? (I.e. what is the variance<strong>of</strong> the total lifetime <strong>of</strong> the two components, original and backup)?3.7 years 2The breaking strength <strong>of</strong> rivets <strong>of</strong> a certain type has a mean value <strong>of</strong> 10,000 psi and a standarddeviation <strong>of</strong> 500 psi. A random sample <strong>of</strong> 40 such rivets is obtained.33. What (approximately) is the probability that the sample mean breaking strength is between9900 and 10200 psi?0.890534. What is the name <strong>of</strong> the theorem that allows you to make the foregoing approximation?The Central Limit TheoremThe rain in Spain has an annual mean <strong>of</strong> 17 inches, with a standard deviation <strong>of</strong> 4 inches. The rainin Calcutta 1 has an annual mean <strong>of</strong> 64 inches with a standard deviation <strong>of</strong> 12 inches. Assume thesetwo random variables to be normally distributed and to be independent <strong>of</strong> each other (a dubiousassumption, but make it anyway).35. What is the probability that the rainfall in Calcutta in a given year exceeds the rainfall inSpain in the same year by more than 55 inches?0.26431 The rain in Spain stays mainly in the plain; the rain in Calcutta stays mainly in the gutta.8
![1]] CHAPTER 2 LIMITS AND DERIVATIVES](https://img.yumpu.com/40053548/1/190x245/1-chapter-2-limits-and-derivatives.jpg?quality=85)