National Vital Statistics Reports, Vol. 61, No. 5
National Vital Statistics Reports, Vol. 61, No. 5
National Vital Statistics Reports, Vol. 61, No. 5

Create successful ePaper yourself
Turn your PDF publications into a flip-book with our unique Google optimized e-Paper software.
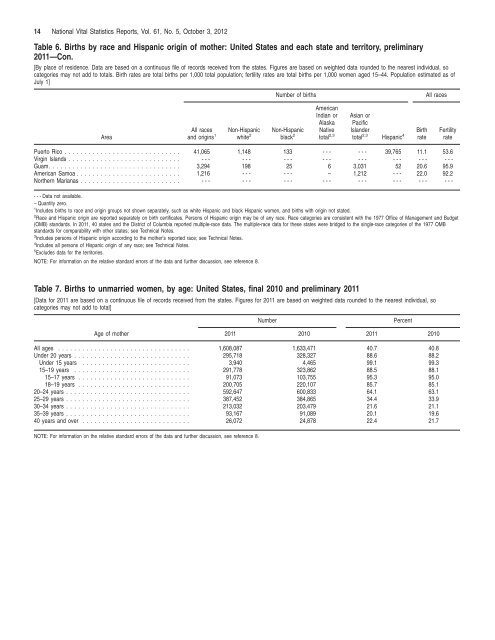
14 <strong>National</strong> <strong>Vital</strong> <strong>Statistics</strong> <strong>Reports</strong>, <strong>Vol</strong>. <strong>61</strong>, <strong>No</strong>. 5, October 3, 2012Table 6. Births by race and Hispanic origin of mother: United States and each state and territory, preliminary2011—Con.[By place of residence. Data are based on a continuous file of records received from the states. Figures are based on weighted data rounded to the nearest individual, socategories may not add to totals. Birth rates are total births per 1,000 total population; fertility rates are total births per 1,000 women aged 15–44. Population estimated as ofJuly 1]Number of birthsAll racesAreaAll racesand origins 1<strong>No</strong>n-Hispanicwhite 2<strong>No</strong>n-Hispanicblack 2AmericanIndian orAlaskaNativetotal 2,3Asian orPacificIslanderBirthtotal 2,3 Hispanic 4 rateFertilityratePuerto Rico ............................. 41,065 1,148 133 - - - - 39,765 11.1 53.6Virgin Islands ............................ -- -- -- -- -- -- -- --Guam. ................................ 3,294 198 25 6 3,031 52 20.6 95.9American Samoa .......................... 1,216 - - - - – 1,212 - - 22.0 92.2<strong>No</strong>rthern Marianas ......................... -- -- -- -- -- -- -- --- - - Data not available.– Quantity zero.1 Includes births to race and origin groups not shown separately, such as white Hispanic and black Hispanic women, and births with origin not stated.2 Race and Hispanic origin are reported separately on birth certificates. Persons of Hispanic origin may be of any race. Race categories are consistent with the 1977 Office of Management and Budget(OMB) standards. In 2011, 40 states and the District of Columbia reported multiple-race data. The multiple-race data for these states were bridged to the single-race categories of the 1977 OMBstandards for comparability with other states; see Technical <strong>No</strong>tes.3 Includes persons of Hispanic origin according to the mother’s reported race; see Technical <strong>No</strong>tes.4 Includes all persons of Hispanic origin of any race; see Technical <strong>No</strong>tes.5 Excludes data for the territories.NOTE: For information on the relative standard errors of the data and further discussion, see reference 8.Table 7. Births to unmarried women, by age: United States, final 2010 and preliminary 2011[Data for 2011 are based on a continuous file of records received from the states. Figures for 2011 are based on weighted data rounded to the nearest individual, socategories may not add to total]NumberPercentAge of mother 2011 2010 2011 2010All ages ................................. 1,608,087 1,633,471 40.7 40.8Under 20 years ............................. 295,718 328,327 88.6 88.2Under 15 years ........................... 3,940 4,465 99.1 99.315–19 years ............................. 291,778 323,862 88.5 88.115–17 years ............................ 91,073 103,755 95.3 95.018–19 years ............................ 200,705 220,107 85.7 85.120–24 years ............................... 592,647 600,833 64.1 63.125–29 years ............................... 387,452 384,865 34.4 33.930–34 years ............................... 213,032 203,479 21.6 21.135–39 years ............................... 93,167 91,089 20.1 19.640 years and over ........................... 26,072 24,878 22.4 21.7NOTE: For information on the relative standard errors of the data and further discussion, see reference 8.