National Vital Statistics Reports, Vol. 61, No. 5
National Vital Statistics Reports, Vol. 61, No. 5
National Vital Statistics Reports, Vol. 61, No. 5

Create successful ePaper yourself
Turn your PDF publications into a flip-book with our unique Google optimized e-Paper software.
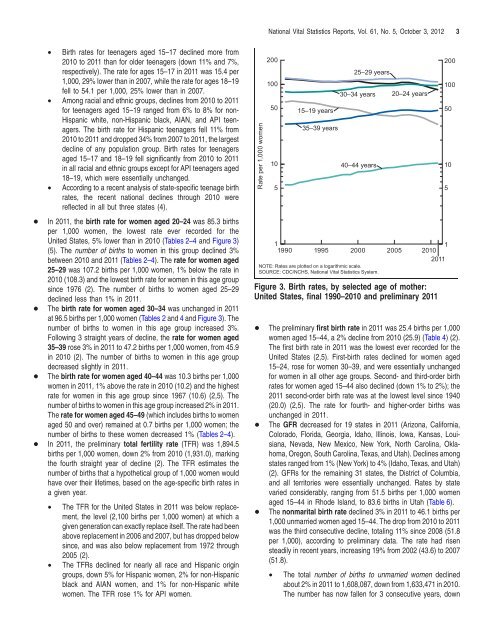
<strong>National</strong> <strong>Vital</strong> <strong>Statistics</strong> <strong>Reports</strong>, <strong>Vol</strong>. <strong>61</strong>, <strong>No</strong>. 5, October 3, 20123• Birth rates for teenagers aged 15–17 declined more from2010 to 2011 than for older teenagers (down 11% and 7%,respectively). The rate for ages 15–17 in 2011 was 15.4 per1,000, 29% lower than in 2007, while the rate for ages 18–19fell to 54.1 per 1,000, 25% lower than in 2007.• Among racial and ethnic groups, declines from 2010 to 2011for teenagers aged 15–19 ranged from 6% to 8% for non-Hispanic white, non-Hispanic black, AIAN, and API teenagers.The birth rate for Hispanic teenagers fell 11% from2010 to 2011 and dropped 34% from 2007 to 2011, the largestdecline of any population group. Birth rates for teenagersaged 15–17 and 18–19 fell significantly from 2010 to 2011in all racial and ethnic groups except for API teenagers aged18–19, which were essentially unchanged.• According to a recent analysis of state-specific teenage birthrates, the recent national declines through 2010 werereflected in all but three states (4).+ In 2011, the birth rate for women aged 20–24 was 85.3 birthsper 1,000 women, the lowest rate ever recorded for theUnited States, 5% lower than in 2010 (Tables 2–4 and Figure 3)(5). The number of births to women in this group declined 3%between 2010 and 2011 (Tables 2–4). The rate for women aged25–29 was 107.2 births per 1,000 women, 1% below the rate in2010 (108.3) and the lowest birth rate for women in this age groupsince 1976 (2). The number of births to women aged 25–29declined less than 1% in 2011.+ The birth rate for women aged 30–34 was unchanged in 2011at 96.5 births per 1,000 women (Tables 2 and 4 and Figure 3). Thenumber of births to women in this age group increased 3%.Following 3 straight years of decline, the rate for women aged35–39 rose 3% in 2011 to 47.2 births per 1,000 women, from 45.9in 2010 (2). The number of births to women in this age groupdecreased slightly in 2011.+ The birth rate for women aged 40–44 was 10.3 births per 1,000women in 2011, 1% above the rate in 2010 (10.2) and the highestrate for women in this age group since 1967 (10.6) (2,5). Thenumber of births to women in this age group increased 2% in 2011.The rate for women aged 45–49 (which includes births to womenaged 50 and over) remained at 0.7 births per 1,000 women; thenumber of births to these women decreased 1% (Tables 2–4).+ In 2011, the preliminary total fertility rate (TFR) was 1,894.5births per 1,000 women, down 2% from 2010 (1,931.0), markingthe fourth straight year of decline (2). The TFR estimates thenumber of births that a hypothetical group of 1,000 women wouldhave over their lifetimes, based on the age-specific birth rates ina given year.• The TFR for the United States in 2011 was below replacement,the level (2,100 births per 1,000 women) at which agiven generation can exactly replace itself. The rate had beenabove replacement in 2006 and 2007, but has dropped belowsince, and was also below replacement from 1972 through2005 (2).• The TFRs declined for nearly all race and Hispanic origingroups, down 5% for Hispanic women, 2% for non-Hispanicblack and AIAN women, and 1% for non-Hispanic whitewomen. The TFR rose 1% for API women.Rate per 1,000 women2001005010515–19 years35–39 years25–29 years30–34 years40–44 years20–24 years111990 1995 2000 2005 20102011NOTE: Rates are plotted on a logarithmic scale.SOURCE: CDC/NCHS, <strong>National</strong> <strong>Vital</strong> <strong>Statistics</strong> System.Figure 3. Birth rates, by selected age of mother:United States, final 1990–2010 and preliminary 2011200100+ The preliminary first birth rate in 2011 was 25.4 births per 1,000women aged 15–44, a 2% decline from 2010 (25.9) (Table 4)(2).The first birth rate in 2011 was the lowest ever recorded for theUnited States (2,5). First-birth rates declined for women aged15–24, rose for women 30–39, and were essentially unchangedfor women in all other age groups. Second- and third-order birthrates for women aged 15–44 also declined (down 1% to 2%); the2011 second-order birth rate was at the lowest level since 1940(20.0) (2,5). The rate for fourth- and higher-order births wasunchanged in 2011.+ The GFR decreased for 19 states in 2011 (Arizona, California,Colorado, Florida, Georgia, Idaho, Illinois, Iowa, Kansas, Louisiana,Nevada, New Mexico, New York, <strong>No</strong>rth Carolina, Oklahoma,Oregon, South Carolina, Texas, and Utah). Declines amongstates ranged from 1% (New York) to 4% (Idaho, Texas, and Utah)(2). GFRs for the remaining 31 states, the District of Columbia,and all territories were essentially unchanged. Rates by statevaried considerably, ranging from 51.5 births per 1,000 womenaged 15–44 in Rhode Island, to 83.6 births in Utah (Table 6).+ The nonmarital birth rate declined 3% in 2011 to 46.1 births per1,000 unmarried women aged 15–44. The drop from 2010 to 2011was the third consecutive decline, totaling 11% since 2008 (51.8per 1,000), according to preliminary data. The rate had risensteadily in recent years, increasing 19% from 2002 (43.6) to 2007(51.8).• The total number of births to unmarried women declinedabout 2% in 2011 to 1,608,087, down from 1,633,471 in 2010.The number has now fallen for 3 consecutive years, down50105