National Vital Statistics Reports, Vol. 61, No. 5
National Vital Statistics Reports, Vol. 61, No. 5
National Vital Statistics Reports, Vol. 61, No. 5

Create successful ePaper yourself
Turn your PDF publications into a flip-book with our unique Google optimized e-Paper software.
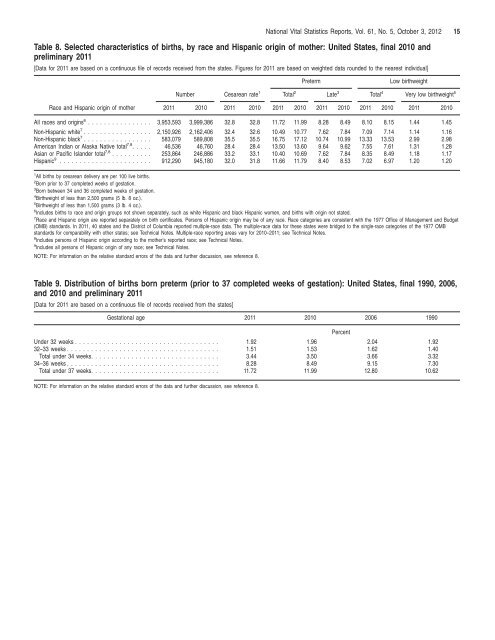
<strong>National</strong> <strong>Vital</strong> <strong>Statistics</strong> <strong>Reports</strong>, <strong>Vol</strong>. <strong>61</strong>, <strong>No</strong>. 5, October 3, 2012 15Table 8. Selected characteristics of births, by race and Hispanic origin of mother: United States, final 2010 andpreliminary 2011[Data for 2011 are based on a continuous file of records received from the states. Figures for 2011 are based on weighted data rounded to the nearest individual]PretermLow birthweightNumber Cesarean rate 1 Total 2 Late 3 Total 4 Very low birthweight 5Race and Hispanic origin of mother 2011 2010 2011 2010 2011 2010 2011 2010 2011 2010 2011 2010All races and origins 6 ................ 3,953,593 3,999,386 32.8 32.8 11.72 11.99 8.28 8.49 8.10 8.15 1.44 1.45<strong>No</strong>n-Hispanic white 7 ................. 2,150,926 2,162,406 32.4 32.6 10.49 10.77 7.62 7.84 7.09 7.14 1.14 1.16<strong>No</strong>n-Hispanic black 7 ................. 583,079 589,808 35.5 35.5 16.75 17.12 10.74 10.99 13.33 13.53 2.99 2.98American Indian or Alaska Native total 7,8 ..... 46,536 46,760 28.4 28.4 13.50 13.60 9.64 9.62 7.55 7.<strong>61</strong> 1.31 1.28Asian or Pacific Islander total 7,8 .......... 253,864 246,886 33.2 33.1 10.40 10.69 7.62 7.84 8.35 8.49 1.18 1.17Hispanic 9 ....................... 912,290 945,180 32.0 31.8 11.66 11.79 8.40 8.53 7.02 6.97 1.20 1.201 All births by cesarean delivery are per 100 live births.2 Born prior to 37 completed weeks of gestation.3 Born between 34 and 36 completed weeks of gestation.4 Birthweight of less than 2,500 grams (5 lb. 8 oz.).5 Birthweight of less than 1,500 grams (3 lb. 4 oz.).6 Includes births to race and origin groups not shown separately, such as white Hispanic and black Hispanic women, and births with origin not stated.7 Race and Hispanic origin are reported separately on birth certificates. Persons of Hispanic origin may be of any race. Race categories are consistent with the 1977 Office of Management and Budget(OMB) standards. In 2011, 40 states and the District of Columbia reported multiple-race data. The multiple-race data for these states were bridged to the single-race categories of the 1977 OMBstandards for comparability with other states; see Technical <strong>No</strong>tes. Multiple-race reporting areas vary for 2010–2011; see Technical <strong>No</strong>tes.8 Includes persons of Hispanic origin according to the mother’s reported race; see Technical <strong>No</strong>tes.9 Includes all persons of Hispanic origin of any race; see Technical <strong>No</strong>tes.NOTE: For information on the relative standard errors of the data and further discussion, see reference 8.Table 9. Distribution of births born preterm (prior to 37 completed weeks of gestation): United States, final 1990, 2006,and 2010 and preliminary 2011[Data for 2011 are based on a continuous file of records received from the states]Gestational age 2011 2010 2006 1990Under 32 weeks . ...................................32–33 weeks . .....................................Total under 34 weeks. ...............................34–36 weeks . .....................................Total under 37 weeks. ...............................1.921.513.448.2811.721.9<strong>61</strong>.533.508.4911.99Percent2.041.623.669.1512.801.921.403.327.3010.62NOTE: For information on the relative standard errors of the data and further discussion, see reference 8.